Downloaded 152 times

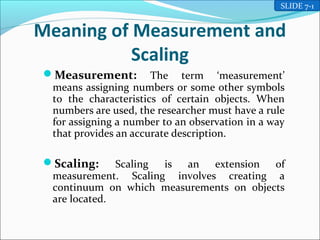


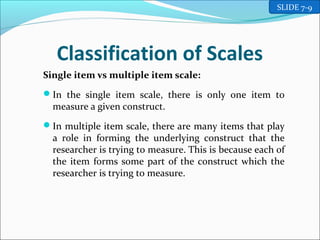


Measurement involves assigning numbers or symbols to characteristics of objects to provide an accurate description. Scaling extends measurement by creating a continuum on which measurements are located. There are four main types of measurement scales: nominal, ordinal, interval, and ratio scales. Scales can be single item or multiple item, and comparative or non-comparative. Common scales include Likert scales, semantic differential scales, and graphic rating scales. Reliability and validity are important criteria for evaluating the quality of measurement scales.