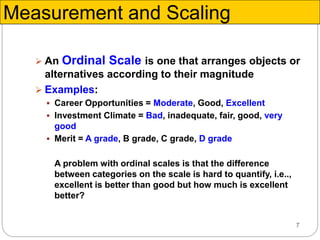
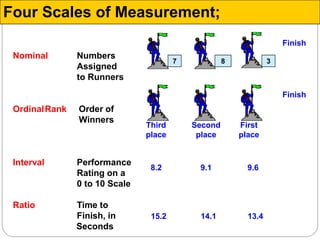
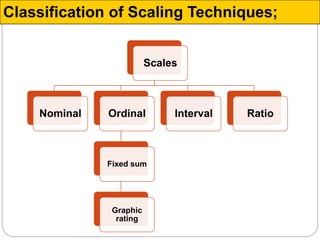
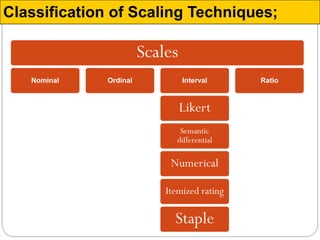
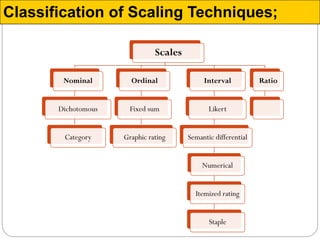
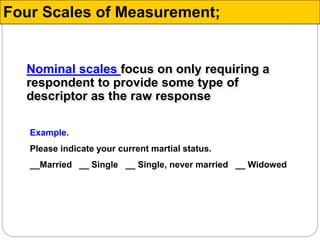
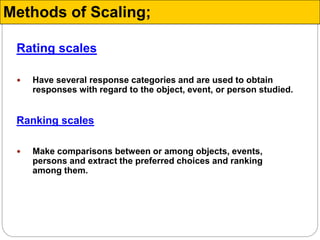
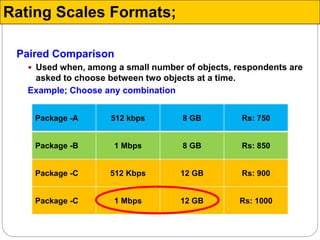
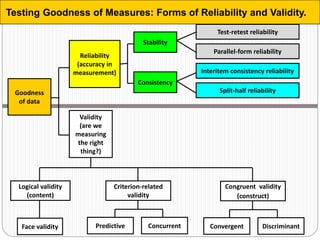
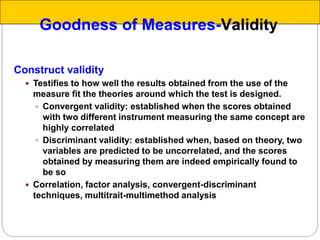
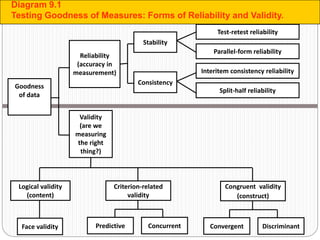
The document discusses different types of measurement scales used in research including nominal, ordinal, interval, and ratio scales. It provides examples of each scale and the types of numerical operations that can be performed on data for each scale. Nominal scales involve simple sorting into categories while ratio scales allow for absolute comparisons between values. The document also covers various rating scale formats researchers can use to measure attributes, including Likert scales, semantic differential scales, and graphic rating scales. Reliability and validity are discussed as important aspects of ensuring measurement instruments accurately measure the intended constructs.
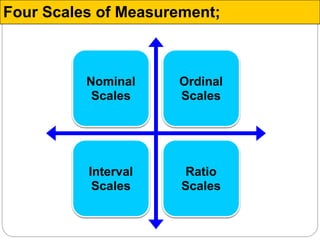
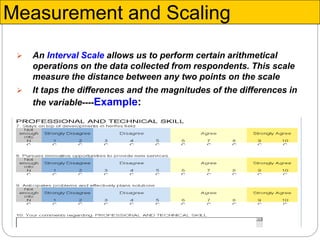
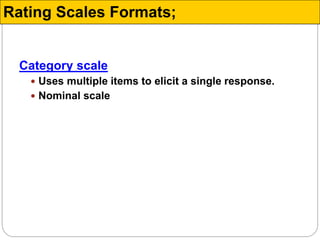
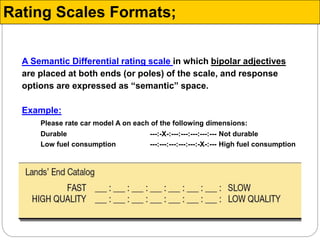
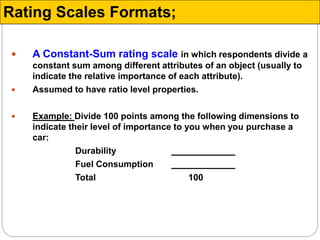
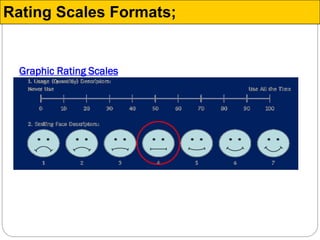
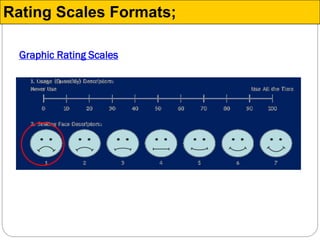
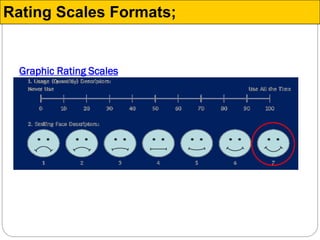
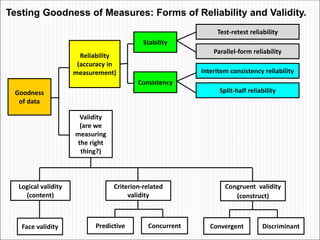
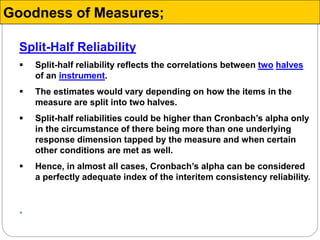
![A Category rating scale which the response options
provided for a closed-ended question are labeled
with specific verbal descriptions.
Example:
Please rate car model A on each of the following
dimensions:
Poor Fair Good V. good Excellent
a) Durability [ ] [ ] [ ] [ ] [ ]
b) Fuel consumption [ ] [ ] [ ] [ ] [ ]
Rating Scales Formats;](https://image.slidesharecdn.com/rmch-7-161222024622/85/Research-Method-for-Business-chapter-7-24-320.jpg)
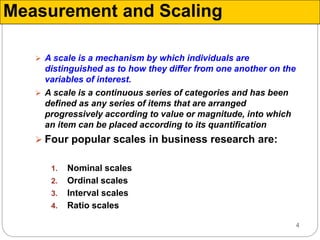
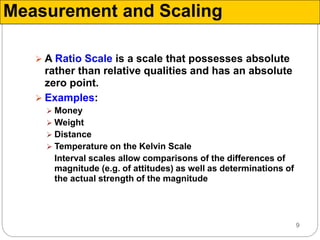
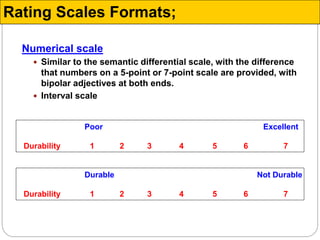
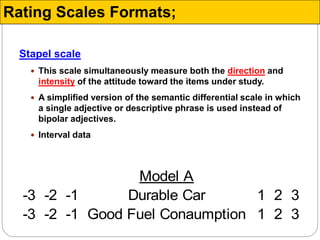
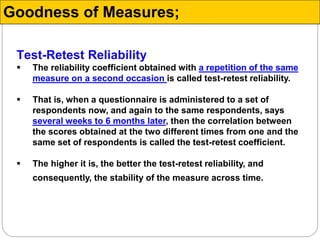
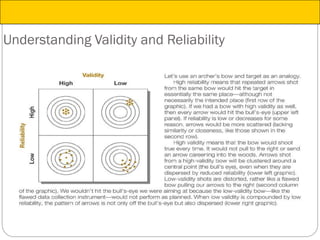
![A simple category scale with only two response categories
(or scale points) both of which are labeled.
Example:
Please rate brand A on each of the following dimensions:
poor excellent
a) Durability [ ] [ ]
b) Fuel consumption [ ] [ ]
Rating Scales Formats;](https://image.slidesharecdn.com/rmch-7-161222024622/85/Research-Method-for-Business-chapter-7-25-320.jpg)
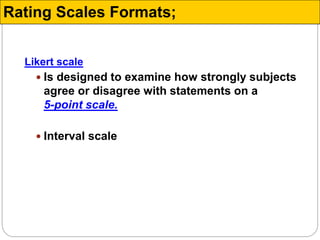
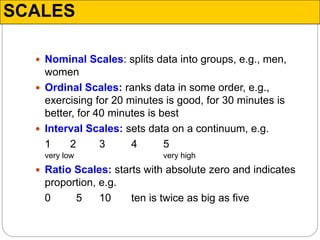
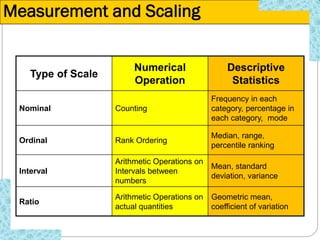
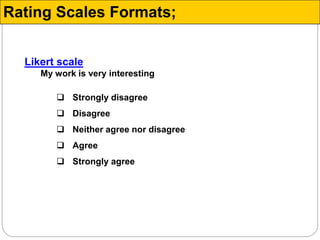
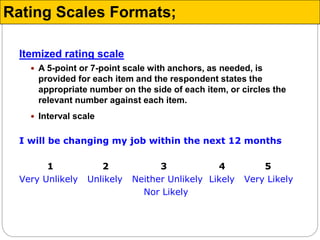
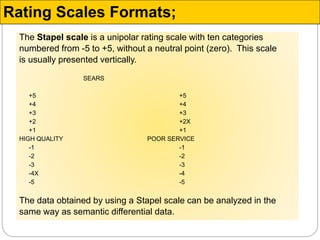
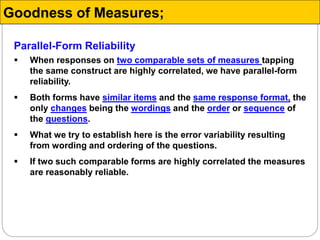
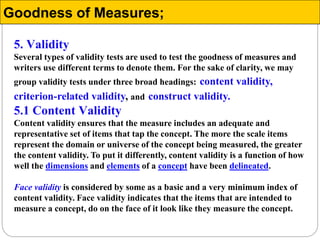
![The Likert Scale (Summated Ratings Scale)
A multiple item rating scale in which the degree of an attribute
possessed by an object is determined by asking respondents to
agree or disagree with a series of positive and/or negative
statements describing the object.
Example:
Totally
disagree Disagree Neutral Agree
Totally
agree
a) Shopping takes much longer on the Internet [ ] [ ] [ ] [ ] [ ]
b) It is a good thing that Saudi consumers have
the opportunity to buy products through the [ ] [ ] [ ] [ ] [ ]
c) Buying products over the Internet is not a
sensible thing to do [ ] [ ] [ ] [ ] [ ]
Attitude toward buying from the Internet
Rating Scales Formats;](https://image.slidesharecdn.com/rmch-7-161222024622/85/Research-Method-for-Business-chapter-7-27-320.jpg)


![business research method chp 7]](https://cdn.slidesharecdn.com/ss_thumbnails/brmchp7-160111102915-thumbnail.jpg?width=640&height=640&fit=bounds)