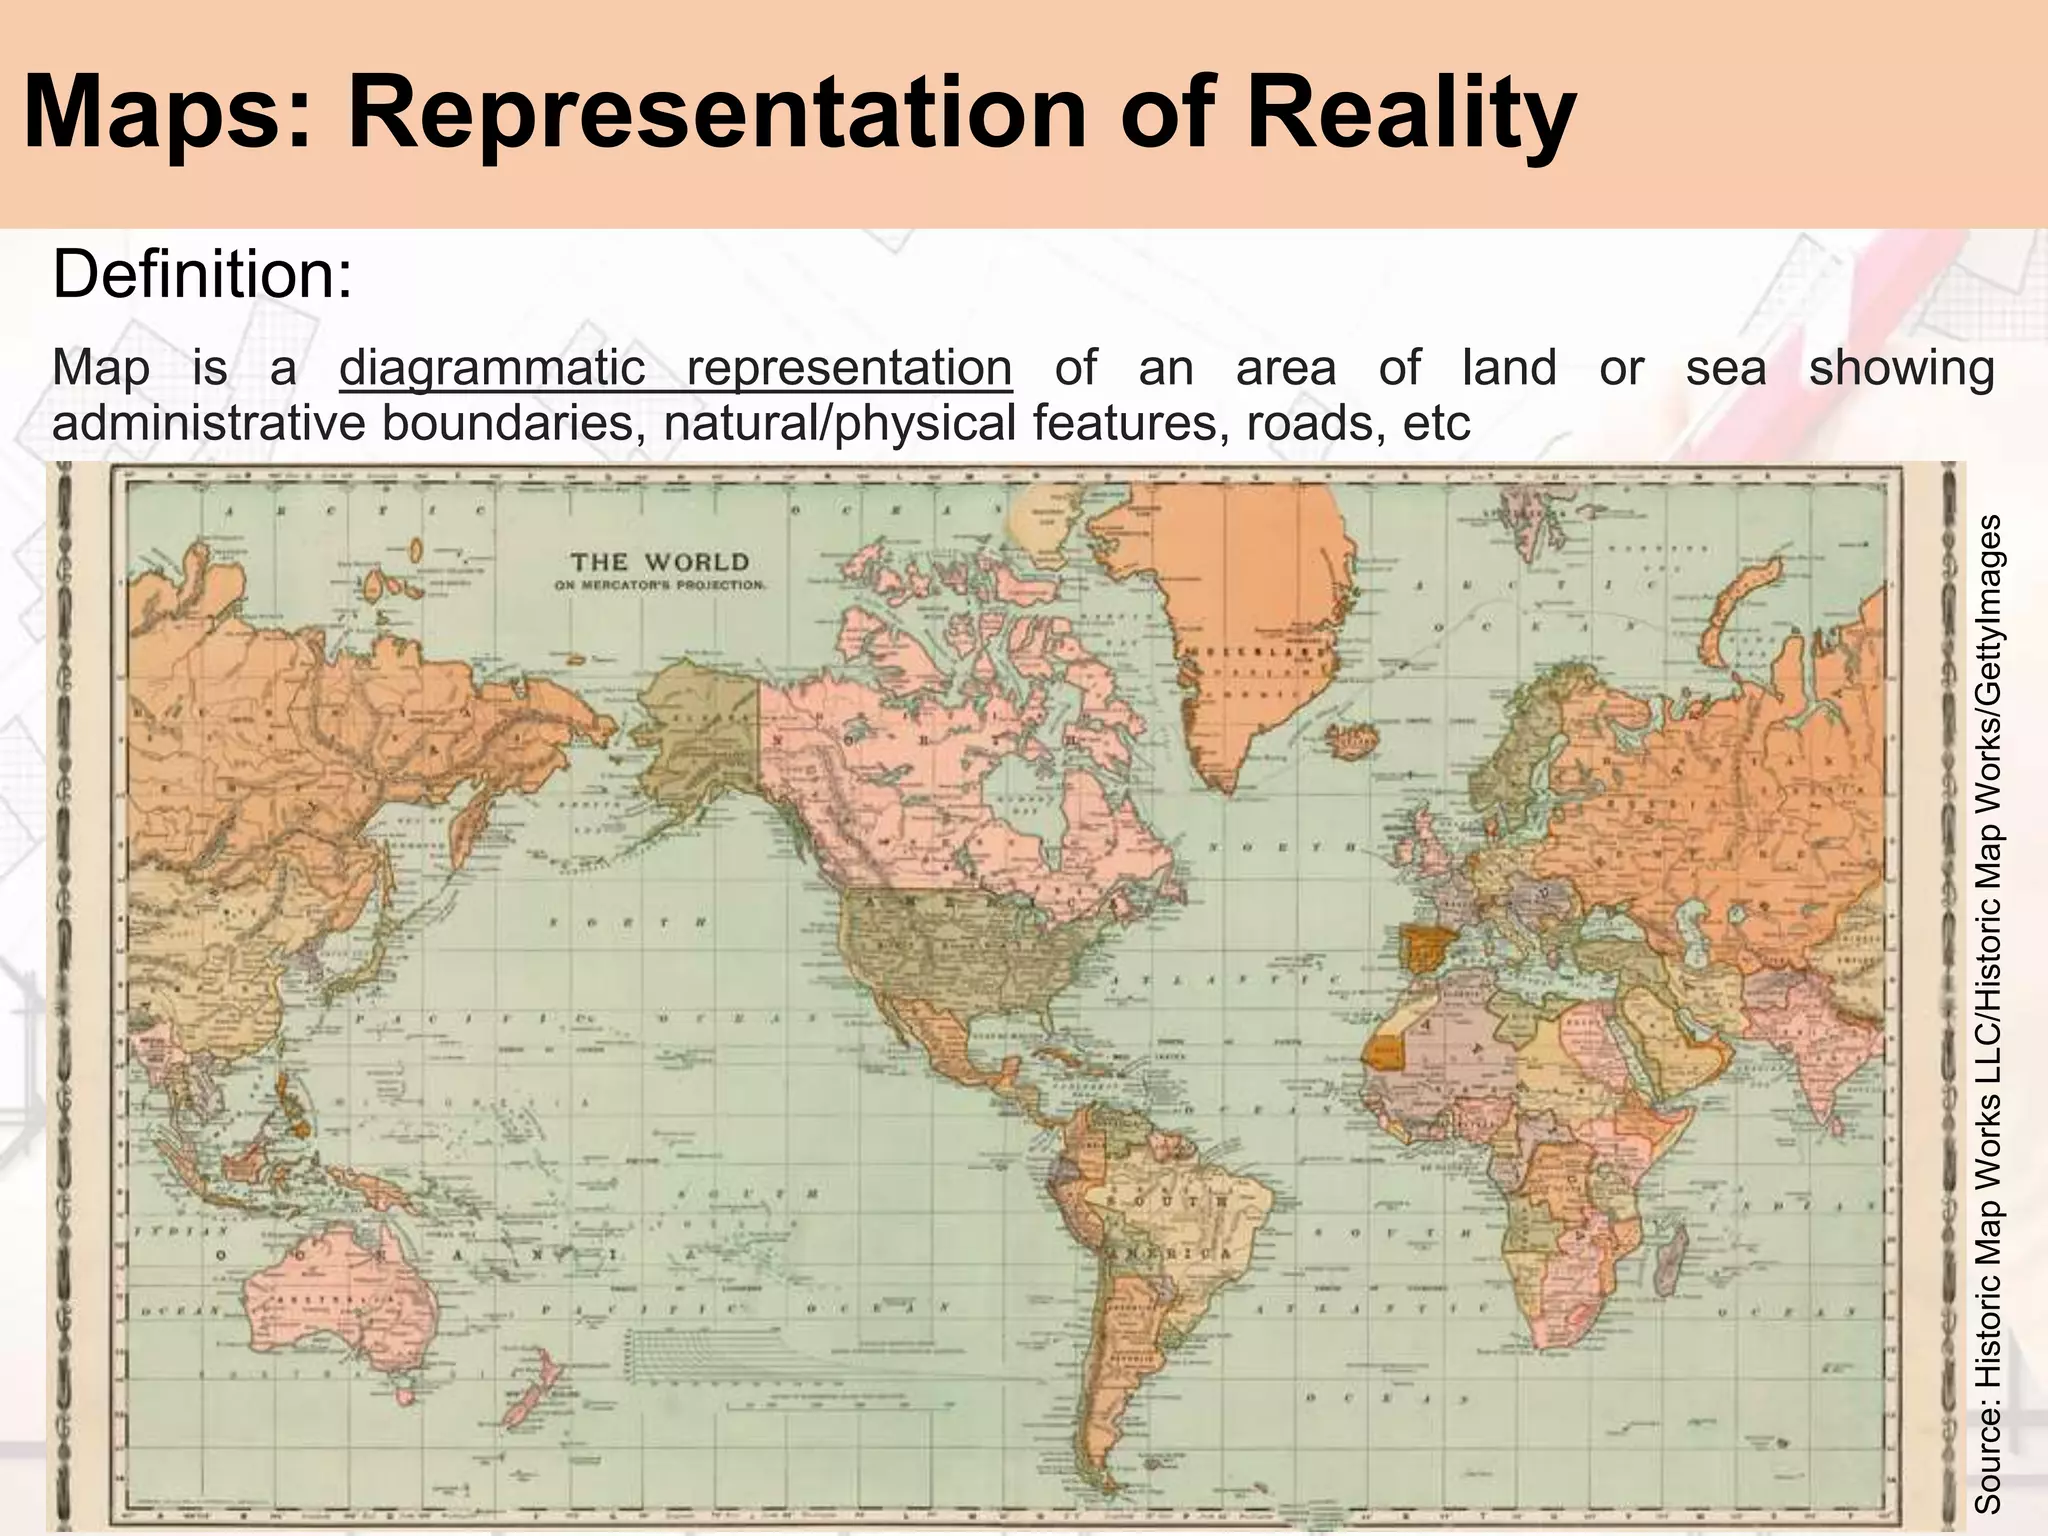
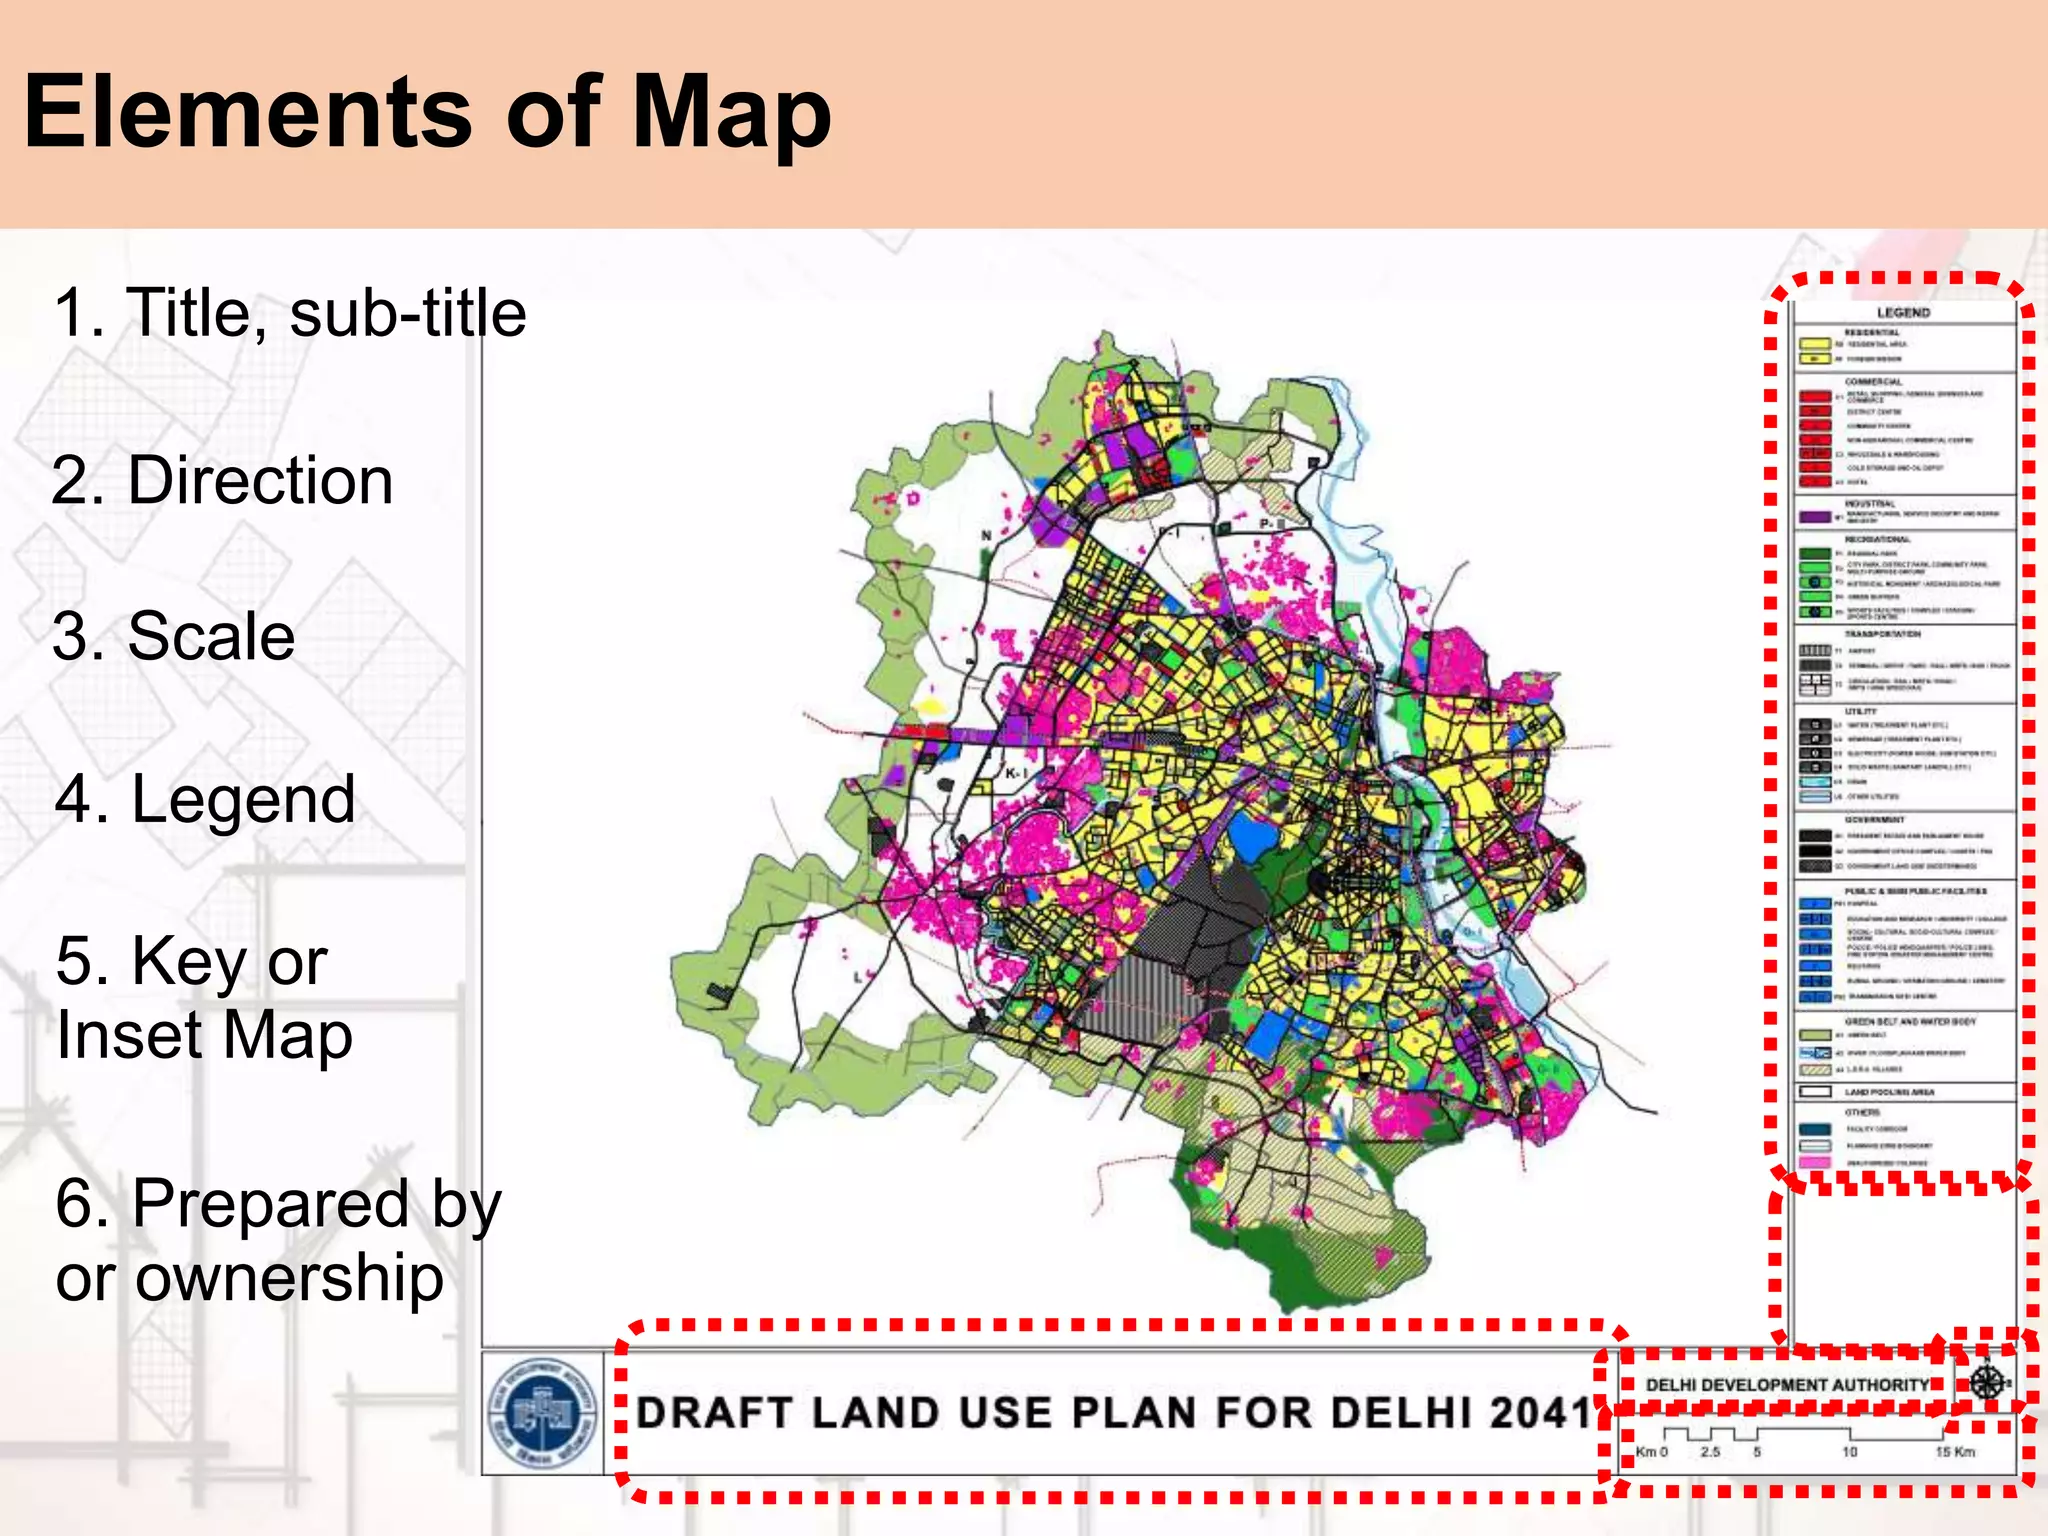
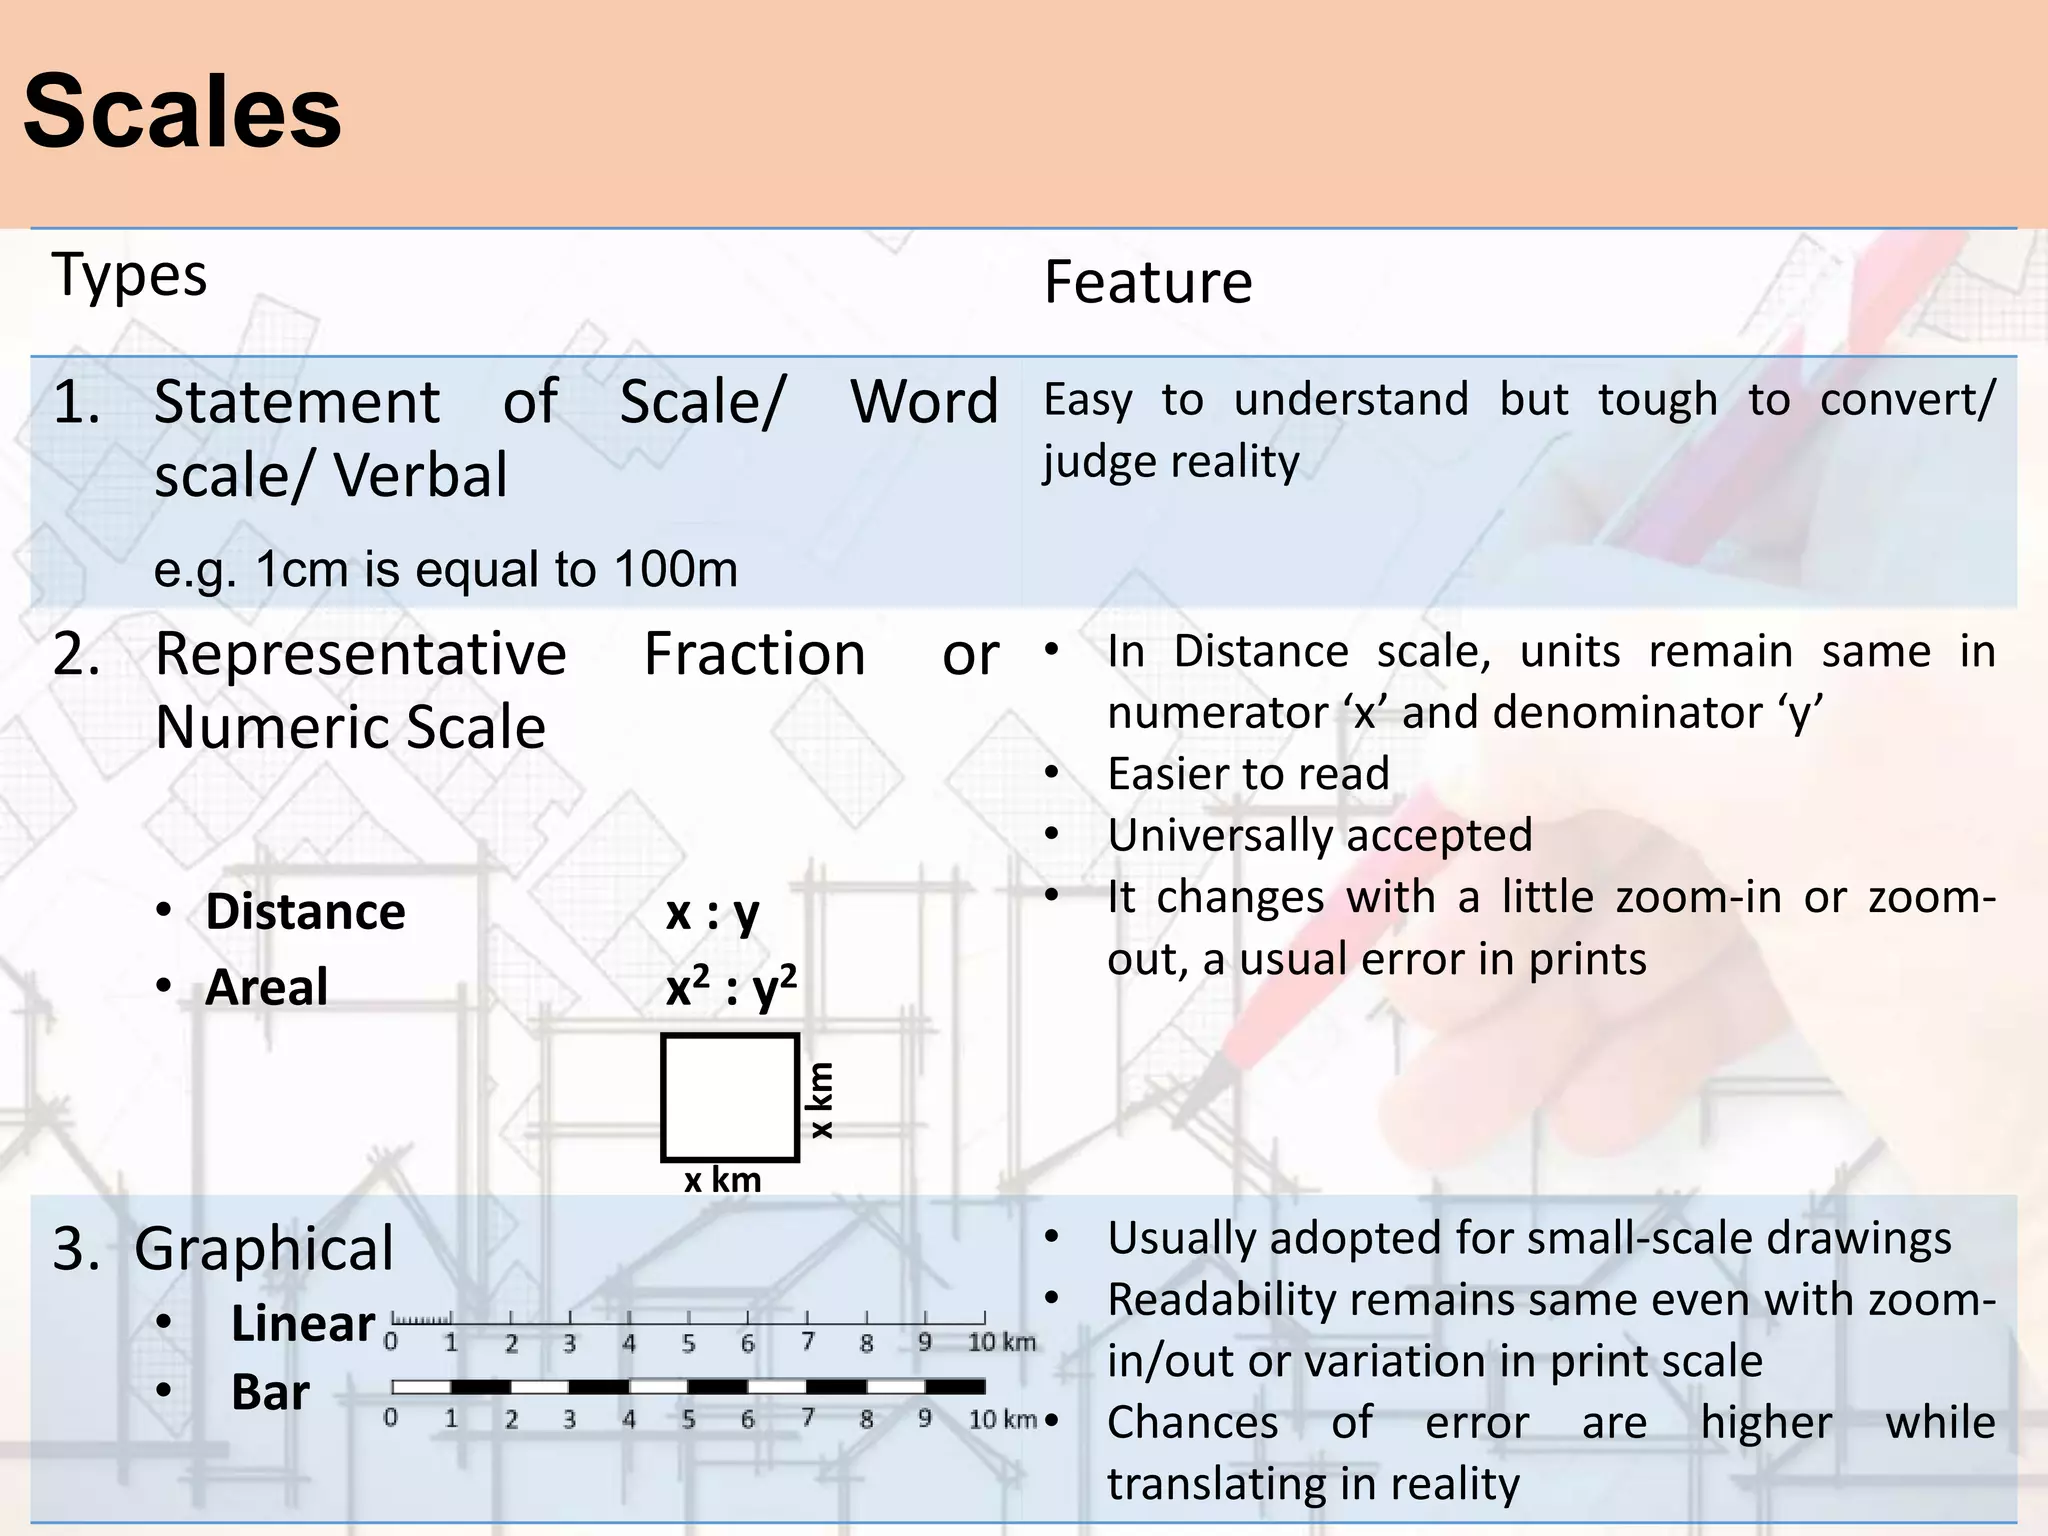
Definition of map: diagrammatic representation of reality on a paper.
elements of a map: scale, direction, title, subtitle, ownership, key map, legend
contents of base map: boundaries
network, topography, landuse, contours, utilities
appropriate scales for various types of plan like regional plan, perspective plan, development plan, local area plan
measurement of sclaes: scale conversion from larger unit to smaller units and vice-versa
Landuse classification, Landuse Landcover (LULC) classification
Architecture and Town Planning _Unit 6_SPPU_Spacial Township, SEZ, CRZ, Smart...Shrikant Kate
Savitribai Phule Pune University
Board of Studies in Civil Engineering
B. E. Civil 2015 COURSE (w. e. f. June 2018)
401004 Elective I (4)- Architecture and Town Planning
Architecture and town planning _Unit 3_SPPU_Spacial Township, SEZ, CRZ, Smart City, AMRUT, GIS, GPS and RS in Planning by S. R. Kate
Unit VI:
• Special townships, SEZ, CRZ, Smart City, AMRUT Guidelines
• Application of GIS, GPS, remote sensing in planning.
A master plan or a development plan or a town plan may be
defined as a
general plan for the future layout of a city showing both the existing and
proposed streets or roads, open spaces, public buildings etc. A master
plan is prepared either for improvement of an old city or for a new
town to be developed on a virgin soil. A master plan is a blueprint for the
future. It is an comprehensive document, long-range in its view, that
is intended to guide development in the
township for the next 10 to 20 years.
Growth pattern of towns Natural and Planned,
Types of zoning and importance,
various road networks(Grid iron pattern, shoe string development,
Surveys for data collection, physical survey, social survey, economic survey, civic survey,
Town aesthetics, landscape architecture,
Rehabilitation of slum and urban renewal,
An urban area is characterized by higher population density and vast human features in comparison to areas surrounding it. Urban areas may be cities, towns or conurbations, but the term is not commonly extended to rural settlements such as villages. Any portion of earth’s surface where physical conditions are homogeneous can be considered as a Region in geographic sense, ranging from a single feature region to compage, depending on the
criteria used for delineation. In practice, a prefix is added to highlight the attributes on which the region has been defined, for example, agriculture region, resource region, city region, planning region.
All the daily activities of human beings are carried out on land. Proper organization of these activities i.e. planning will help the human being in leading a richer and fuller life in livable surroundings or environment. "Planning" means the scientific, aesthetic, and orderly disposition of land, resources, facilities and services with a view to securing the physical, economic and social efficiency, health and well-being of urban and rural communities.
identification of ground water potential zones using gis and remote sensingtp jayamohan
the identification of ground water potential zones using gis and remote sensing.The study is conducted in the Muvattupuzha block.The various parameters used are geology,geomorphology,rainfall,soil type,etc.
Abstract Remote sensing has its application in various fields like geology and mineral exploration, geomorphology and modern geomorphic process modeling, nature mitigation studies, hazard zone mapping, eco system study in hills, plains, riverine, coastal, marine and volcanic landforms, forest and biomass inventory, fishery. Remote sensing plays a vital in various fields. This technique along with the GIS has been to study the geomorphological, hydro geological, land use/land cover, lithological, structural aspects/ features in the parts of Anaimalai, Pollachi and Udumalpet block of TamilNadu. Integrated approach using geographic information system provides cost effective support in resources inventory including land use mapping, comprehensive data base for resources, analytical tools for decision making and impact analysis for plan evaluation. GIS accept large volumes of spatial data derived from a variety of sources and effectively store, retrieve, manipulate, analyze and display all forms of geographically referenced information. Maps and statistical data can be obtained from the spatial integration and analysis of an area using GIS software. In order to assess the natural resource availability and its potentiality in parts of Anaimalai, Pollachi and Udumalpet block, Tamil Nadu, an integrated remote sensing and GIS based study has been conducted by adopting the standard procedures. The groundwater potential zone of any area is depends on geological formations; geomorphologic unit’s recharges characters, topography, and thickness of weathered and fractured zones. In the present study, area was taken to locate groundwater potential zones by integrated different thematic maps, remote sensing and geographic information system techniques. To find out the ground water potential zones, different thematic maps have been prepared and integrated each of them. They are mainly geology, geomorphology, land use / land cover, lineament etc. Groundwater potential zones have been prepared with help of integrating different thematic maps. This study area is finally to get the groundwater potential zones we have to classified few area such as high, moderate and low potential zones. Index Terms: Remote sensing, GIS, lithology, Geomorphology, Hydrology, landforms etc.
IJRET : International Journal of Research in Engineering and Technology is an international peer reviewed, online journal published by eSAT Publishing House for the enhancement of research in various disciplines of Engineering and Technology. The aim and scope of the journal is to provide an academic medium and an important reference for the advancement and dissemination of research results that support high-level learning, teaching and research in the fields of Engineering and Technology. We bring together Scientists, Academician, Field Engineers, Scholars and Students of related fields of Engineering and Technology.
Building Land Use/Land Cover maps from OpenStreetMapMarco Minghini
These slides were presented at the conference "Mapping, Sensing, and Crowdsourcing Geographic Information", organized as the final joint meeting of the two EU COST Actions TD1202 "Mapping and the Citizen Sensors" (http://www.citizensensor-cost.eu) and IC1203 "ENERGIC" (http://vgibox.eu). This work explains the creation of an automated procedure to convert OpenStreetMap (OSM) data into Land Use/Land Cover (LULC) maps, using the nomenclatures of the two most popular European LULC maps, i.e. Urban Atlas and Corine Land Cover. The procedure is implemented using open source software.
Topics:
1. Mapping Concepts
2. Analysis with paper based Maps
3. Limitations of Paper based Maps
4. Computer Aided Cartography History and Development
5. GIS Definition
6. Advantage of Digital Maps
To plan a city/region, we require base data on which information extrapolation & decisions may happen. Hence, Identify ‘data needed’, and Identify ‘needs of data’ collection
Inspection survey:
A) Direct :
Observe traffic count/ situation
Observe housing quality
Observe economic activity
Observe social parameters, etc.
B) Indirect:
Clubbing of directly observed ‘indicators’ to generate area’s possible ‘proxy’.
For e.g. housing condition + plot sizes + no. & types of vehicles + consumer goods = income range
. Personal interview/ Dialogue:
A questionnaire is designed beforehand at appropriate scale:
Nominal Scale : Yes or No
Ordinal Scale : Possible options or multiple choice questions
Interval Scale : Range/ intervals like age group or income group
Structured questions are precise and one-way
Semi-structure survey is a two-way information flow. It’s an informal dialogue in which the surveyor might receive new information from respondent/s. however, it depends on;
Behavioural factors of surveyor and respondents
Questions not to be ambiguous or long
Managing conversation and seeking pin-point answers
Judging responses without bias
Recording interview
Avoiding errors
Cross-checking with other respondents
Major land uses to be identified for analysing physical distribution and existing conditions:
Developed
Under-developed
Un-developed
Major uses marked on map are as per the defined regional/city level plans, like;
Urbanizable zone
Industrial zone
Transportation & Communication zone
roads, railways, MRTS, Seaports, Dockyards, Airports, Bus depots/ terminals, freight complexes, transmission and communication
Primary activity zone
Agriculture, poultry, rural settlements, brick kilns, extraction areas
Open area zone
Recreation zone, green buffer zone
Protected/ Eco-sensitive zone
Water bodies, forests, sanctuaries, coastal zone, wetlands, marshy zone
special area zone
Heritage & conservation zone, scenic value, tourism zone, defence area/ zone, border conflict zone
Data regarding demographic characteristics;
Population growth (natural, induced)
Population size (age-wise)
Population density
Population distribution
Gender ratio
Socio-Economic status
Religion
Marital status
Education ratio
School dropouts
Gender-wise enrolment in schools, colleges
Mortality rate (age-wise)
Birth rate
Health rate (in some surveys)
Sample types for doing household/ demographic surveys;
Simple Random sampling
Systematic sampling
Stratified sampling
Cluster sampling
Multistage sampling
There are nine steps involved in the development of a questionnaire:
Decide the information required.
Define the target respondents.
Choose the method(s) of reaching your target respondents.
Decide on question content.
Develop simple & clear wording of questions
Put the questions into a meaningful order and format.
Check the length of the questionnaire.
Pre-test the questionnaire
Develop the final survey form.
Data Compilation and Tabulation
• Data coding is preferred before going on site for survey. This enables uniformity of data collection among all surveyors and helps in speedy data compilation.
• Survey data is then compiled/ tabulated under various required study parameters/ categories like income category, age groups, hourly water supply, O/D survey, traffic volume, etc.
• These tables are then ready for further graphical representation and analysis.
Graphical presentation of data: pie chart, line chart, bar chart, pyramid graphs, histograms, Lorenz curve, scalogram, sociogram
Data analysis- Quantitative and Qualitative
Land suitability Analysis
Population- Economic Analysis
• Relationship between human capital and city’s economy
• Relationship between humans and resource consumption
Population pattern and its analysis
Density : Density is an objective and quantitative measure referring to a spatial fact that is typically calculated from the ratio of persons or housing units per surface unit.
Residential and non-residential population
“At the end of the day if you have a city that is livable, sustainable, resilient, and competitive, but which is not inclusive, then something is fundamentally wrong in that city”, Sameh Wahba, World Bank.
Inclusive planning is a process of development that includes wide variety of people and activities. It includes various dimensions of urban and rural poverty such as income and social poverty, environmental poverty, health poverty and education poverty.
Equity means “The quality of being fair and impartial”
Question)
Why social inclusion is relevant for cities & citizens?
Answer)
1. Improves livability and cohesion: Inclusive cities eliminate spatial fragmentation, embrace mix-development, respect differences, and create the right environment supported by infrastructure for everyone to thrive. For example, to make the London public transport network convenient and more accessible, the Royal London Society for Blind People created a Wayfindr to enable visually-impaired people to move independently through their various environments
2. Enhances economic competitiveness and productivity of cities: well-integrated and frequent interaction between stakeholders results in enhanced productivity and economic growth for all communities.
3. Improves resilience: By creating a connected and inclusive physical and digital infrastructure, cities can give their residents access to an improved range of shared services, achieving joint economies of scale and accelerating prosperity. Inclusive cities also provide opportunities to expand knowledge sharing, promoting collaboration across the entire population, which in turn builds a more resilient society.
This presentation is about Urban Development Policy and related programmes/ missions running in India.
'Public policy provides signals and sets the regulatory and institutional framework that influence the actions of all actors including private investors and consumers.', UN Conference on Climate Change 2021.
This presentation brief about National Urban Policy Framework, 2018 and the talks about various policies running for various sectors int the year 2022, like the Economic sector, Housing sector, Transport sector, Infrastructure, Industry, Informal sector, Tourism, Environment and Climate Change.
Region: A territorial area of similar characteristics, which is bigger than local area and smaller than the country / nation,
Regions in India, city region & linkages like economic, functional and transportation,
Rural-Urban Linkage,
Rural-Urban Fringe,
Urban periphery settlements: Urban Village and Unauthorised colony/ illegal-land sub-division,
Land Ceiling Repeal Act 1999
According to UN Habitat in 2015, Cities use 2% of the earth's land
Cities consume about 78% of global energy
Produce > 60% of carbon emissions
Produce > 70% of global waste
Consume > 75% of the world’s natural resources.
Climate change includes both global warming driven by human-induced emissions of greenhouse gases and the resulting large-scale shifts in weather patterns.
this presentation is about city's sustainability- environment and economic. It talks of United Nations' Sustainable Development Goals. It defines the concept of Economic sustainability and environment sustainability in a city.
This presentation is about URBAN GROWTH AND SYSTEMS OF CITIES:
City is for all!
City perspective differs for different class of people!
Every city has its own dynamics!
City growth is planned, yet its uncertain!
Limited resources are usually seen as unlimited!
Unplanned growth trends give reality checks!
Planned and unplanned sectors intertwin in cities!
It includes the identification and classification of urban settlements, itheir complexity, and their role in a country & its GDP
Lack of Cultural Significance in Social Housing for Shiites in IndiaIram Aziz
Shiite Muslims, world over, is the second largest sect of Muslims which have different traditions than Sunni Muslims and so do their housing needs. In democratic country like India, Muslims are usually found settled in homogeneous groups, largely viewed as religious ghettos. This paper highlights the issues behind the formation of these ghettos where such settlements come up not due to the economic disparity, as a usual case, but it’s often the result of lack in provision for cultural or institutional needs. Through the case example of Lucknow city- a place of majority of Shiite habitation, this paper will discuss the needs of Shiite Muslims into the neighbourhood planning, so that they are no more being marginalised into the city planning/ urban design.
This paper focuses on the traditional Indian Shiite housing in the light of policy parameters of the Islamic housing, cultural parameters of the sect, and the transformation over time due to urbanisation. For analysing the sect’s urban habitation, this paper discusses about community’s requirements acting as determinant for shaping their neighbourhoods and dwelling units, making their housing different from any other social housing.
Based on the studies & observations, an attempt is made to reduce the gap between the information and the practice of neighbourhood design. It contributes towards the social sustainability by securing concept of ‘housing for all’ incorporating the community needs, and also secures from undue pressure on ecological resources by channelizing the required housing type
Brief deliberation on the concept of slum and the urban poor! This presentation talks of the slum condition and not particular the type of settlement like squatter or urban village or old city etc.
Synthetic Fiber Construction in lab .pptxPavel ( NSTU)
Synthetic fiber production is a fascinating and complex field that blends chemistry, engineering, and environmental science. By understanding these aspects, students can gain a comprehensive view of synthetic fiber production, its impact on society and the environment, and the potential for future innovations. Synthetic fibers play a crucial role in modern society, impacting various aspects of daily life, industry, and the environment. ynthetic fibers are integral to modern life, offering a range of benefits from cost-effectiveness and versatility to innovative applications and performance characteristics. While they pose environmental challenges, ongoing research and development aim to create more sustainable and eco-friendly alternatives. Understanding the importance of synthetic fibers helps in appreciating their role in the economy, industry, and daily life, while also emphasizing the need for sustainable practices and innovation.
The French Revolution, which began in 1789, was a period of radical social and political upheaval in France. It marked the decline of absolute monarchies, the rise of secular and democratic republics, and the eventual rise of Napoleon Bonaparte. This revolutionary period is crucial in understanding the transition from feudalism to modernity in Europe.
For more information, visit-www.vavaclasses.com
The Indian economy is classified into different sectors to simplify the analysis and understanding of economic activities. For Class 10, it's essential to grasp the sectors of the Indian economy, understand their characteristics, and recognize their importance. This guide will provide detailed notes on the Sectors of the Indian Economy Class 10, using specific long-tail keywords to enhance comprehension.
For more information, visit-www.vavaclasses.com
We all have good and bad thoughts from time to time and situation to situation. We are bombarded daily with spiraling thoughts(both negative and positive) creating all-consuming feel , making us difficult to manage with associated suffering. Good thoughts are like our Mob Signal (Positive thought) amidst noise(negative thought) in the atmosphere. Negative thoughts like noise outweigh positive thoughts. These thoughts often create unwanted confusion, trouble, stress and frustration in our mind as well as chaos in our physical world. Negative thoughts are also known as “distorted thinking”.
How to Split Bills in the Odoo 17 POS ModuleCeline George
Bills have a main role in point of sale procedure. It will help to track sales, handling payments and giving receipts to customers. Bill splitting also has an important role in POS. For example, If some friends come together for dinner and if they want to divide the bill then it is possible by POS bill splitting. This slide will show how to split bills in odoo 17 POS.
This is a presentation by Dada Robert in a Your Skill Boost masterclass organised by the Excellence Foundation for South Sudan (EFSS) on Saturday, the 25th and Sunday, the 26th of May 2024.
He discussed the concept of quality improvement, emphasizing its applicability to various aspects of life, including personal, project, and program improvements. He defined quality as doing the right thing at the right time in the right way to achieve the best possible results and discussed the concept of the "gap" between what we know and what we do, and how this gap represents the areas we need to improve. He explained the scientific approach to quality improvement, which involves systematic performance analysis, testing and learning, and implementing change ideas. He also highlighted the importance of client focus and a team approach to quality improvement.
How to Make a Field invisible in Odoo 17Celine George
It is possible to hide or invisible some fields in odoo. Commonly using “invisible” attribute in the field definition to invisible the fields. This slide will show how to make a field invisible in odoo 17.
Read| The latest issue of The Challenger is here! We are thrilled to announce that our school paper has qualified for the NATIONAL SCHOOLS PRESS CONFERENCE (NSPC) 2024. Thank you for your unwavering support and trust. Dive into the stories that made us stand out!
2. Maps: Representation of Reality
Definition:
Map is a diagrammatic representation of an area of land or sea showing
administrative boundaries, natural/physical features, roads, etc
Source:
Historic
Map
Works
LLC/Historic
Map
Works/GettyImages
3. Elements of Map
1. Title, sub-title
2. Direction
3. Scale
5. Key or
Inset Map
6. Prepared by
or ownership
4. Legend
4. Scales
Types Feature
1. Statement of Scale/ Word
scale/ Verbal
e.g. 1cm is equal to 100m
Easy to understand but tough to convert/
judge reality
2. Representative Fraction or
Numeric Scale
• Distance x : y
• Areal x2 : y2
• In Distance scale, units remain same in
numerator ‘x’ and denominator ‘y’
• Easier to read
• Universally accepted
• It changes with a little zoom-in or zoom-
out, a usual error in prints
3. Graphical
• Linear
• Bar
• Usually adopted for small-scale drawings
• Readability remains same even with zoom-
in/out or variation in print scale
• Chances of error are higher while
translating in reality
x
km
x km
7. Contents of base maps
Information depiction depends on:
• Purpose of map
• Scale
• Projection
• Method of map‐making
• Draughting skill
Regional Base Map City Base Map Site Base Map
Boundaries National, State,
District, Taluk, Village
Metropolitan, urban, ULB,
zonal, census, cantonment,
urban/ rural village
All adjacent ownerships
Network NH, SH, district roads,
expressways, Railway
lines, bridges
NH, SH, MDR, arterial, sub-
arterial, collector/ distributer
All access roads/ streets,
pedestrian paths, trails
Topography Forests, hills, rivers &
streams, lakes,
wetlands, etc.
Hills, water bodies, Rivers
and streams, canals, lakes,
swamps, marshy lands
Vegetation (trees, bushes,
hedge), water pond, water
pools
Land-use Urban settlement,
rural settlements,
important
headquarters
Residential, PSP, Govt instt.,
commercial hubs, transport
hubs, major greens, heritage
sites, floodable areas, etc.
All adjacent built-uses, floor-
wise use
Contours 100m interval 3m to 5m interval (usually) 500 mm interval
Utilities Power stations, dams,
etc
HT lines, water & sewer lines,
waste dumping areas, etc.
HT/ LT lines, dustbins, water
& sewer lines,RWH, etc
8. Contents of base maps
1. Land cover
2. Structures
3. Boundaries
4. Hydrography
5. Geographic names
6. Transportation
7. Elevation
8. Orthographic imagery
9. Preparation of GIS base maps
Preparation includes
overlaying of;
1. Arial photo
2. Physiographic
conditions
3. Population size & type
information
4. Ownership boundaries
5. Any other feature of
importance
Source: Guide to Preliminary
Planning Surveys of Urban
Areas Including Land Use
Classification, TCPO, 2004
10. Preparation of Planning base maps using GIS
Preparation includes
overlaying of;
1. Arial photo
2. Physiographic
conditions
3. Population size & type
information
4. Physical & Social
infrastructure
5. Any other feature of
importance
Source:
URDPFI
Guidelines,
Vol
I.,
2015
12. Landuse Land-cover Classification : Regional
Urban landuse classification for plans at scale 1:2,50,000 to 1:50,000 ;
Source: Guide to Preliminary Planning Surveys of Urban Areas Including Land Use Classification, TCPO, 2004
14. Land Use Classification : Urban scale
Urban landuse classification for plans at scale 1:50000 to 1:8000 ;
Source: Guide to Preliminary Planning Surveys of Urban Areas Including Land Use Classification, TCPO, 2004
16. Land Use Map : Master Plan
Delhi Master Plan for 2041
17. Land Use Map : Zonal Development Plan
Landuse plan of Amravati
at Zonal level and Layout
Plan level
Source:
https://www.researchgate.net/fi
gure/A-Land-use-map-of-
Amaravati-Capital-City-
Source_fig3_342062498,
accessed on 16-11-022