


![AutoCAD for Planners
Import XY Coordinates from Excel into AutoCAD
In Excel, highlight and Copy the column of X,Y coordinates to be
used to generate the drawing. Open Windows Notepad. Before
pasting the coordinates, type LINE as the first word in the file (this
will launch the Line command when the script is run), then press
[Enter].
Convert Spline to Polyline
Click Home tab Modify panel Edit Spline. Select the spline to
convert. Enter p to convert to Polyline. Specify a precision value or
press Enter to end the command.
Or Use FLATTEN to quickly convert them
Non-uniform scale
Select the block w/grips, open the properties dialogue box, change
the value of X, Y or Z scale factor as needed.
http://www.frontdesk.co.in/forum](https://image.slidesharecdn.com/planningtechniquesfd-191231073537/85/Planning-techniques-63-320.jpg)


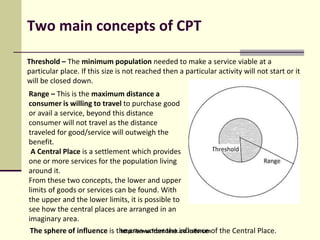
![Delineation techniques
2. Gravitational Analysis Method
Gravitational analysis studies the theoretical forces of attraction between
two centres. The gravitational force between two centres i and j can be
expressed as:
Gij = K [Mi Mj/dij]
Where Gij = Gravitational force between centres i and j.
Mi and Mj = the masses of the centres i and j.
Dij = distance between i and j. K = constant.
• It is concerned with the theoretical forces of attraction between centers
rather than the actual flows.
• This model assumes that the interaction between two centers is directly
proportional to the ‘mass’ of centers and inversely proportional to the
‘distance’ between them.
• ‘Mass’ is represented by variables like population, employment, income,
expenditure and retail turnover.
http://www.frontdesk.co.in/forum](https://image.slidesharecdn.com/planningtechniquesfd-191231073537/85/Planning-techniques-83-320.jpg)


The document outlines essential planning techniques for town surveys, emphasizing the importance of meticulous organization and data analysis to enhance urban planning. It details various types of surveys, including civic, town, regional, and national surveys, and their roles in understanding community needs, economic conditions, and development impacts. Additionally, it discusses methodologies for data collection, land use classification, and the preparation of base maps, highlighting the necessity of accurate mapping for effective urban development planning.