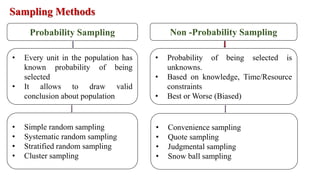
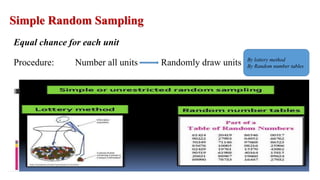
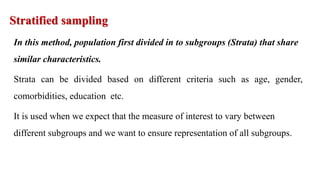
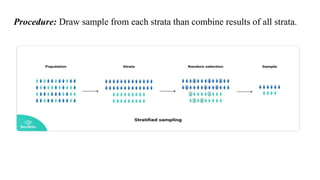
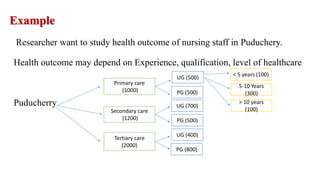
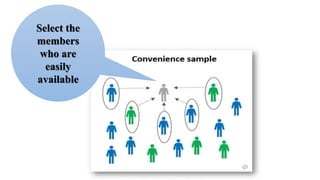
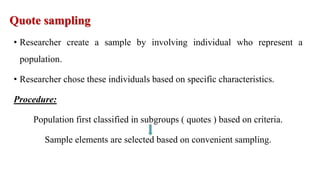
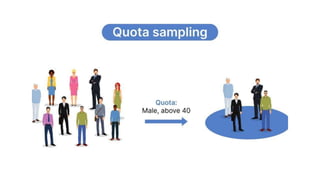
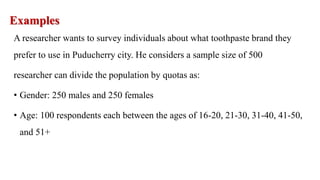
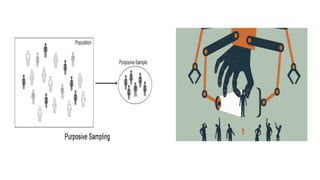
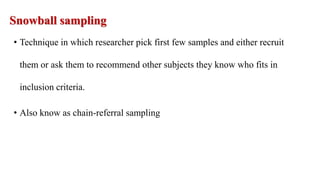
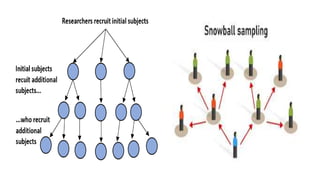
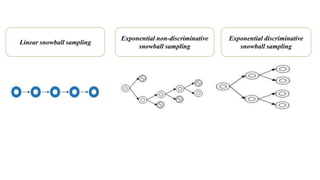
This power point presentation is about different sampling methods used in biomedical research. Each method is explained with example for better understanding.
univariate and bivariate analysis in spss Subodh Khanal
this slide will help to perform various tests in spss targeting univariate and bivariate analysis along with the way of entering and analyzing multiple responses.
In many different types of researches we are interested in learning about large groups of people who all have something in common that is called 'target population' Researchers commonly study traits or characteristics (parameters) of populations in their studies. It is more or less impossible to study the whole population therefore researches need to select a sample or sub-group of the population that is likely to be representative of the target population. Therefore, the researcher would select individuals from which to collect the data which is called sample. Sampling is the method of selecting individuals from the population. The method of sampling is a key factor for generalizing the results of sample into a population. There are two main methods of sampling including probable and non-probable sampling techniques. In probable sampling method the sample, should be as representative as possible of the population which leads to more confident to generalize the results to the target population.
Another important question that must be answered in all sample surveys is "How many participants should be chosen for a survey"? An under-sized study can be a waste of resources since it may not produce useful results while an over-sized study uses more resources than necessary. Determining the sample size should be based on type of research and its objectives as well as required statistical methods. There are different methods for determining the sample size applying various formulas to calculate a sample size.
A sample design is a definite plan for obtaining a sample from a given population. It refers to the technique or the procedure the researcher would adopt in selecting items for the sample. Sample design may as well lay down the number of items to be included in the sample i.e., the size of the sample. Sample design is determined before data are collected. There are many sample designs from which a researcher can choose. Some designs are relatively more precise and easier to apply than others. Researcher must select/prepare a sample design which should be reliable and appropriate for his research study.
Population in statistics means the whole of the information which comes under the preview of statistical investigation.
In other words, an aggregate of objects animate or in animate under study is the population.
It is also known as “Universe”.
Adjusting OpenMP PageRank : SHORT REPORT / NOTESSubhajit Sahu
For massive graphs that fit in RAM, but not in GPU memory, it is possible to take
advantage of a shared memory system with multiple CPUs, each with multiple cores, to
accelerate pagerank computation. If the NUMA architecture of the system is properly taken
into account with good vertex partitioning, the speedup can be significant. To take steps in
this direction, experiments are conducted to implement pagerank in OpenMP using two
different approaches, uniform and hybrid. The uniform approach runs all primitives required
for pagerank in OpenMP mode (with multiple threads). On the other hand, the hybrid
approach runs certain primitives in sequential mode (i.e., sumAt, multiply).
The Building Blocks of QuestDB, a Time Series Databasejavier ramirez
Talk Delivered at Valencia Codes Meetup 2024-06.
Traditionally, databases have treated timestamps just as another data type. However, when performing real-time analytics, timestamps should be first class citizens and we need rich time semantics to get the most out of our data. We also need to deal with ever growing datasets while keeping performant, which is as fun as it sounds.
It is no wonder time-series databases are now more popular than ever before. Join me in this session to learn about the internal architecture and building blocks of QuestDB, an open source time-series database designed for speed. We will also review a history of some of the changes we have gone over the past two years to deal with late and unordered data, non-blocking writes, read-replicas, or faster batch ingestion.
Levelwise PageRank with Loop-Based Dead End Handling Strategy : SHORT REPORT ...Subhajit Sahu
Abstract — Levelwise PageRank is an alternative method of PageRank computation which decomposes the input graph into a directed acyclic block-graph of strongly connected components, and processes them in topological order, one level at a time. This enables calculation for ranks in a distributed fashion without per-iteration communication, unlike the standard method where all vertices are processed in each iteration. It however comes with a precondition of the absence of dead ends in the input graph. Here, the native non-distributed performance of Levelwise PageRank was compared against Monolithic PageRank on a CPU as well as a GPU. To ensure a fair comparison, Monolithic PageRank was also performed on a graph where vertices were split by components. Results indicate that Levelwise PageRank is about as fast as Monolithic PageRank on the CPU, but quite a bit slower on the GPU. Slowdown on the GPU is likely caused by a large submission of small workloads, and expected to be non-issue when the computation is performed on massive graphs.
06-04-2024 - NYC Tech Week - Discussion on Vector Databases, Unstructured Data and AI
Round table discussion of vector databases, unstructured data, ai, big data, real-time, robots and Milvus.
A lively discussion with NJ Gen AI Meetup Lead, Prasad and Procure.FYI's Co-Found
Chatty Kathy - UNC Bootcamp Final Project Presentation - Final Version - 5.23...John Andrews
SlideShare Description for "Chatty Kathy - UNC Bootcamp Final Project Presentation"
Title: Chatty Kathy: Enhancing Physical Activity Among Older Adults
Description:
Discover how Chatty Kathy, an innovative project developed at the UNC Bootcamp, aims to tackle the challenge of low physical activity among older adults. Our AI-driven solution uses peer interaction to boost and sustain exercise levels, significantly improving health outcomes. This presentation covers our problem statement, the rationale behind Chatty Kathy, synthetic data and persona creation, model performance metrics, a visual demonstration of the project, and potential future developments. Join us for an insightful Q&A session to explore the potential of this groundbreaking project.
Project Team: Jay Requarth, Jana Avery, John Andrews, Dr. Dick Davis II, Nee Buntoum, Nam Yeongjin & Mat Nicholas
Techniques to optimize the pagerank algorithm usually fall in two categories. One is to try reducing the work per iteration, and the other is to try reducing the number of iterations. These goals are often at odds with one another. Skipping computation on vertices which have already converged has the potential to save iteration time. Skipping in-identical vertices, with the same in-links, helps reduce duplicate computations and thus could help reduce iteration time. Road networks often have chains which can be short-circuited before pagerank computation to improve performance. Final ranks of chain nodes can be easily calculated. This could reduce both the iteration time, and the number of iterations. If a graph has no dangling nodes, pagerank of each strongly connected component can be computed in topological order. This could help reduce the iteration time, no. of iterations, and also enable multi-iteration concurrency in pagerank computation. The combination of all of the above methods is the STICD algorithm. [sticd] For dynamic graphs, unchanged components whose ranks are unaffected can be skipped altogether.
Algorithmic optimizations for Dynamic Levelwise PageRank (from STICD) : SHORT...
Sampling methods
1. Sampling Methods
By
Dr. Dinesh kumar Meena, Pharm.D
Ph.D Research Scholar
Department of Medical Pharmacology,
Jawaharlal Institute of Postgraduate Medical Education & Research (JIPMER), India
2. Study population:
• To which the results of the study will be inferred
• Study population depends upon research questions.
Sampling:
• A procedure by which some members of the population are selected as
representative of the population.
Sample unit :
• Elementary unit that will be sampled ex. People, Healthcare workers, Hospital
3. Sample frame:
• List of all sample units.
Population Population
Inference
Diagrammatic presentation of sampling
4. Why
Sampling
To bring the population into
manageable numbers
To reduce the time
To reduce the cost
To help in minimizing error from the
despondence due to large number in the
population
6. Sampling Methods
Probability Sampling Non -Probability Sampling
• Every unit in the population has
known probability of being
selected
• It allows to draw valid
conclusion about population
• Probability of being selected is
unknowns.
• Based on knowledge, Time/Resource
constraints
• Best or Worse (Biased)
• Simple random sampling
• Systematic random sampling
• Stratified random sampling
• Cluster sampling
• Convenience sampling
• Quote sampling
• Judgmental sampling
• Snow ball sampling
8. Simple Random Sampling
Equal chance for each unit
Procedure: Number all units Randomly draw units By lottery method
By Random number tables
9. Example
A researcher want to conduct a survey to check knowledge of primary care
prescribers of Puducherry UT regarding antimicrobial stewardship
programme of India.
Total population ( no. of primary care prescribers): 100
Sample size: 30
Sampling method : Assign one number or code to each prescriber and select
30 by lottery method or random table numbers.
10. Pros Cons
• Strong external validity
• More efficient
• Expensive
• Not always possible
11. Systematic Random sampling
Draw every Kth Unit
Procedure: Sample unit is selected at a regular interval to form the sample
Calculate sampling interval ( K = N/n) Draw every Kth Unit from starting
12. Example
Select the sample size of 10 from population of 30 students ( using
systematic sampling)
K (sample interval) = population / sample size = 30/10 = 3
I should select every 3rd unit
1 2 3 4 5 6 7 8 9 10 11 12 13 14 15 16 17
18 19 20 21 22 23 24 25 26 27 28 29 30
Sample : 3,6,9,12,15,18,21,24,27,30
13. Pros Cons
• Strong external validity
• More efficient
• Not always possible
14. Stratified sampling
In this method, population first divided in to subgroups (Strata) that share
similar characteristics.
Strata can be divided based on different criteria such as age, gender,
comorbidities, education etc.
It is used when we expect that the measure of interest to vary between
different subgroups and we want to ensure representation of all subgroups.
16. Example
Researcher want to study health outcome of nursing staff in Puduchery.
Health outcome may depend on Experience, qualification, level of healthcare
Puducherry
Primary care
(1000)
Secondary care
(1200)
Tertiary care
(2000)
UG (500)
PG (500)
UG (700)
PG (500)
UG (400)
PG (800)
< 5 years (100)
> 10 years
(100)
5-10 Years
(300)
17. Pros Cons
• Strong external validity
• More efficient
• Time consuming
• More tricky
18. Cluster Sampling
Subgroup of population (clusters) are used as sample unit rather than an
individual
The population is divided into subgroups (clusters) which are selected
randomly to be included in the study.
These clusters can be treated as small population which have all the
attributes of population.
Cluster sampling of more efficient for studies which are conducted in wide
geographical region.
19.
20. Example
Government want to conduct survey regarding people’s belief on Covid-19
vaccination in town of 36 blocks/sectors.
Sample size: 9 clusters
Procedure:
Select 9 blocks out of 21 blocks ( randomly/stratified). Survey all the
residents of each block
21. Pros Cons
• Strong external validity • Time consuming
• More tricky
• Not always possible
23. Convenience sampling
• Samples are selected from the population based on researcher’s
convenience.
• Researcher follow convince sampling because the time and cost of
collecting information is reduced.
25. Example
Researcher want to study antibiotic prescribing pattern at primary health
centres. For which he need to select minimum 1 HF from each geographical
location i.e. east, west, south & north. For his convenience, from each
location he selected those HF which were nearby and easy to travel.
27. Quote sampling
• Researcher create a sample by involving individual who represent a
population.
• Researcher chose these individuals based on specific characteristics.
Procedure:
Population first classified in subgroups ( quotes ) based on criteria.
Sample elements are selected based on convenient sampling.
28.
29. Examples
A researcher wants to survey individuals about what toothpaste brand they
prefer to use in Puducherry city. He considers a sample size of 500
researcher can divide the population by quotas as:
• Gender: 250 males and 250 females
• Age: 100 respondents each between the ages of 16-20, 21-30, 31-40, 41-50,
and 51+
31. Judgmental/ Purposive sampling
• Based on researcher’s judgment i.e. who to ask to participate
• Researcher can specifically target individual with certain characteristics.
• Often used to know opinion.
• Many companies try out new product idea on their own employees who are
more favourable to new ideas than general population. if the product
doesn’t pass this group, product may not have success in general market.
34. Snowball sampling
• Technique in which researcher pick first few samples and either recruit
them or ask them to recommend other subjects they know who fits in
inclusion criteria.
• Also know as chain-referral sampling
37. Examples
Rare diseases:
There are many less-researched diseases. There may be a restricted number
of individuals suffering from rare diseases. Using snowball sampling,
researchers can get in touch with these hard to contact sufferers and convince
them to participate in the survey.