Downloaded 218 times


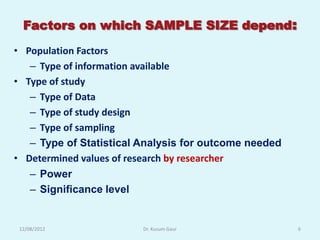

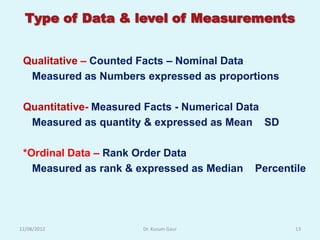

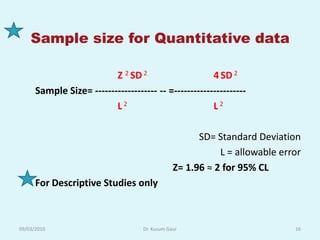
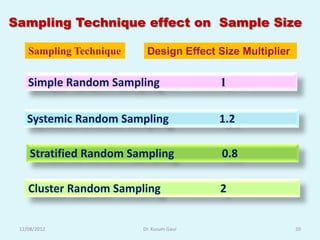
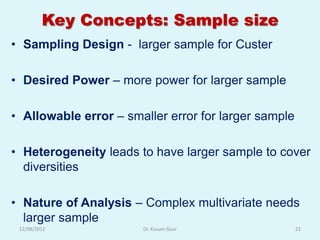
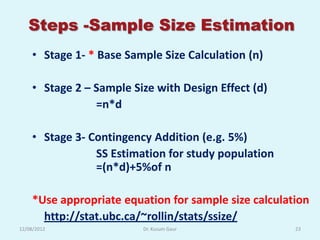
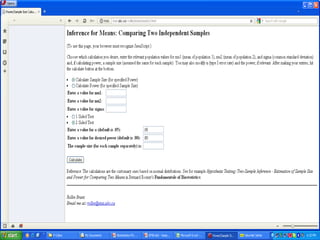
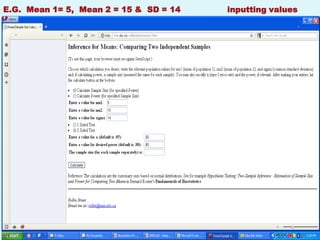
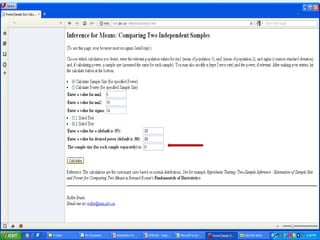
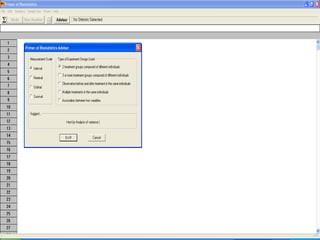


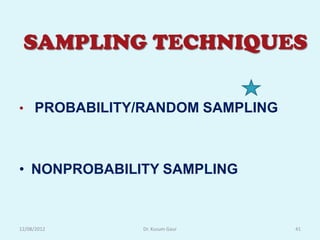

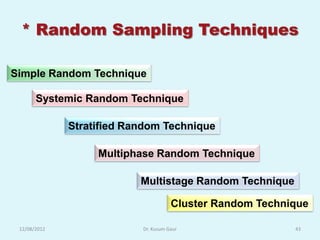

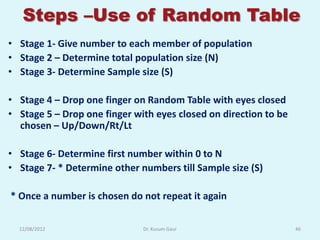
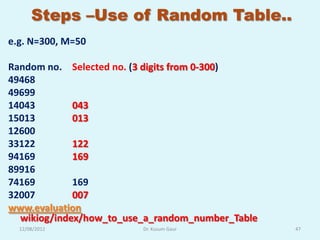
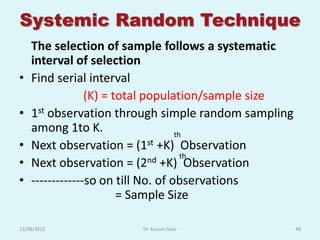
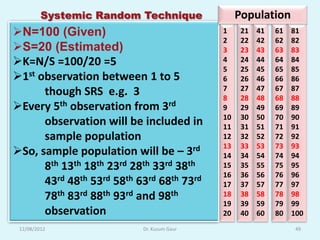
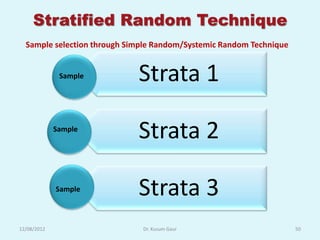
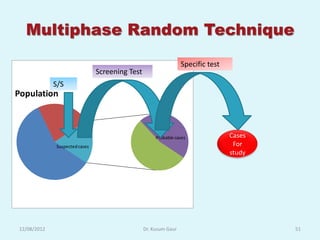
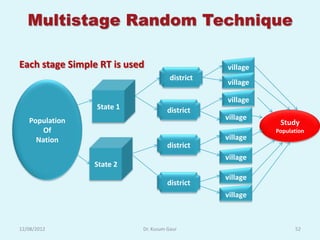
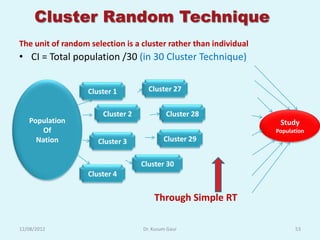
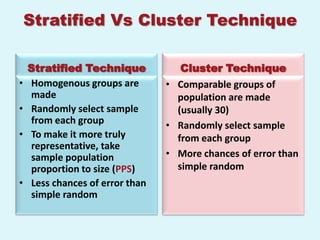
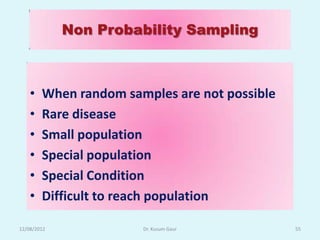
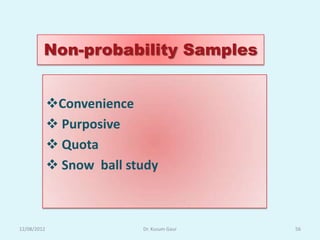
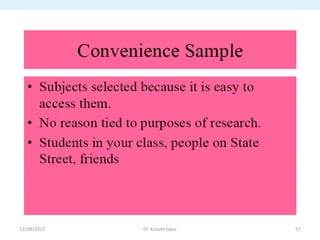


The document discusses sampling in research. It defines a sample as a small representative segment of a population from which inferences can be drawn about the larger population with minimal resources. Factors that influence sample size include population characteristics, study design, and desired statistical power and significance level. Common sampling techniques include simple random sampling, systematic random sampling, stratified random sampling, and cluster random sampling. Sample size calculations depend on the type of data and study design.