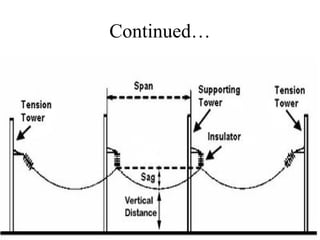
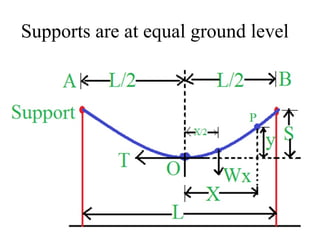
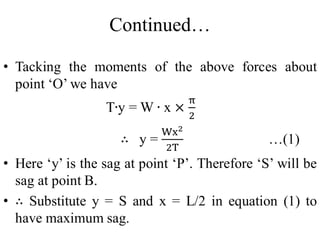
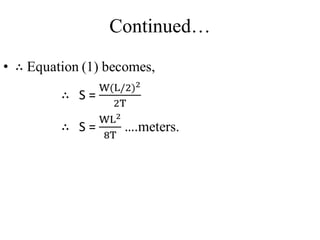
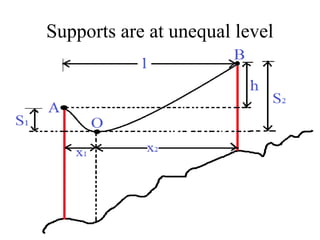
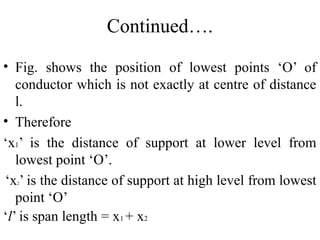
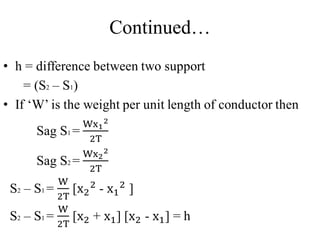
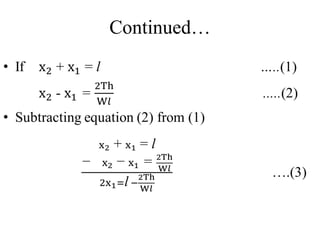
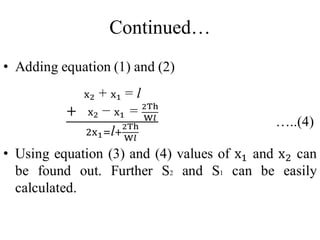
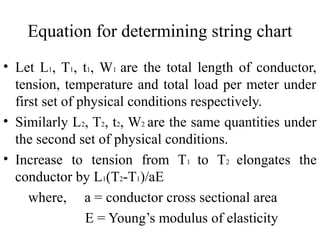
Sag in overhead transmission line, Sag
calculation & string chart
Contents
• Introduction about sag
• Sag calculation
• String chart
Introduction
• The straight distance between the two poles gives
the shortest distance. Therefore to minimise the
length of conductor, one may stretch conductor to
make it straight.
• But we also look after that the conductors are in safe
tension. in order to permit safe tension in the
conductors, they are not fully stretched but are
allowed to have some dip.
• Thus the difference in level points of supports and
lowest point on the conductor is called as Sag.
Continued…
Sag calculation
Continued…
• The tension on the conductor depends on the
following factors:
Weight of the conductor
Wind effects
Ice loading
Temperature variation
Continued…
When the
supports are
at equal
ground level
While calculating the sag there are two
consideration
When the
supports are
at unequal
ground level
Supports are at equal ground level
Continued…
• Refer fig. in which ‘O’ is the lowest point of the
conductor spacing.
• L=length of span in meters
• W=weight of the conductor per unit length
• T=tension on the conductor
• Consider any point ‘P’ on the conductor whose
coordinate are ‘x’ and ‘y’.
• There are two forces acting on the portion ‘OP’
1. Weight of the portion ‘OP’ acting downward at a
distance x/2 from origin ‘O’.
2. Tangential tension T acting at points ‘O’.
Continued…
Continued…
Supports are at unequal level
Continued….
• Fig. shows the position of lowest points ‘O’ of
conductor which is not exactly at centre of distance
l.
• Therefore
‘x1’ is the distance of support at lower level from
lowest point ‘O’.
‘x2’ is the distance of support at high level from lowest
point ‘O’
‘l’ is span length = x1 + x2
Continued…
Continued…
Continued…
String chart
• Stringing chart is useful in knowing the sag and
tension at any temperature. Stringing chart gives the
data per sag to be allowed and the tension to be
allowed for a particular temperature.
• Stringing chart prepared by calculating the sag and
tension on the conductor under worst conditions
such as maximum wind pressure and minimum
temperature by asuming a suitable factor safety.
Equation for determining string chart
• Let L1, T1, t1, W1 are the total length of conductor,
tension, temperature and total load per meter under
first set of physical conditions respectively.
• Similarly L2, T2, t2, W2 are the same quantities under
the second set of physical conditions.
• Increase to tension from T1 to T2 elongates the
conductor by L1(T2-T1)/aE
where, a = conductor cross sectional area
E = Young’s modulus of elasticity
Continued…
Continued…
Graph
• Now the graph of tension
verses temperature and sag
verses temperature can be
plotted as shown in fig.
• This graph is plotted for a
fixed span and is called as
stringing chart.
Sag in overhead transmission line, sag   calculation & string chart

Sag in overhead transmission line, sag calculation & string chart

  • 1.
    Sag in overheadtransmission line, Sag calculation & string chart
  • 2.
    Contents • Introduction aboutsag • Sag calculation • String chart
  • 3.
    Introduction • The straightdistance between the two poles gives the shortest distance. Therefore to minimise the length of conductor, one may stretch conductor to make it straight. • But we also look after that the conductors are in safe tension. in order to permit safe tension in the conductors, they are not fully stretched but are allowed to have some dip. • Thus the difference in level points of supports and lowest point on the conductor is called as Sag.
  • 4.
  • 5.
  • 6.
    Continued… • The tensionon the conductor depends on the following factors: Weight of the conductor Wind effects Ice loading Temperature variation
  • 7.
    Continued… When the supports are atequal ground level While calculating the sag there are two consideration When the supports are at unequal ground level
  • 8.
    Supports are atequal ground level
  • 9.
    Continued… • Refer fig.in which ‘O’ is the lowest point of the conductor spacing. • L=length of span in meters • W=weight of the conductor per unit length • T=tension on the conductor • Consider any point ‘P’ on the conductor whose coordinate are ‘x’ and ‘y’. • There are two forces acting on the portion ‘OP’ 1. Weight of the portion ‘OP’ acting downward at a distance x/2 from origin ‘O’. 2. Tangential tension T acting at points ‘O’.
  • 10.
  • 11.
  • 12.
    Supports are atunequal level
  • 13.
    Continued…. • Fig. showsthe position of lowest points ‘O’ of conductor which is not exactly at centre of distance l. • Therefore ‘x1’ is the distance of support at lower level from lowest point ‘O’. ‘x2’ is the distance of support at high level from lowest point ‘O’ ‘l’ is span length = x1 + x2
  • 14.
  • 15.
  • 16.
  • 17.
    String chart • Stringingchart is useful in knowing the sag and tension at any temperature. Stringing chart gives the data per sag to be allowed and the tension to be allowed for a particular temperature. • Stringing chart prepared by calculating the sag and tension on the conductor under worst conditions such as maximum wind pressure and minimum temperature by asuming a suitable factor safety.
  • 18.
    Equation for determiningstring chart • Let L1, T1, t1, W1 are the total length of conductor, tension, temperature and total load per meter under first set of physical conditions respectively. • Similarly L2, T2, t2, W2 are the same quantities under the second set of physical conditions. • Increase to tension from T1 to T2 elongates the conductor by L1(T2-T1)/aE where, a = conductor cross sectional area E = Young’s modulus of elasticity
  • 19.
  • 20.
  • 21.
    Graph • Now thegraph of tension verses temperature and sag verses temperature can be plotted as shown in fig. • This graph is plotted for a fixed span and is called as stringing chart.