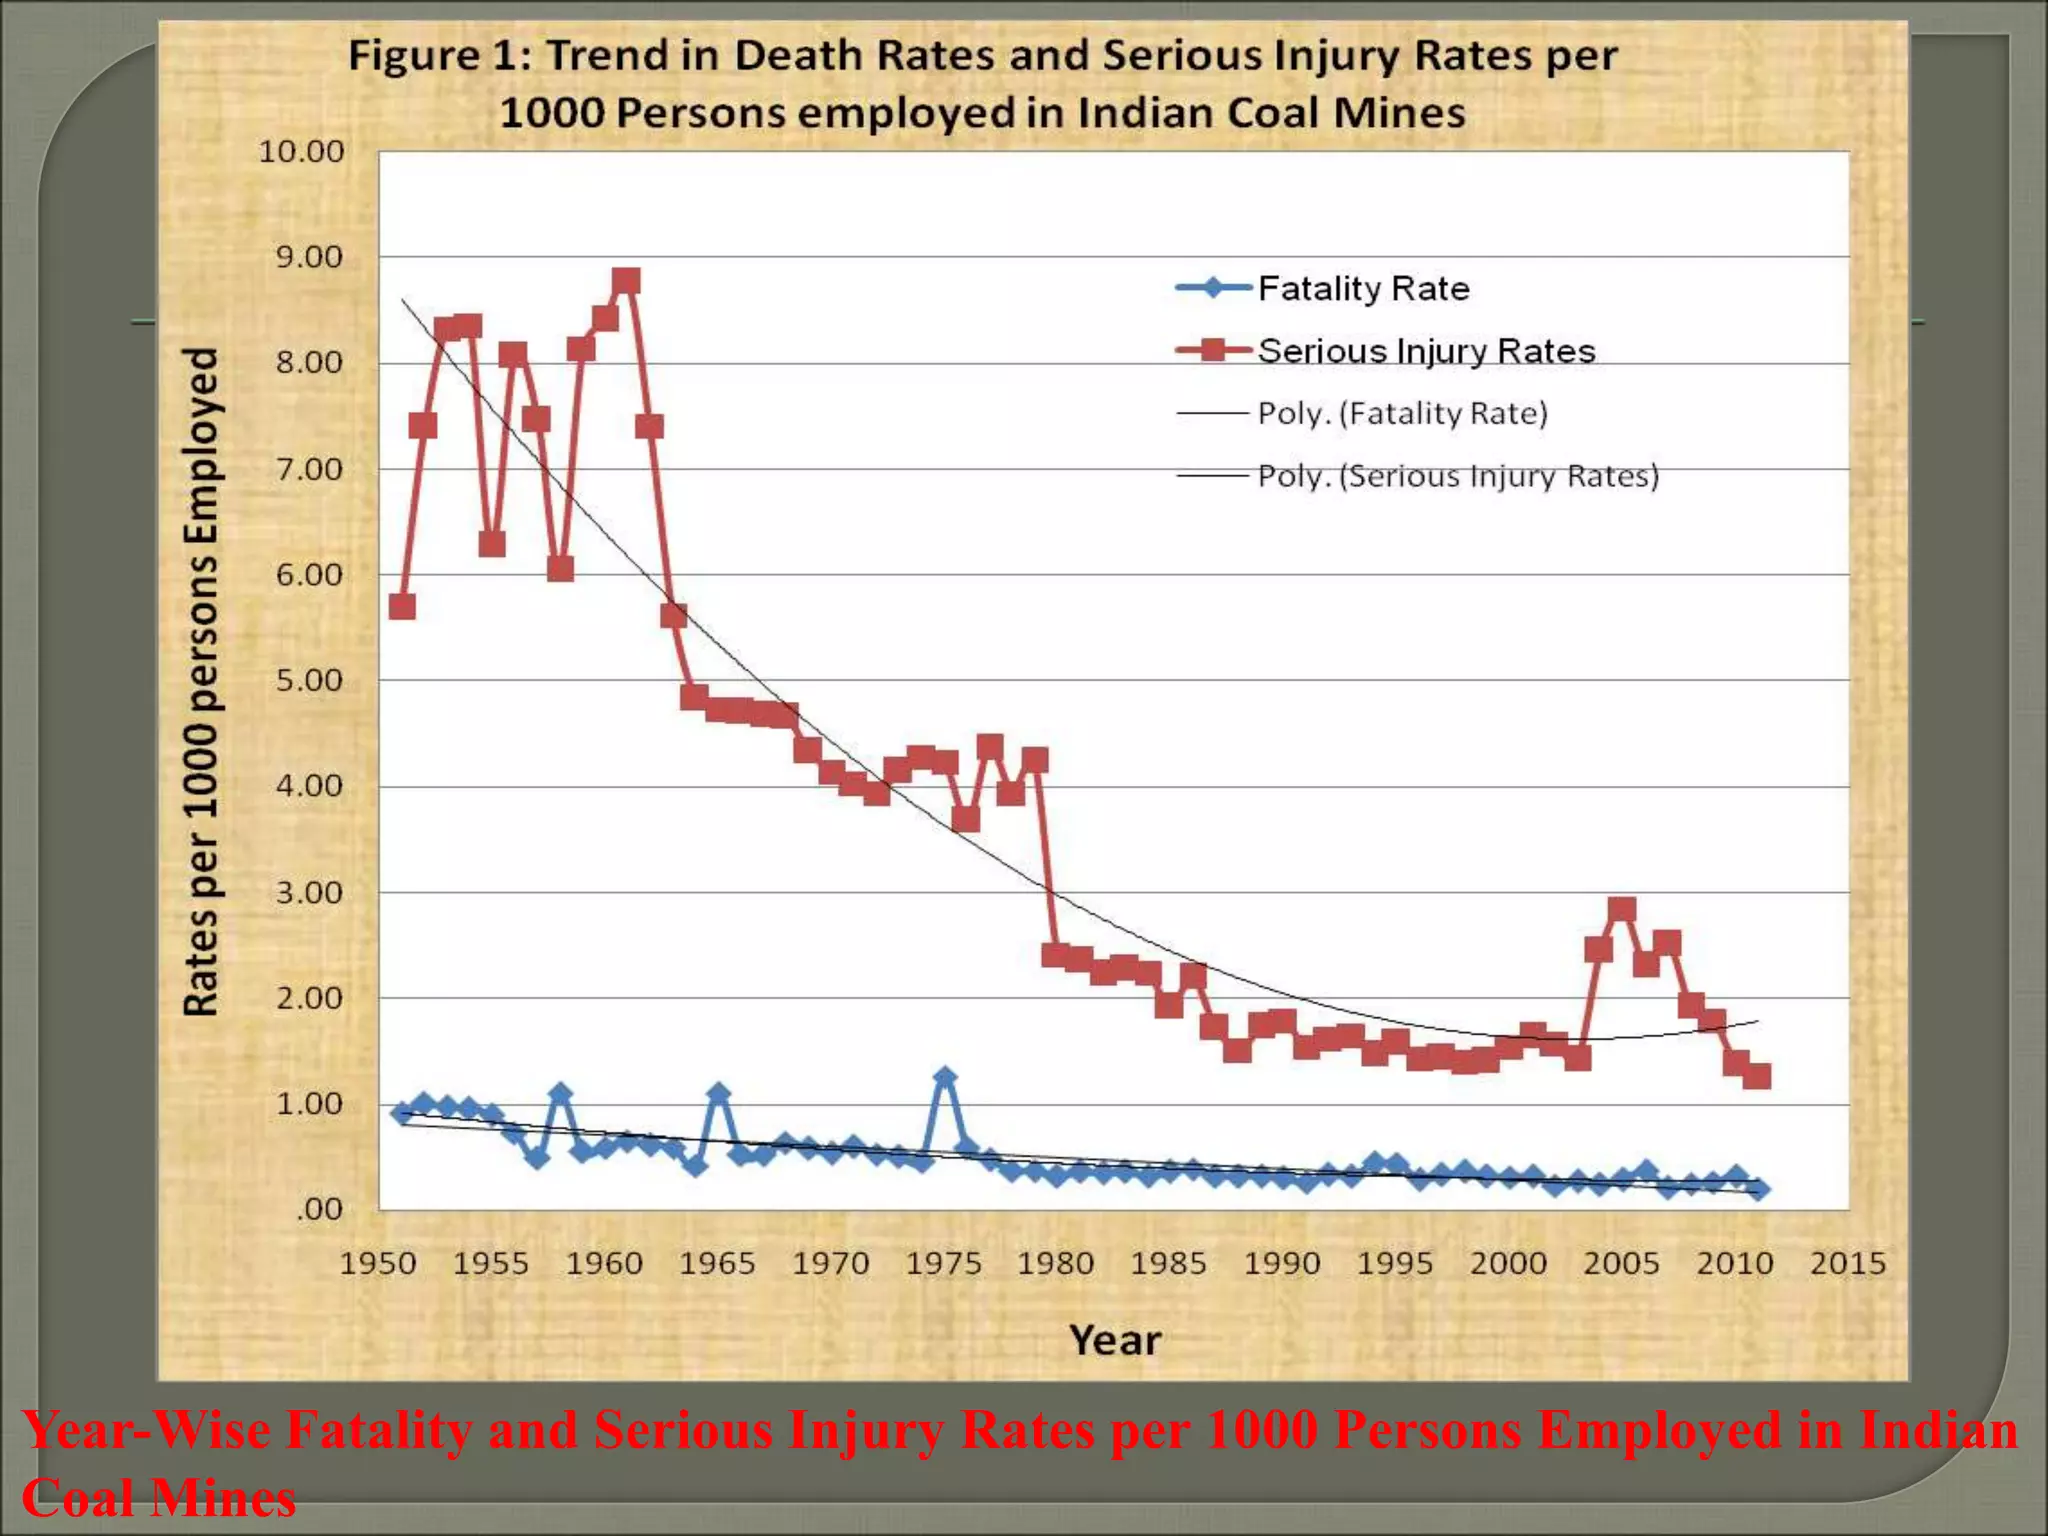
SlideShare a Scribd company logo
1 of 100
 Mining is a hazardous profession associated with high
level of accidents and injuries
 According to the Directorate General of Mine Safety report of
accident statistics, there were 117 & 101 fatalities and 509 & 52
serious injuries in the year of 2010 in coal & metalliferous mines
 On an average, there are 83 & 49 fatal and 729 & 94 serious
accidents in coal & Metalliferous mines, respectively over last Ten
Years (2002-2011).
 The average death rate per 1000 persons employed per year is
around 0.26 & 0.42 and that of serious injury rate is around 1.95 &
0.74 in coal & Metalliferous mines, respectively.
 Several causes starting from personal to
sociotechnical factors are responsible for such high
injury experience rates in mines
Year-Wise Fatality and Serious Injury Rates per 1000 Persons Employed in Indian
Coal Mines
year coal oil coppe
r
Gold Iron
Ore
Lime
Ston
e
Mang
.
ore
Galen
a
& Sphl
Total
Metal
All
Minera
ls
2002 0.23 0.09 0.30 0.00 0.30 0.52 0.29 0.22 0.45 0.28
2003 0.27 0.05 0.00 0.00 0.39 0.33 0.08 0.00 0.45 0.31
2004 0.24 0.10 0.00 0.00 0.34 0.52 0.21 0.79 0.43 0.28
2005 0.29 0.05 0.00 0.00 0.43 0.27 0.00 0.31 0.36 0.30
2006 0.36 0.29 0.00 0.32 0.51 0.59 0.15 0.31 0.47 0.38
2007 0.21 0.16 0.00 0.33 0.34 0.47 0.07 0.30 0.40 0.26
2008 0.25 0.25 0.38 0.00 0.25 0.32 0.30 1.22 0.43 0.30
2009 0.26 0.17 0.38 0.33 0.18 0.11 0.00 0.00 0.31 0.27
2010 0.32 0.17 0.00 0.00 0.27 0.25 0.15 0.31 0.65 0.40
2011 0.19 0.42 0.38 0.00 0.07 0.21 0.22 1.22 0.26 0.22
Trend in Death rate per thousand persons employed in Indian Mines for the Period 2002-2011
Safety terms and definitions
Unsafe Condition
This is any condition, under the right set of condition, may
create accident.
Unsafe Behavior
Unsafe This is the manner in which an individual conducts
himself/herself that is unsafe to himself/herself or others.
Hazards
This is the source of energy and physiological and
behavioral factors which, when uncontrolled effectively,
results in harmful occurrences.
Safe
This is protected against any possible hazards.
Conveyors
Hazards in Underground Coal Mine
Geological
disturbance
Inadequate
ventilation
Explosives
and fires
Occupational
hazards
Inrushes
of water
Transport
systems
Deficiency of
management
commitment
Personal and
social hazards
Strata and
roof control
Dyke Fold Fault
Temperatur
e
Irrespirable
atmosphere
Respirable
dust
Humid
atmosphere
Explosive
atmosphe
re
Flammable
dust
Explosives Spontaneous
combustion
Haulage or
locomotive
Shafts Free-steered
vehicles
Lifting Machines Noise Contact
with
electricity
Slip and
fall
A
Inadequate
training
Inadequate
supply and
maintenance
of equipment
Inadequate
supervision of
work place
before and
during work
Absenteeism of
supervisor(s) at
night shift work
A
Personal
attitude
Demographic Societal
characteristics
Age Experience OccupationSex Management
worker
interaction
Supervisor
worker
interaction
Co-workers
relationships
Risk
taking
Negative
affectivity
Depression Impulsiveness Unsafe work
behavior
Job
dissatisfaction
Job
stress
Fatal: Which results in death of one or more person
Serious: Which results in serious bodily injury to one or more
person. Serious bodily injury is defined as an injury
which involve the permanent loss of any part of the
body or permanent loss of or injury to the sight or
hearing or any permanent in capacity or fractures of
any bone or joints.
Reportable: Which results in reportable injury to one or
more person. Reportable injury is defined as any injury
other than a serious bodily injury which involves the
enforced absence of the injured person from work
for a period of 72 hours or more.
Minor: Which results in minor injury to one or more
person. Minor injury is defined as any injury
other than a serious bodily injury which involves
the enforced absence of the injured person from work
for a period exceeding 24 hours but, less than 72
hours.
Disasters
Major
Accidents
Sl.
No
Dates of
Accident
Name of Mines Fatalities Cause
1 12/07/1952 Dhemomain 12 Roof fall
2 05/08/1953 Majri 11 Inundation
3 14/03/1954 Damra 10 Explosion of fire damp.
4 10/12/1954 Newton Chikli 63 Inundation
5 05/02/1955 Amlabad 52 Explosion of fire damp.
6 26/09/1956 Burra Dhemo 28 Inundation
7 19/02/1958 Chinakuri 175 Explosion of fire damp.
8 20/02/1958 Central Bhowra 23 Inundation
9 05/01/1960 Damua 16 Inundation
10 28/05/1965 Dhori 268 Coal dust explosion
11 11/04/1968 West Chirmiri 14 Premature collapse of
workings
12 18/03/1973 Jitpur 48 Explosion of fire damp.
13 08/08/1975 Kessurgarh 11 Roof fall
14 18/11/1975 Silewara 10 Inundation
15 27/12/1975 Chasnala 375 Inundation
Major Accidents in the Indian Coal Mines (Post Independence period)
16 16/09/1976 Central Saunda 10 Inundation
17 04/10/1976 Sudamdih 43 Explosion of fire damp.
18 22/01/1979 Baragolai 16 Ignition of fire damp
19 24/08/1981 Jagannath 10 Water gas explosion
20 16/07/1982 Topa 16 Roof fall
21 14/09/1983 Hurriladih 19 Inundation
22 13/11/1989 Mahabir 6 Inundation
23 25/01/1994 New Kenda 55 Fire/suffocation by gases
24 26/09/1995 Gaslitand 64 Inundation
25 06/07/1999 Prascole 6 Fall of roof/collapse of
workings
26 24/06/2000 Kawadi 10 Failure of OC bench
27 02/02/2001 Bagdigi 29 Inundation
28 05/03/2001 Durgapur Rayatwari 6 Collapse of
partings/workings
29 16/06/2003 Godavari Khani-7LEP 17 Inundation
30 16/10/2003 GDK-8A 10 Roof fall
31 15/6/2005 Central Saunda 14 Inundation
Major Accidents in the Indian Coal Mines (Post Independence period)
Trends of Fatal and Serious Accidents in Coal Mines in India
Year
Fatal accidents Serious accidents
Accidents Fatalities Accidents Injuries
1995 137 219 757 813
1996 131 146 677 723
1997 143 165 677 725
1998 128 146 523 560
1999 127 138 595 650
2000 117 144 661 707
2001 106 141 667 720
2002 81 97 629 650
2003 83 113 563 578
2004 90 99 599 608
Average per
year 114 141 635 673
Note: (i) Lignite is included in coal.
The usual practice is to calculate the
death rates and injury rates on the basis
of:
i. 1000 persons employed
ii. 3-lakh manshift worked
iii. Million ton of coal produced
To calculate the frequency rates per 1000 persons
employed, it is necessary to know the actual figures of
average daily employment in mines.
Frequency rate (FR) for fatal, serious and reportable injuries
can be calculated as follows:
No of fatal injuries
FR/Fatal = ------------------------------------  1000
Average daily employment
No of serious injuries
FR/Serious = -------------------------------------  1000
Average daily employment
No of Reportable injuries
FR/Reportable = -------------------------------------  1000
Average daily employment
Frequency Rate (FR) per 3 lakh manshift worked
can be
calculated as below:
No of injuries
FR/ 3 lakh Manshift worked = ------------------------------- 
3,00,000
Total Manshift worked
No of injuries
FR/ Million ton per of coal produced =--------------------------
 106
Total coal produced
One basis of measurement of safety performance is the frequency
of accidents, another is their severity. Severity rate can be
calculated as follows:
Mandays lost  1000
Severity = ------------------------------------
Average daily employment
Mandays lost  300000
Or = -------------------------------------
Total Manshift worked
Mandays lost  106
Or = -------------------------------------
Million ton of coal produced
Severity Index:-----
Severity Index (SI) can be calculated based on following
formula:
(300F + 10S + R)  100,000
SI = ---------------------------------------
Man-shift worked
F = Number of deaths
S = Number of serious injuries
R = Number of Reportable injuries
The weightage of 300:10:1 for fatal, serious, and reportable injuries was
perhaps arrived at by estimating relative manshift lost by each type of
accidents. A modified approach has been established by the DGMS and
is as follows:
(50F + S )  105
SI = ----------------------------
Man-shift worked
Accident Proneness:-----
Though FR and SI values can be taken to identify
accident proneness of mines; however, it is preferable to
compute Arithmetic mean (AM) and Geometric mean (GM) of SI
usually for five years periods to identify accident prone mines.
The DGMS uses the arithmetic mean for identifying the accident
proneness. Accident proneness indices are defined as follows:
n
AM =  SI/n
i=1
n
GM = (  SI )1/n
i=1
Both frequency rate and severity rate indices are useful
measures of safety performances of mines.
These indices generally are used to identify the accident
proneness of mines and based on these indices accident
proneness of the same mine may vary.
To incorporate both frequency and severity rate, a combined
index (CI) has been proposed, where CI is defined as:
FR  SI
CI = --------------------
1000
where, CI = Combined Index
FR = Frequency Rate Index
SI = Severity Index
Average Yearly Fatal/Serious Injuries in Indian Mines
Place of
employment
Average daily
employment
Average number
persons killed per year
Average number
persons seriously
injured per year
Below
ground
2,58,000 110 493
Opencast
workings
75,000 18 71
Above
ground
1,35,000 13 109
Total 4,68,000 141 673
Calculate the Frequency Rates, Severity Index as per DGMS,
and Combine index of Coal Mine Accidents in India.
Basis Causes of Accident Occurrence
Statistical accident/Injury analysis
Methods of Statistical accident/Injury
Analysis
Bivariate analysis
Multivariate analysis
Statistical accident/Injury analysis
Statistical
accident/Injury
analysis
Place-wise Cause-wise
Occupation-wise Body parts-wise
Shift-wise
Statistical accident/Injury analysis
Place-wise analysis based on
Belowground
Opencast
aboveground
Shift-wise analysis based on
Morning Shift
Evening Shift
Night Shift
Statistical accident/Injury analysis
Cause-wise analysis based on
Fall-of-Object
Fall-of-Roof
Fall-of-Side
Haulage
Loading-of-Coal
Slip-and-Fall
Tools-and-Machines
Transportation of Machine
Others
Statistical accident/Injury analysis
Body parts-wise analysis based on
leg
Finger
Back
Hand
Knee
Thumb
Foot
Head
Others
Statistical accident/Injury analysis
Occupation-wise analysis based on
Fall-of-Object
Fall-of-Roof
Fall-of-Side
Haulage
Loading-of-Coal
Slip-and-Fall
Tools-and-Machines
Transportation of Machine
Others
Statistical Accident Analysis – A
Case Study
By
Dr. P. S. Paul
(Published in IM&E Journal, 2001)
Frequency of mandays lost due to accidents/injuries
for the case study mine during 1993-’96.
Mandays lost
(day/days)
Frequency Percent
1
2
3-5
5-15
>15
19
93
30
61
32
8.09
39.57
12.77
25.96
13.62
Mandays lost/injury
Mininmum: 1
Maximum: 172
Average: 10.51
Total mandays lost: 2533
Occupation/
job title
Frequency Percent
Mandays lost
Mandays lost
per injury
Minimum
mandays lost
Maximum
mandays lost
Total
mandays lost
Miner/ Loader 100 41.49 1 172 1230 12.30
Haulage-
Worker
28 11.61 1 79 243 8.67
Piece-rated-
worker
27 11.20 2 114 298 11.04
Mech./elec.-
fitter/helper
18 7.47 1 75 183 10.17
Support-
personnel
17 7.05 2 150 180 10.59
Other-face-
worker
10 4.15 1 33 99 9.90
Driller/exp.
-carrier
5 2.07 1 2 12 2.40
Supervisory-
staff
4 1.66 2 3 13 3.25
Other-worker 32 13.28 1 56 275 8.89
Frequency of injuries and mandays lost based on occupation/job title for the case
study mine during 1993-‘96
Cause of injury/
accident type
Frequency Percent
Mandays lost
Mandays lost
per injury
Minimum
mandays lost
Maximum
mandays lost
Total
mandays lost
Fall-of-object 24 9.96 1 150 386 16.08
Fall-of-roof 20 8.30 2 144 379 18.95
Fall-of-side 10 4.15 2 96 199 19.90
Haulage 26 10.79 1 23 166 6.38
Loading-of-coal 53 21.99 1 114 557 9.94
Slip-and-fall 41 17.01 1 172 406 9.90
Tool-and-
machine
33 13.69 1 44 230 6.97
Transport-of-
material
12 4.98 1 19 82 6.83
Other 22 9.13 1 25 127 5.77
Frequency of injuries and mandays lost based on cause of injury/accident type
for the case study mine during 1993-‘96
Frequency of injury based on occupation and cause of injury and their cross-tabulation for
the case study mine during 1993-’96
Cause of
Injury
Occupation
Group
Fall of Fall of Fall of Haulage Loading Slip Tool Transport Other
object roof side of coal and and of materials
fall machine
Miner/loader
Haulage-
worker
Piece-rated-worker
Mech./Eeec.-
fitter/helper
Support –personnel
Other-face- worker
Driller/exp.- carrier
Supervisory-staff
Other- worker
8 12 7 4 48 12 3 1 5
(8.00) (12.00) (7.0) (4.00) (48.00) (12.00) (3.00) (1.00) (5.00)
3 1 0 7 0 7 7 3 0
(10.71) (3.58) (0.00) (25.00) (0.00) (25.00) (25.00) (10.71) (0.00)
0 0 0 4 0 3 11 5 4
(0.00) (0.00) (0.00) (14.82) (0.00) (11.11) (40.73) (18.52) (14.82)
2 0 0 5 0 4 6 0 1
(11.11) (0.00) (0.00) (27.78) (0.00) (22.22) (33.33) (0.00) (5.56)
6 1 0 3 3 3 0 1 0
(35.29) (5.88) (0.00) (17.65) (17.65) (17.65) (0.00) (5.88) (0.00)
2 3 0 0 0 2 2 0 1
(20.00) (30.00) (0.00) (0.00) (0.00) (20.00) (20.00) (0.00) (10.00)
1 0 0 1 0 1 1 0 1
(20.00) (0.00) (0.00) (20.00) (0.00) (20.00) (20.00) (0.00) (20.00)
0 1 0 0 0 3 0 0 0
(0.00) (25.00) (0.00) (0.00) (0.00) (75.00) (0.00) (0.00) (0.00)
2 2 3 2 2 6 3 2 10
(6.25) (6.25) (9.38) (6.25) (6.25) (18.76) (9.38) (6.25) (31.25)
Figures in the brackets indicate the percentage of injuries
Body part Frequency Percent
Mandays lost
Mandays lost
per injury
Minimum
mandays lost
Maximum
mandays lost
Total
mandays lost
Leg 83 34.44 1 172 1264 15.23
Finger 56 23.24 1 33 265 4.73
Hand 20 8.30 1 73 242 12.10
Back 17 7.05 1 114 282 16.59
Knee 14 5.81 1 13 61 4.36
Thumb 10 4.15 2 18 51 5.1
Foot 8 3.32 1 96 208 26
Head 7 2.91 2 3 15 2.14
All other 26 10.79 1 44 145 5.58
Frequency of injuries and mandays lost based on body parts injured
for the case study mine during 1993-‘96
Frequency of injury based on body parts injured and cause of injury and their cross-tabulation for
the case study mine during 1993- ’96
Cause of
Injury
Body part
Fall of Fall of Fall of Haulage Loading Slip Tool Transport Other
object roof side of coal and and of material
fall machine
Leg
Finger
Hand
Back
Knee
Thumb
Foot
Head
All other
8 8 5 7 27 14 5 3 6
(9.63) (9.63) (6.02) (8.54) (32.93) (17.07) (6.09) (3.66) (7.32)
3 2 1 8 13 1 16 7 5
(5.36) (3.57) (1.79) (14.29) (23.21) (1.79) (28.56) (12.50) (8.93)
0 2 0 6 1 6 3 0 2
(0.00) (10.00) (0.00) (30.00) (5.00) (30.00) (15.00) (0.00) (10.00)
4 2 1 1 3 2 1 0 3
(23.53) (11.77) (5.88) (5.88) (17.64) (11.76) (5.88) (0.00) (17.65)
2 0 1 3 0 4 1 0 3
(14.289) (0.00) (7.14) (21.43) (0.00) (28.57) (7.14) (0.00) (21.43)
3 0 0 1 3 2 1 0 0
(30.00) (0.00) (0.00) (10.00) (30.00) (20.00) (10.00) (0.00) (0.00)
1 3 2 0 0 1 1 0 0
(12.50) (37.50) (25.00) (0.00) (0.00) (12.50) (12.50) (0.00) (0.00)
0 2 0 0 1 2 0 1 1
(0.00) (33.33) (0.00) (0.00) (16.67) (33.33) (0.00) (16.67) (14.29)
3 1 0 0 5 9 5 1 2
(11.54) (3.85) (0.00) (0.00) (19.23) (34.62) (19.23) (3.84) (7.69)
Figures in the brackets indicate the percentage of injuries
Chapter - 5
Investigations into
Accident and Accident
Report
Investigations into Accident
(Part-I)
The primary purpose of accident investigation is
to identify the causes and circumstances leading
to the accident so that suitable measures may be
taken to further accident of similar type.
a successful accident investigation must answer
three questions:
1. What happened?
2. How it happened?
3. Why it happened?
and to serve as a basis of prevention, a fourth
question:
4. How it can be prevented?
Procedure:
 Collection of basic information
 Inspection of the site of accident
 Preparation of accident site plan by the surveyor
 Examination of records, reports, plan etc.
 Examination of materials, equipments etc. and their
testing, if required.
 Examination of Witness
 Analysis of evidence: Identification of the unsafe acts
and condition
 Date and time of accident
 Name, age, sex and nature of job of the victim
 Details of Vocational training undergone by the
victim
 Place of accident
 Apparent cause of accident
 Details of the mine working and operations
related to the accident
 System of supervision and name of the
supervisors
 Observation of the minutest details at the accident
site
 All materials and objects found at the site should
be noted
 The position of the victim(s) and the eye-witness
should be recorded
 The enquiry officer should himself draw a sketch
plan of the accident site showing all the details
They should prepare an accident plan (R.F. of
100:1) showing all the details of the accident site
A close examination relating to the accident is
essential to ascertain:
– The general system of work
– Awareness of lurking dangers
– Promptness in dealing with defects and dangers
– Status of safety prevailing prior to the accident
– Availability and effectiveness of supervision
These should be examined by experts, and if
necessary, be tested at a reliable laboratory
 The witness should be examined in a definite
sequence
 The witness should be examined individually
and separately
 All eye-witness should be examined at the
site of the accident
 The inquiry officer should not disturb the
emotional and verbose witness but allow
them to speak
 If conflicting statements are made by
different witness, the should be re-examined
 The inquiry officer should analyze
systematically all the recorded evidence in the
light of his own observations at the accident
site.
 He should point out the contraventions of the
statutory provisions and should identify the
unsafe acts and unsafe conditions that
resulted in the accident
Accident Report
(Part-II)
The report should be detailed under the following
heads:
Introduction
Background information
Events prior to accident
Occurrence of the accident
Rescue and recovery
Inspection and enquiry
Analysis of evidence
Causes of the accident
Responsibility
Recommendations
As a safety officer, put up a report of enquiry and investigation into a fatal accident
due to fall of roof in a depillaring area killing two loaders on spot.
From : ---------------- , Safety Officer,
---------------- Colliery. Dated, 1st November,
2010
To
The Manager,
----------------- Colliery,
Sir,
Ref. Your letter No. A/E – 235 dated 17.08.2008
I am submitting herewith a report on roof fall accident that occurred on 13th
September, 2010 at about 8 p.m. in the depillaring district in ----------
seam at ------------ colliery and resulted in death of two loaders namely, -------------- and
--------------.
Encl. Inquiry Report. Yours faithfully,
(Signed)
ACCIDENT REPORT
ACCIDENT REPORT
Chapter - 6
In-depth Study of Accidents due
to Multivariate Cause
(with case study)
Work
Injuries
Demographics
•Age
•Experience
Negative Personality
•Impulsivity
•Risk Taking
•Negative
Affectivity
•Depression
Social Support
•Co-Worker
Support
•Supervisory
Support
•Management
Worker
Interaction
Safety Environment
•Safety Training
•Safety practice
•Safety Equipment
Availability and
Maintenance
Work Hazards
•Physical Hazards
•Production Pressure
Job Dissatisfaction
Job Stress
Safe Work Behavior
Determinants of work injuries in mines
Identified factors No. of questions
asked to the mine workers
No. of questions
retained after reliability and validity
test
Reliability
Risk taking
Negative affectivity
Job Dissatisfaction
Impulsivity
Depression
Job stress
Safety training
Safety practice
Safety equipment
availability and maintenance
Co- worker’s support
Supervisory Support
Management worker
interaction
Production pressure
Physical hazards
Safe work behavior
11
15
13
12
5
12
8
27
9
7
7
14
4
15
8
9
11
12
8
5
8
6
19
8
5
7
10
4
11
8
0.82
0.83
0.83
0.71
0.65
0.67
0.66
0.80
0.72
0.64
0.71
0.84
0.79
0.65
0.67
Reliability and Validity Test of the Collected Data
Age
58
55
53
51
49
47
45
43
41
39
37
35
33
31
29
27
25
23
14
12
10
8
6
4
2
0
Group
NAG
AG
Miners’ Age (in Year)
Number of AG Respondents in
excess of NAG
Number of NAG Respondents
in excess of AG
High-Low Plots between AG and NAG Workers
Negative Affectivity
31.00
29.00
27.00
25.00
23.00
21.00
19.00
17.00
15.00
13.00
11.00
30
20
10
0
Group
NAG
AG
Respondents’ scores on Negative Affectivity
High-Low Plots between AG and NAG Workers (Contd.)
Job Di ssatiafacti on
36.00
34.00
32.00
30.00
28.00
26.00
24.00
22.00
20.00
18.00
16.00
14.00
12.00
20
10
0
Group
NAG
AG
Respondents’ scores on Job Dissatisfaction
High-Low Plots between AG and NAG Workers (Contd.)
Physi cal Hazards
37.00
32.00
30.00
28.00
26.00
24.00
22.00
20.00
18.00
16.00
13.00
11.00
30
20
10
0
Group
NAG
AG
Respondents’ scores on Physical Hazards
High-Low Plots between AG and NAG Workers (Contd.)
Management Worker Int eraction
30.00
28.00
26.00
24.00
22.00
20.00
18.00
16.00
14.00
12.00
10.00
30
20
10
0
Group
NAG
AG
Respondents’ scores on Management Worker Interaction
High-Low Plots between AG and NAG Workers (Contd.)
Characteristic Variables Categories
Coefficient β
(estimate)
P-Value
(Significance)
Crude OR
e β
(95% CI)
Demographic
Age
AGE0RC
--
0.557
--
0.019
1
1.74 (1.10-2.78)AGE1
Experience
EXP0RC --
0.51
--
0.033
1
1.67 (1.04-2.67)EXP1
Negative
Personality
Impulsivity
IMP0RC --
0.956
--
<0.001
1
2.60 (1.63-4.15)IMP1
Negative
Affectivity
N_A0RC
--
1.24
--
<0.001
1
3.45 (2.15-5.55)N_A1
Risk Taking
RISK_TK0RC
--
0.99
--
<0.001
1
2.70 (1.69-4.31)RISK_TK1
Depression
DEPR0RC --
0.48
--
0.038
1
1.62 (1.03-2.56)DEPR1
Safe Work
Behavior
Safe Work
Behavior
SA_W_BEH0RC --
-0.65
--
0.006
1
0.52 (0.33-0.83)SA_W_BEH1
Job Stress Job Stress
JOB_STR0RC --
0.76
--
0.001
1
2.14 (1.35-3.41)JOB_STR1
Bivariate Odds of Injury to Workers for the Variables with Categories
Characteristics Variables Categories
Coefficient β
(estimate)
P-Value
(Significance)
Crude OR (e β)
(95% CI)
Job
Dissatisfaction
Job
Dissatisfaction
JOB_DIS0RC --
0.95
--
<0.001
1
2.59 (1.63-4.12)JOB_DIS1
Work Hazards
Production
Pressure
PROD_PR0RC --
0.13
--
0.56
1
1.14 (0.73-1.80)PROD_PR1
Physical
Hazards
PHY_HRZ0RC --
0.87
--
<0.001
1
2.39 (1.50-3.79)PHYHRZ1
Safety
Environment
Safety
Training
SAF_TR0RC --
-0.52
--
0.028
1
0.60 (0.38-0.95)SAF_TR1
Safety
Practice
SAF_PRC0RC --
-1.34
--
<0.001
1
0.32 (0.20-0.52)SAF_PRC1
Safety
Equipment
Availability
and Maintenance
SA_EQUP0RC
--
-0.72
--
0.002
1
0.49 (0.31-0.78)SA_EQUP1
Social Support
Co-Worker
Support
CO_SPRT0RC --
-0.31
--
0.195
1
0.74 (0.46-1.17)CO_SPRT1
Supervisory
Support
SUP_SPRT0RC --
-0.87
--
<0.001
1
0.42 (0.26-0.67)SUP_SPRT1
Management
Worker
Interaction
M_W_INT0RC --
-0.95
--
<0.001
1
0.39 (0.24-0.62)M_W_INT1
Bivariate Odds of Injury to Workers for the Variables with Categories (Contd.)
Predictor categoricala variables r Model 1 Model 2 Model 3 Model 4 Model 5 Model 6
Demographics
Age
Experience
Negative personality
Impulsivity
Negative affectivity
Depression
Risk taking
Safe work behavior
Safe work behavior
Job stress
Job stress
Job dissatisfaction
Job dissatisfaction
Work hazards
Production pressure
Physical hazards
Safety environment
Safety training
Safety practice
Safety equipment availability
and maintenance
Social support
Co-worker support
Supervisory support
Management worker interaction
Predictive accuracy (%)
Total R2
 R2
0.27***
0.25***
0.21***
0.37***
0.08
0.35***
-0.22***
0.17***
0.31***
0.17***
0.24***
-0.25***
-0.36***
-0.30***
-0.08
-0.27***
-0.29***
0.41
0.19
56.7
0.026***
0.026***
0.75*
0.15
0.41
1.03***
-0.14
0.59**
67.3
0.189***
0.163***
0.77*
0.13
0.35
1.11***
-0.29
0.39
-0.34
-0.22
0.48*
69.3
0.206***
0.017**
0.70*
0.22
0.40
0.92***
-0.09
0.41
-0.42
-0.25
0.48*
0.41
0.57**
69.3
0.228***
0.022**
0.75*
0.15
0.50
0.90***
-0.16
0.38
-0.30
-0.12
0.55*
0.40
0.53*
0.46
-0.52
-0.24
68.3
0.241***
0.013
0.76*
0.15
0.55
0.93***
-0.18
0.36
-0.26
-0.12
0.53*
0.39
0.52*
0.47
-0.48
0.27
0.19
0.14
-0.34
68.7
0.244***
0.003
Note. For Models 1 – 6, standardized regression coefficients (β) are reported. * P < 0.10, ** P  0.05, *** P  0.01.
a category (0) represents the reference group. For example, AGE (0) is the reference group of age variable. The parameter (β) for AGE (1) is estimated with reference to AGE (0).
Multivariate Logistic Regression Results Predicting Work Injury
Characteristic Variables Categories
Coefficient
β (estimate)
P-Value
(Significance
Adjusted OR (e β)
(95% CI)
Demographic
Age
AGE0RC
--
0.76
--
0.078
1
2.14 (0.91-4.10)AGE1
Experience
EXP0RC
--
0.14
--
0.732
1
1.16 (0.50-2.69)
EXP1
Negative
Personality
Impulsivity
IMP0RC --
0.55
--
0.168
1
1.73 (0.79-3.76)
IMP1
Negative
Affectivity
N_A0RC
--
0.933
--
0.014
1
2.54 (1.21-5.35)
N_A1
Risk Taking
RISK_TK0RC --
0.36
--
0.279
1
1.44 (0.75-2.76)
RISK_TK1
Depression
DEPR0RC --
-0.18
--
0.566
1
0.83 (0.44-1.56)
DEPR1
Safe Work
Behavior
Safe Work
Behavior
SA_W_BEH0RC
--
-0.26
--
0.428
1
0.78 (0.41-1.46)
SA_W_BEH1
Job Stress
Job
Stress
JOB_STR0RC
--
-0.12
--
0.772
1
0.89 (0.40-1.97)JOB_STR1
Multivariate Odds of Injury to Workers for the Variables with Categories
Characteristics Variables Categories
Coefficient β
(estimate)
P-Value
(Significance)
Adjusted OR (e β)
(95% CI)
Job
Dissatisfaction
Job
Dissatisfaction
JOB_DIS0RC --
0.53
--
0.092
1
1.71 (0.92-3.17)JOB_DIS1
Work Hazards
Production
Pressure
PROD_PR0RC --
0.39
--
0.192
1
1.49 (0.83-2.68)PROD_PR1
Physical
Hazards
PHY_HRZ0RC --
0.52
--
0.073
1
1.69 (0.95-3.00)PHY_HRZ1
Safety
Environment
Safety
Training
SAF_TR0RC --
0.47
--
0.188
1
1.60 (0.80-3.22)SAF_TR1
Safety
Practice
SAF_PRC0RC --
-0.48
--
0.239
1
0.62 (0.28-1.38)SAF_PRC1
Safety
Equipment
Availability
& Maintenance
SA_EQUP0RC
--
0.27
--
0.483
1
1.30 (0.62-2.73)SA_EQUP1
Social Support
Co-Worker
Support
CO_SPRT0RC --
0.19
--
0.545
1
1.21 (0.66-2.22)CO_SPRT1
Supervisory
Support
SUP_SPRT0RC
--
0.14
--
0.729
1
1.15 (0.53-2.49)SUP_SPRT1
Management
Worker
Interaction
M_W_INT0RC
--
-0.34
--
0.433
1
0.72 (0.31-1.65)M_W_INT1
Multivariate Odds of Injury to Workers for the Variables with Categories (Contd.)
Age 1.000
Exp 0.816 1.000
Work injury 0.271 0.249 1.000
Impulsivity -0.143 -0.085 0.214 1.000
Negative affectivity -0.114 -0.078 0.373 0.600 1.000
Depression -0.046 -0.059 0.084 0.183 0.409 1.000
Risk taking -0.001 0.033 0.349 0.467 0.586 0.224 1.000
Safety training 0.074 0.060 -0.251 -0.577 -0.444 -0.112 -0.464 1.000
Safety practice 0.052 0.040 -0.358 -0.607 -0.521 -0.251 -0.668 0.523 1.000
SEAM* -0.024 -0.056 -0.296 -0.350 -0.404 -0.277 -0.557 0.344 0.653 1.000
Job stress -0.103 -0.054 0.169 0.630 0.672 0.375 0.568 -0.543 -0.600 -0.460 1.000
Co-worker support 0.118 0.087 -0.078 -0.456 -0.315 -0.084 -0.349 0.300 0.501 0.368 -0.375 1.000
Supervisory support 0.042 -0.001 -0.269 -0.600 -0.547 -0.285 -0.660 0.631 0.716 0.560 -0.660 0.357 1.000
M_W_INT** 0.053 0.012 -0.292 -0.588 -0.515 -0.295 -0.627 0.543 0.799 0.673 -0.659 0.451 0.817 1.000
Job dissatisfaction 0.001 0.026 0.306 0.386 0.475 0.347 0.524 -0.436 -0.573 -0.625 0.617 -0.215 -0.653 -0.665 1.000
Physical hazards 0.094 0.107 0.238 0.301 0.329 0.211 0.424 -0.200 -0.497 -0.514 0.455 -0.251 -0.465 -0.511 0.482 1.000
Production pressure 0.113 0.124 0.169 0.119 0.240 0.413 0.424 -0.293 -0.362 -0.385 0.398 -0.099 -0.542 -0.466 0.507 0.459 1.000
Safe work behaviour 0.055 0.010 -0.217 -0.368 -0.303 -0.362 -0.370 0.166 0.539 0.307 -0.258 0.361 0.396 0.387 -0.288 -0.172 -0.181 1.000
Mean 37.34 14.58 0.50 16.02 20.88 8.707 18.58 13.22 39.67 15.73 16.82 12.86 14.91 20.36 23.54 24.10 8.78 20.27
Standard deviation 9.01 9.25 0.50 4.12 5.95 2.55 5.41 3.27 7.53 3.93 3.99 2.18 3.68 5.44 6.16 4.36 2.82 2.99
* Safety Equipment availability and maintenance ** Management workers interaction
Correlation coefficient  0.113 indicates 0.05 probability level of significance
Correlations amongst the Major Variables for Accident Path Model
Age X 1
Experience X 2
Demographic
1
Work Injury X 3
Work Injury
2
Impulsivity X 4
Negative affectivity X 5
Depression X 6
Risk Taking X 7
Negative Personality
3
Job Stress X 11
Co-Worker Support X 12
Supervisory Support X 13
Management Worker Interaction X
14
Safety Training X8
Safety Practice X 9
Safety equipment Availability
and Maintenance X 10
Safety Environment
4
Job Stress
5
Job Dissatisfaction X 15
Physical Hazards X 16
Production Pressure X17
Safe Work Behavior X 18
Social Support
6
Job Dissatisfaction
7
Work Hazards
8
Safe Work Behavior 9
0.99*
0.82*
1.00
0.70*
0.72*
0.40*
0.78*
0.61*
0.85*
0.70*
1.00
0.48*
0.88*
0.90*
1.00
0.71*
0.65*
1.00
[* indicates 0.01 probability level of significance]
Path Diagram of Measurement Model
Demographic 1.00
Work injury 0.29* 1.00
Negative personality -0.10* 0.41* 1.00
Safety environment 0.04 -0.42* -0.94* 1.00
Job stress -0.09 0.17* 0.86* -0.73* 1.00
Social support 0.06 -0.30* -0.91* 0.83* -0.75* 1.00
Job dissatisfaction 0.01 0.31* 0.65* -0.75* 0.62* -0.70* 1.00
Work hazards 0.17* 0.30* 0.67* -0.77 * 0.63* -0.78* 0.73* 1.00
Safe work behavior 0.04 -0.22* -0.51* 0.49* -0.26* 0.48* -0.29* -0.26* 1.00
* indicates 0.01 probability level of significance
Structural Correlations among Latent Variables Presented in the
Measurement Model for Injury/Accident Causation
Job Dissatisfaction 4
Work Injury
6
Safety Environment 1
Safe Work Behavior
5
Negative Personality
3
Job Stress 2
Work Hazards 1
Social Support
2
Demographic 3
-0.24*
0.69*
-0.39*
-0.65*
-0.06
0.05
-0.02
-0.03
0.38*
-0.25*
-0.37*
0.37*
-0.40*
0.08
-0.01
0.26*
0.29*
-0.14*
0.08*
0.76*
0.87*
0.40*
0.22*
0.37*
[* indicates 0.05 probability level of significance]
Accident Model Path Diagram
Chapter - 7
Measures for Improving
Safety
Chapter - 8
Cost of Accidents
Risk
This is a measure of the likelihood and severity of a negative
effect to environment, equipment/property, or the health.
The phase of evaluation is realized by estimating the
probability of an unwanted event occurring (P) and the
consequences of that event (D). Mathematically,
Risk (R) = P x D
The sign x expresses the function according to the kind of
evaluation. It can be a matrix or product. The risk index,
particularly when estimating human risk to safety and health
may vary according to human exposure to specific sites or
sources.
Risk
Component
Threats
Consequences
Resources
Component of Risk
Modifying
Factors

More Related Content

What's hot

Mine explosions
Mine explosionsMine explosions
Mine explosionsSafdar Ali
 
Emergency preparedness plan for mines
Emergency preparedness plan for minesEmergency preparedness plan for mines
Emergency preparedness plan for minesKrishna Deo Prasad
 
Danger due to fire & innundation
Danger due to fire & innundationDanger due to fire & innundation
Danger due to fire & innundationKrishna Deo Prasad
 
Inundation
InundationInundation
InundationVR M
 
Study of Occupational Health and Safety In mines
Study of Occupational Health and Safety In minesStudy of Occupational Health and Safety In mines
Study of Occupational Health and Safety In minesAmitKumar8151
 
Optimization of Blasting Parameters in open cast mines
Optimization of Blasting Parameters in open cast minesOptimization of Blasting Parameters in open cast mines
Optimization of Blasting Parameters in open cast minesAnurag Jha
 
Dangers from surface & Underground water
Dangers from surface & Underground water  Dangers from surface & Underground water
Dangers from surface & Underground water Rathin Biswas
 
Reduction of risk from roof and side fall in Indian coal mines
Reduction of risk from roof and side fall in Indian coal minesReduction of risk from roof and side fall in Indian coal mines
Reduction of risk from roof and side fall in Indian coal minesVR M
 
Blast hole drill
Blast hole drillBlast hole drill
Blast hole drillpavan kumar
 
Mine Opening and Development
Mine Opening and DevelopmentMine Opening and Development
Mine Opening and DevelopmentAnurag Jha
 
Mine illumination
Mine illuminationMine illumination
Mine illuminationPranjal Sao
 
Mine gases and testing, maintenance of fire seals
Mine gases and testing, maintenance of fire sealsMine gases and testing, maintenance of fire seals
Mine gases and testing, maintenance of fire sealsSafdar Ali
 
Explosives and accesories
Explosives and accesoriesExplosives and accesories
Explosives and accesoriesSafdar Ali
 
Mine air sampling
Mine air samplingMine air sampling
Mine air samplingOmKaitade
 

What's hot (20)

Mining hazards
Mining hazardsMining hazards
Mining hazards
 
Mine explosions
Mine explosionsMine explosions
Mine explosions
 
BENCH & ROAD STANDARS IN OPENCAST MINES.pptx
BENCH & ROAD STANDARS IN OPENCAST MINES.pptxBENCH & ROAD STANDARS IN OPENCAST MINES.pptx
BENCH & ROAD STANDARS IN OPENCAST MINES.pptx
 
Emergency preparedness plan for mines
Emergency preparedness plan for minesEmergency preparedness plan for mines
Emergency preparedness plan for mines
 
Danger due to fire & innundation
Danger due to fire & innundationDanger due to fire & innundation
Danger due to fire & innundation
 
Inundation
InundationInundation
Inundation
 
Study of Occupational Health and Safety In mines
Study of Occupational Health and Safety In minesStudy of Occupational Health and Safety In mines
Study of Occupational Health and Safety In mines
 
Mines vocational training rules 1966 short answer notes
Mines vocational training rules 1966 short answer notesMines vocational training rules 1966 short answer notes
Mines vocational training rules 1966 short answer notes
 
Optimization of Blasting Parameters in open cast mines
Optimization of Blasting Parameters in open cast minesOptimization of Blasting Parameters in open cast mines
Optimization of Blasting Parameters in open cast mines
 
Dangers from surface & Underground water
Dangers from surface & Underground water  Dangers from surface & Underground water
Dangers from surface & Underground water
 
Blasting
BlastingBlasting
Blasting
 
Reduction of risk from roof and side fall in Indian coal mines
Reduction of risk from roof and side fall in Indian coal minesReduction of risk from roof and side fall in Indian coal mines
Reduction of risk from roof and side fall in Indian coal mines
 
Blast hole drill
Blast hole drillBlast hole drill
Blast hole drill
 
Mine Opening and Development
Mine Opening and DevelopmentMine Opening and Development
Mine Opening and Development
 
Mine illumination
Mine illuminationMine illumination
Mine illumination
 
Mine gases and testing, maintenance of fire seals
Mine gases and testing, maintenance of fire sealsMine gases and testing, maintenance of fire seals
Mine gases and testing, maintenance of fire seals
 
Explosives and accesories
Explosives and accesoriesExplosives and accesories
Explosives and accesories
 
SELF RESCUER.pptx
SELF RESCUER.pptxSELF RESCUER.pptx
SELF RESCUER.pptx
 
Mine air sampling
Mine air samplingMine air sampling
Mine air sampling
 
UG Explosives and Blasting
UG Explosives and BlastingUG Explosives and Blasting
UG Explosives and Blasting
 

Similar to Safety in mines

Mechanisation Vs Accidents in Mining
Mechanisation Vs Accidents in MiningMechanisation Vs Accidents in Mining
Mechanisation Vs Accidents in MiningVR M
 
Presentation on risk perception and safety analysis of petroleum production s...
Presentation on risk perception and safety analysis of petroleum production s...Presentation on risk perception and safety analysis of petroleum production s...
Presentation on risk perception and safety analysis of petroleum production s...Numan Hossain
 
Final report sk 12 (2)
Final report sk 12 (2)Final report sk 12 (2)
Final report sk 12 (2)Deepak Nama
 
Accident prevention and risk management
Accident prevention and risk managementAccident prevention and risk management
Accident prevention and risk managementHealthsafety institute
 
Training report-hzl-cszl
Training report-hzl-cszlTraining report-hzl-cszl
Training report-hzl-cszlAnil Maurya
 
What does the future hold for mechanical equipment? Wally Koppe
What does the future hold for mechanical equipment? Wally KoppeWhat does the future hold for mechanical equipment? Wally Koppe
What does the future hold for mechanical equipment? Wally KoppeNSW Environment and Planning
 
20th_Safety_Convention dt 11.09.2023.pdf
20th_Safety_Convention dt 11.09.2023.pdf20th_Safety_Convention dt 11.09.2023.pdf
20th_Safety_Convention dt 11.09.2023.pdfRajesh Prasad
 
RECOVERY OF ZIRCONS OF SOUTH EASTERN COAST OF INDIA: THEIR POTENTIAL AS REFRA...
RECOVERY OF ZIRCONS OF SOUTH EASTERN COAST OF INDIA: THEIR POTENTIAL AS REFRA...RECOVERY OF ZIRCONS OF SOUTH EASTERN COAST OF INDIA: THEIR POTENTIAL AS REFRA...
RECOVERY OF ZIRCONS OF SOUTH EASTERN COAST OF INDIA: THEIR POTENTIAL AS REFRA...IAEME Publication
 
KRCL Case Study
KRCL Case StudyKRCL Case Study
KRCL Case StudyPembaDcl
 
The characterisation of hail and fraudulent impacts to vehicle body panels
The characterisation of hail and fraudulent impacts to vehicle body panelsThe characterisation of hail and fraudulent impacts to vehicle body panels
The characterisation of hail and fraudulent impacts to vehicle body panelsVisvarajah Somasundaram
 
mitigation of mininig.pdf.pptx
mitigation of mininig.pdf.pptxmitigation of mininig.pdf.pptx
mitigation of mininig.pdf.pptxRajaDurai639944
 
Accidents (1) Windpower the most dangerous power source in the world
Accidents (1) Windpower the most dangerous power source in the world  Accidents (1) Windpower the most dangerous power source in the world
Accidents (1) Windpower the most dangerous power source in the world www.thiiink.com
 
Baghjan oil well answer sept 14
Baghjan oil well answer sept 14Baghjan oil well answer sept 14
Baghjan oil well answer sept 14ZahidManiyar
 
Legislative changes needed in India
Legislative changes needed in IndiaLegislative changes needed in India
Legislative changes needed in IndiaVR M
 

Similar to Safety in mines (20)

Mechanisation Vs Accidents in Mining
Mechanisation Vs Accidents in MiningMechanisation Vs Accidents in Mining
Mechanisation Vs Accidents in Mining
 
Presentation on risk perception and safety analysis of petroleum production s...
Presentation on risk perception and safety analysis of petroleum production s...Presentation on risk perception and safety analysis of petroleum production s...
Presentation on risk perception and safety analysis of petroleum production s...
 
Coal
CoalCoal
Coal
 
Fire on mobile plant U'Brien Stutchbury
Fire on mobile plant U'Brien StutchburyFire on mobile plant U'Brien Stutchbury
Fire on mobile plant U'Brien Stutchbury
 
Final report sk 12 (2)
Final report sk 12 (2)Final report sk 12 (2)
Final report sk 12 (2)
 
Accident prevention and risk management
Accident prevention and risk managementAccident prevention and risk management
Accident prevention and risk management
 
Training report-hzl-cszl
Training report-hzl-cszlTraining report-hzl-cszl
Training report-hzl-cszl
 
What does the future hold for mechanical equipment? Wally Koppe
What does the future hold for mechanical equipment? Wally KoppeWhat does the future hold for mechanical equipment? Wally Koppe
What does the future hold for mechanical equipment? Wally Koppe
 
Fire and explosion hazards
Fire and explosion hazardsFire and explosion hazards
Fire and explosion hazards
 
20th_Safety_Convention dt 11.09.2023.pdf
20th_Safety_Convention dt 11.09.2023.pdf20th_Safety_Convention dt 11.09.2023.pdf
20th_Safety_Convention dt 11.09.2023.pdf
 
RECOVERY OF ZIRCONS OF SOUTH EASTERN COAST OF INDIA: THEIR POTENTIAL AS REFRA...
RECOVERY OF ZIRCONS OF SOUTH EASTERN COAST OF INDIA: THEIR POTENTIAL AS REFRA...RECOVERY OF ZIRCONS OF SOUTH EASTERN COAST OF INDIA: THEIR POTENTIAL AS REFRA...
RECOVERY OF ZIRCONS OF SOUTH EASTERN COAST OF INDIA: THEIR POTENTIAL AS REFRA...
 
30120140505007
3012014050500730120140505007
30120140505007
 
Proximity detection and anti collision workshop
Proximity detection and anti collision workshopProximity detection and anti collision workshop
Proximity detection and anti collision workshop
 
KRCL Case Study
KRCL Case StudyKRCL Case Study
KRCL Case Study
 
The characterisation of hail and fraudulent impacts to vehicle body panels
The characterisation of hail and fraudulent impacts to vehicle body panelsThe characterisation of hail and fraudulent impacts to vehicle body panels
The characterisation of hail and fraudulent impacts to vehicle body panels
 
Analisis de seguridad
Analisis de seguridadAnalisis de seguridad
Analisis de seguridad
 
mitigation of mininig.pdf.pptx
mitigation of mininig.pdf.pptxmitigation of mininig.pdf.pptx
mitigation of mininig.pdf.pptx
 
Accidents (1) Windpower the most dangerous power source in the world
Accidents (1) Windpower the most dangerous power source in the world  Accidents (1) Windpower the most dangerous power source in the world
Accidents (1) Windpower the most dangerous power source in the world
 
Baghjan oil well answer sept 14
Baghjan oil well answer sept 14Baghjan oil well answer sept 14
Baghjan oil well answer sept 14
 
Legislative changes needed in India
Legislative changes needed in IndiaLegislative changes needed in India
Legislative changes needed in India
 

More from Safdar Ali

Role of management information systems in a mine.
Role of management information systems in a mine.Role of management information systems in a mine.
Role of management information systems in a mine.Safdar Ali
 
Pre requisites of marine operations
Pre requisites of marine operationsPre requisites of marine operations
Pre requisites of marine operationsSafdar Ali
 
Nuclear devices for mining
Nuclear devices for miningNuclear devices for mining
Nuclear devices for miningSafdar Ali
 
Mining of manganese nodules from sea floor
Mining of manganese nodules from sea floorMining of manganese nodules from sea floor
Mining of manganese nodules from sea floorSafdar Ali
 
Mine water risk in open pit slope stability
Mine water risk in open pit slope stabilityMine water risk in open pit slope stability
Mine water risk in open pit slope stabilitySafdar Ali
 
Innovations and trend in metal mining &amp; tunnellng
Innovations and trend in metal mining &amp; tunnellngInnovations and trend in metal mining &amp; tunnellng
Innovations and trend in metal mining &amp; tunnellngSafdar Ali
 
Lighting terminlologyand their units
Lighting terminlologyand their unitsLighting terminlologyand their units
Lighting terminlologyand their unitsSafdar Ali
 
Evaluation of slope stability for waste rock dumps in a mine
Evaluation of slope stability for waste rock dumps in a mineEvaluation of slope stability for waste rock dumps in a mine
Evaluation of slope stability for waste rock dumps in a mineSafdar Ali
 
Final grouting freezing
Final grouting freezingFinal grouting freezing
Final grouting freezingSafdar Ali
 
Digitization and 3d modelling of a mine plan
Digitization and 3d modelling of a mine planDigitization and 3d modelling of a mine plan
Digitization and 3d modelling of a mine planSafdar Ali
 
Variety of mine plans and sections &amp; second schedule
Variety of mine plans and sections &amp; second scheduleVariety of mine plans and sections &amp; second schedule
Variety of mine plans and sections &amp; second scheduleSafdar Ali
 
Statutory provisions for the preaparation of mine plans and sections
Statutory provisions for the preaparation of mine plans and sectionsStatutory provisions for the preaparation of mine plans and sections
Statutory provisions for the preaparation of mine plans and sectionsSafdar Ali
 
Gps &amp; its applications in opencast mine surveying
Gps &amp; its applications in opencast mine surveyingGps &amp; its applications in opencast mine surveying
Gps &amp; its applications in opencast mine surveyingSafdar Ali
 
Laser and its mining applications
Laser and its mining applicationsLaser and its mining applications
Laser and its mining applicationsSafdar Ali
 
Gyrotheodolite
GyrotheodoliteGyrotheodolite
GyrotheodoliteSafdar Ali
 
Correlation survey and depth measurement in underground metal mines
Correlation survey and depth measurement in underground metal minesCorrelation survey and depth measurement in underground metal mines
Correlation survey and depth measurement in underground metal minesSafdar Ali
 

More from Safdar Ali (20)

Tunneling
TunnelingTunneling
Tunneling
 
Role of management information systems in a mine.
Role of management information systems in a mine.Role of management information systems in a mine.
Role of management information systems in a mine.
 
Basting
BastingBasting
Basting
 
Pre requisites of marine operations
Pre requisites of marine operationsPre requisites of marine operations
Pre requisites of marine operations
 
Nuclear devices for mining
Nuclear devices for miningNuclear devices for mining
Nuclear devices for mining
 
Mining of manganese nodules from sea floor
Mining of manganese nodules from sea floorMining of manganese nodules from sea floor
Mining of manganese nodules from sea floor
 
Mine water risk in open pit slope stability
Mine water risk in open pit slope stabilityMine water risk in open pit slope stability
Mine water risk in open pit slope stability
 
Innovations and trend in metal mining &amp; tunnellng
Innovations and trend in metal mining &amp; tunnellngInnovations and trend in metal mining &amp; tunnellng
Innovations and trend in metal mining &amp; tunnellng
 
Lighting terminlologyand their units
Lighting terminlologyand their unitsLighting terminlologyand their units
Lighting terminlologyand their units
 
Evaluation of slope stability for waste rock dumps in a mine
Evaluation of slope stability for waste rock dumps in a mineEvaluation of slope stability for waste rock dumps in a mine
Evaluation of slope stability for waste rock dumps in a mine
 
Final grouting freezing
Final grouting freezingFinal grouting freezing
Final grouting freezing
 
Digitization and 3d modelling of a mine plan
Digitization and 3d modelling of a mine planDigitization and 3d modelling of a mine plan
Digitization and 3d modelling of a mine plan
 
Variety of mine plans and sections &amp; second schedule
Variety of mine plans and sections &amp; second scheduleVariety of mine plans and sections &amp; second schedule
Variety of mine plans and sections &amp; second schedule
 
Statutory provisions for the preaparation of mine plans and sections
Statutory provisions for the preaparation of mine plans and sectionsStatutory provisions for the preaparation of mine plans and sections
Statutory provisions for the preaparation of mine plans and sections
 
Gps &amp; its applications in opencast mine surveying
Gps &amp; its applications in opencast mine surveyingGps &amp; its applications in opencast mine surveying
Gps &amp; its applications in opencast mine surveying
 
Laser and its mining applications
Laser and its mining applicationsLaser and its mining applications
Laser and its mining applications
 
Gyrotheodolite
GyrotheodoliteGyrotheodolite
Gyrotheodolite
 
Gps2
Gps2Gps2
Gps2
 
Gps1
Gps1Gps1
Gps1
 
Correlation survey and depth measurement in underground metal mines
Correlation survey and depth measurement in underground metal minesCorrelation survey and depth measurement in underground metal mines
Correlation survey and depth measurement in underground metal mines
 

Recently uploaded

Kisan Call Centre - To harness potential of ICT in Agriculture by answer farm...
Kisan Call Centre - To harness potential of ICT in Agriculture by answer farm...Kisan Call Centre - To harness potential of ICT in Agriculture by answer farm...
Kisan Call Centre - To harness potential of ICT in Agriculture by answer farm...Krashi Coaching
 
call girls in Kamla Market (DELHI) 🔝 >༒9953330565🔝 genuine Escort Service 🔝✔️✔️
call girls in Kamla Market (DELHI) 🔝 >༒9953330565🔝 genuine Escort Service 🔝✔️✔️call girls in Kamla Market (DELHI) 🔝 >༒9953330565🔝 genuine Escort Service 🔝✔️✔️
call girls in Kamla Market (DELHI) 🔝 >༒9953330565🔝 genuine Escort Service 🔝✔️✔️9953056974 Low Rate Call Girls In Saket, Delhi NCR
 
ECONOMIC CONTEXT - LONG FORM TV DRAMA - PPT
ECONOMIC CONTEXT - LONG FORM TV DRAMA - PPTECONOMIC CONTEXT - LONG FORM TV DRAMA - PPT
ECONOMIC CONTEXT - LONG FORM TV DRAMA - PPTiammrhaywood
 
POINT- BIOCHEMISTRY SEM 2 ENZYMES UNIT 5.pptx
POINT- BIOCHEMISTRY SEM 2 ENZYMES UNIT 5.pptxPOINT- BIOCHEMISTRY SEM 2 ENZYMES UNIT 5.pptx
POINT- BIOCHEMISTRY SEM 2 ENZYMES UNIT 5.pptxSayali Powar
 
SOCIAL AND HISTORICAL CONTEXT - LFTVD.pptx
SOCIAL AND HISTORICAL CONTEXT - LFTVD.pptxSOCIAL AND HISTORICAL CONTEXT - LFTVD.pptx
SOCIAL AND HISTORICAL CONTEXT - LFTVD.pptxiammrhaywood
 
The basics of sentences session 2pptx copy.pptx
The basics of sentences session 2pptx copy.pptxThe basics of sentences session 2pptx copy.pptx
The basics of sentences session 2pptx copy.pptxheathfieldcps1
 
mini mental status format.docx
mini    mental       status     format.docxmini    mental       status     format.docx
mini mental status format.docxPoojaSen20
 
18-04-UA_REPORT_MEDIALITERAСY_INDEX-DM_23-1-final-eng.pdf
18-04-UA_REPORT_MEDIALITERAСY_INDEX-DM_23-1-final-eng.pdf18-04-UA_REPORT_MEDIALITERAСY_INDEX-DM_23-1-final-eng.pdf
18-04-UA_REPORT_MEDIALITERAСY_INDEX-DM_23-1-final-eng.pdfssuser54595a
 
Hybridoma Technology ( Production , Purification , and Application )
Hybridoma Technology  ( Production , Purification , and Application  ) Hybridoma Technology  ( Production , Purification , and Application  )
Hybridoma Technology ( Production , Purification , and Application ) Sakshi Ghasle
 
Introduction to AI in Higher Education_draft.pptx
Introduction to AI in Higher Education_draft.pptxIntroduction to AI in Higher Education_draft.pptx
Introduction to AI in Higher Education_draft.pptxpboyjonauth
 
Separation of Lanthanides/ Lanthanides and Actinides
Separation of Lanthanides/ Lanthanides and ActinidesSeparation of Lanthanides/ Lanthanides and Actinides
Separation of Lanthanides/ Lanthanides and ActinidesFatimaKhan178732
 
“Oh GOSH! Reflecting on Hackteria's Collaborative Practices in a Global Do-It...
“Oh GOSH! Reflecting on Hackteria's Collaborative Practices in a Global Do-It...“Oh GOSH! Reflecting on Hackteria's Collaborative Practices in a Global Do-It...
“Oh GOSH! Reflecting on Hackteria's Collaborative Practices in a Global Do-It...Marc Dusseiller Dusjagr
 
Presiding Officer Training module 2024 lok sabha elections
Presiding Officer Training module 2024 lok sabha electionsPresiding Officer Training module 2024 lok sabha elections
Presiding Officer Training module 2024 lok sabha electionsanshu789521
 
KSHARA STURA .pptx---KSHARA KARMA THERAPY (CAUSTIC THERAPY)————IMP.OF KSHARA ...
KSHARA STURA .pptx---KSHARA KARMA THERAPY (CAUSTIC THERAPY)————IMP.OF KSHARA ...KSHARA STURA .pptx---KSHARA KARMA THERAPY (CAUSTIC THERAPY)————IMP.OF KSHARA ...
KSHARA STURA .pptx---KSHARA KARMA THERAPY (CAUSTIC THERAPY)————IMP.OF KSHARA ...M56BOOKSTORE PRODUCT/SERVICE
 
Call Girls in Dwarka Mor Delhi Contact Us 9654467111
Call Girls in Dwarka Mor Delhi Contact Us 9654467111Call Girls in Dwarka Mor Delhi Contact Us 9654467111
Call Girls in Dwarka Mor Delhi Contact Us 9654467111Sapana Sha
 
Accessible design: Minimum effort, maximum impact
Accessible design: Minimum effort, maximum impactAccessible design: Minimum effort, maximum impact
Accessible design: Minimum effort, maximum impactdawncurless
 
The Most Excellent Way | 1 Corinthians 13
The Most Excellent Way | 1 Corinthians 13The Most Excellent Way | 1 Corinthians 13
The Most Excellent Way | 1 Corinthians 13Steve Thomason
 

Recently uploaded (20)

Kisan Call Centre - To harness potential of ICT in Agriculture by answer farm...
Kisan Call Centre - To harness potential of ICT in Agriculture by answer farm...Kisan Call Centre - To harness potential of ICT in Agriculture by answer farm...
Kisan Call Centre - To harness potential of ICT in Agriculture by answer farm...
 
call girls in Kamla Market (DELHI) 🔝 >༒9953330565🔝 genuine Escort Service 🔝✔️✔️
call girls in Kamla Market (DELHI) 🔝 >༒9953330565🔝 genuine Escort Service 🔝✔️✔️call girls in Kamla Market (DELHI) 🔝 >༒9953330565🔝 genuine Escort Service 🔝✔️✔️
call girls in Kamla Market (DELHI) 🔝 >༒9953330565🔝 genuine Escort Service 🔝✔️✔️
 
ECONOMIC CONTEXT - LONG FORM TV DRAMA - PPT
ECONOMIC CONTEXT - LONG FORM TV DRAMA - PPTECONOMIC CONTEXT - LONG FORM TV DRAMA - PPT
ECONOMIC CONTEXT - LONG FORM TV DRAMA - PPT
 
Model Call Girl in Bikash Puri Delhi reach out to us at 🔝9953056974🔝
Model Call Girl in Bikash Puri  Delhi reach out to us at 🔝9953056974🔝Model Call Girl in Bikash Puri  Delhi reach out to us at 🔝9953056974🔝
Model Call Girl in Bikash Puri Delhi reach out to us at 🔝9953056974🔝
 
POINT- BIOCHEMISTRY SEM 2 ENZYMES UNIT 5.pptx
POINT- BIOCHEMISTRY SEM 2 ENZYMES UNIT 5.pptxPOINT- BIOCHEMISTRY SEM 2 ENZYMES UNIT 5.pptx
POINT- BIOCHEMISTRY SEM 2 ENZYMES UNIT 5.pptx
 
SOCIAL AND HISTORICAL CONTEXT - LFTVD.pptx
SOCIAL AND HISTORICAL CONTEXT - LFTVD.pptxSOCIAL AND HISTORICAL CONTEXT - LFTVD.pptx
SOCIAL AND HISTORICAL CONTEXT - LFTVD.pptx
 
The basics of sentences session 2pptx copy.pptx
The basics of sentences session 2pptx copy.pptxThe basics of sentences session 2pptx copy.pptx
The basics of sentences session 2pptx copy.pptx
 
mini mental status format.docx
mini    mental       status     format.docxmini    mental       status     format.docx
mini mental status format.docx
 
18-04-UA_REPORT_MEDIALITERAСY_INDEX-DM_23-1-final-eng.pdf
18-04-UA_REPORT_MEDIALITERAСY_INDEX-DM_23-1-final-eng.pdf18-04-UA_REPORT_MEDIALITERAСY_INDEX-DM_23-1-final-eng.pdf
18-04-UA_REPORT_MEDIALITERAСY_INDEX-DM_23-1-final-eng.pdf
 
Model Call Girl in Tilak Nagar Delhi reach out to us at 🔝9953056974🔝
Model Call Girl in Tilak Nagar Delhi reach out to us at 🔝9953056974🔝Model Call Girl in Tilak Nagar Delhi reach out to us at 🔝9953056974🔝
Model Call Girl in Tilak Nagar Delhi reach out to us at 🔝9953056974🔝
 
Hybridoma Technology ( Production , Purification , and Application )
Hybridoma Technology  ( Production , Purification , and Application  ) Hybridoma Technology  ( Production , Purification , and Application  )
Hybridoma Technology ( Production , Purification , and Application )
 
Introduction to AI in Higher Education_draft.pptx
Introduction to AI in Higher Education_draft.pptxIntroduction to AI in Higher Education_draft.pptx
Introduction to AI in Higher Education_draft.pptx
 
Separation of Lanthanides/ Lanthanides and Actinides
Separation of Lanthanides/ Lanthanides and ActinidesSeparation of Lanthanides/ Lanthanides and Actinides
Separation of Lanthanides/ Lanthanides and Actinides
 
“Oh GOSH! Reflecting on Hackteria's Collaborative Practices in a Global Do-It...
“Oh GOSH! Reflecting on Hackteria's Collaborative Practices in a Global Do-It...“Oh GOSH! Reflecting on Hackteria's Collaborative Practices in a Global Do-It...
“Oh GOSH! Reflecting on Hackteria's Collaborative Practices in a Global Do-It...
 
Presiding Officer Training module 2024 lok sabha elections
Presiding Officer Training module 2024 lok sabha electionsPresiding Officer Training module 2024 lok sabha elections
Presiding Officer Training module 2024 lok sabha elections
 
KSHARA STURA .pptx---KSHARA KARMA THERAPY (CAUSTIC THERAPY)————IMP.OF KSHARA ...
KSHARA STURA .pptx---KSHARA KARMA THERAPY (CAUSTIC THERAPY)————IMP.OF KSHARA ...KSHARA STURA .pptx---KSHARA KARMA THERAPY (CAUSTIC THERAPY)————IMP.OF KSHARA ...
KSHARA STURA .pptx---KSHARA KARMA THERAPY (CAUSTIC THERAPY)————IMP.OF KSHARA ...
 
Call Girls in Dwarka Mor Delhi Contact Us 9654467111
Call Girls in Dwarka Mor Delhi Contact Us 9654467111Call Girls in Dwarka Mor Delhi Contact Us 9654467111
Call Girls in Dwarka Mor Delhi Contact Us 9654467111
 
Accessible design: Minimum effort, maximum impact
Accessible design: Minimum effort, maximum impactAccessible design: Minimum effort, maximum impact
Accessible design: Minimum effort, maximum impact
 
The Most Excellent Way | 1 Corinthians 13
The Most Excellent Way | 1 Corinthians 13The Most Excellent Way | 1 Corinthians 13
The Most Excellent Way | 1 Corinthians 13
 
Staff of Color (SOC) Retention Efforts DDSD
Staff of Color (SOC) Retention Efforts DDSDStaff of Color (SOC) Retention Efforts DDSD
Staff of Color (SOC) Retention Efforts DDSD
 

Safety in mines

  • 1.
  • 2.
  • 3.  Mining is a hazardous profession associated with high level of accidents and injuries  According to the Directorate General of Mine Safety report of accident statistics, there were 117 & 101 fatalities and 509 & 52 serious injuries in the year of 2010 in coal & metalliferous mines  On an average, there are 83 & 49 fatal and 729 & 94 serious accidents in coal & Metalliferous mines, respectively over last Ten Years (2002-2011).  The average death rate per 1000 persons employed per year is around 0.26 & 0.42 and that of serious injury rate is around 1.95 & 0.74 in coal & Metalliferous mines, respectively.  Several causes starting from personal to sociotechnical factors are responsible for such high injury experience rates in mines
  • 4. Year-Wise Fatality and Serious Injury Rates per 1000 Persons Employed in Indian Coal Mines
  • 5. year coal oil coppe r Gold Iron Ore Lime Ston e Mang . ore Galen a & Sphl Total Metal All Minera ls 2002 0.23 0.09 0.30 0.00 0.30 0.52 0.29 0.22 0.45 0.28 2003 0.27 0.05 0.00 0.00 0.39 0.33 0.08 0.00 0.45 0.31 2004 0.24 0.10 0.00 0.00 0.34 0.52 0.21 0.79 0.43 0.28 2005 0.29 0.05 0.00 0.00 0.43 0.27 0.00 0.31 0.36 0.30 2006 0.36 0.29 0.00 0.32 0.51 0.59 0.15 0.31 0.47 0.38 2007 0.21 0.16 0.00 0.33 0.34 0.47 0.07 0.30 0.40 0.26 2008 0.25 0.25 0.38 0.00 0.25 0.32 0.30 1.22 0.43 0.30 2009 0.26 0.17 0.38 0.33 0.18 0.11 0.00 0.00 0.31 0.27 2010 0.32 0.17 0.00 0.00 0.27 0.25 0.15 0.31 0.65 0.40 2011 0.19 0.42 0.38 0.00 0.07 0.21 0.22 1.22 0.26 0.22 Trend in Death rate per thousand persons employed in Indian Mines for the Period 2002-2011
  • 6.
  • 7. Safety terms and definitions
  • 8.
  • 9.
  • 10. Unsafe Condition This is any condition, under the right set of condition, may create accident. Unsafe Behavior Unsafe This is the manner in which an individual conducts himself/herself that is unsafe to himself/herself or others.
  • 11. Hazards This is the source of energy and physiological and behavioral factors which, when uncontrolled effectively, results in harmful occurrences. Safe This is protected against any possible hazards.
  • 12.
  • 13. Conveyors Hazards in Underground Coal Mine Geological disturbance Inadequate ventilation Explosives and fires Occupational hazards Inrushes of water Transport systems Deficiency of management commitment Personal and social hazards Strata and roof control Dyke Fold Fault Temperatur e Irrespirable atmosphere Respirable dust Humid atmosphere Explosive atmosphe re Flammable dust Explosives Spontaneous combustion Haulage or locomotive Shafts Free-steered vehicles Lifting Machines Noise Contact with electricity Slip and fall A Inadequate training Inadequate supply and maintenance of equipment Inadequate supervision of work place before and during work Absenteeism of supervisor(s) at night shift work
  • 14. A Personal attitude Demographic Societal characteristics Age Experience OccupationSex Management worker interaction Supervisor worker interaction Co-workers relationships Risk taking Negative affectivity Depression Impulsiveness Unsafe work behavior Job dissatisfaction Job stress
  • 15.
  • 16.
  • 17. Fatal: Which results in death of one or more person Serious: Which results in serious bodily injury to one or more person. Serious bodily injury is defined as an injury which involve the permanent loss of any part of the body or permanent loss of or injury to the sight or hearing or any permanent in capacity or fractures of any bone or joints. Reportable: Which results in reportable injury to one or more person. Reportable injury is defined as any injury other than a serious bodily injury which involves the enforced absence of the injured person from work for a period of 72 hours or more.
  • 18. Minor: Which results in minor injury to one or more person. Minor injury is defined as any injury other than a serious bodily injury which involves the enforced absence of the injured person from work for a period exceeding 24 hours but, less than 72 hours.
  • 20.
  • 21. Sl. No Dates of Accident Name of Mines Fatalities Cause 1 12/07/1952 Dhemomain 12 Roof fall 2 05/08/1953 Majri 11 Inundation 3 14/03/1954 Damra 10 Explosion of fire damp. 4 10/12/1954 Newton Chikli 63 Inundation 5 05/02/1955 Amlabad 52 Explosion of fire damp. 6 26/09/1956 Burra Dhemo 28 Inundation 7 19/02/1958 Chinakuri 175 Explosion of fire damp. 8 20/02/1958 Central Bhowra 23 Inundation 9 05/01/1960 Damua 16 Inundation 10 28/05/1965 Dhori 268 Coal dust explosion 11 11/04/1968 West Chirmiri 14 Premature collapse of workings 12 18/03/1973 Jitpur 48 Explosion of fire damp. 13 08/08/1975 Kessurgarh 11 Roof fall 14 18/11/1975 Silewara 10 Inundation 15 27/12/1975 Chasnala 375 Inundation Major Accidents in the Indian Coal Mines (Post Independence period)
  • 22. 16 16/09/1976 Central Saunda 10 Inundation 17 04/10/1976 Sudamdih 43 Explosion of fire damp. 18 22/01/1979 Baragolai 16 Ignition of fire damp 19 24/08/1981 Jagannath 10 Water gas explosion 20 16/07/1982 Topa 16 Roof fall 21 14/09/1983 Hurriladih 19 Inundation 22 13/11/1989 Mahabir 6 Inundation 23 25/01/1994 New Kenda 55 Fire/suffocation by gases 24 26/09/1995 Gaslitand 64 Inundation 25 06/07/1999 Prascole 6 Fall of roof/collapse of workings 26 24/06/2000 Kawadi 10 Failure of OC bench 27 02/02/2001 Bagdigi 29 Inundation 28 05/03/2001 Durgapur Rayatwari 6 Collapse of partings/workings 29 16/06/2003 Godavari Khani-7LEP 17 Inundation 30 16/10/2003 GDK-8A 10 Roof fall 31 15/6/2005 Central Saunda 14 Inundation Major Accidents in the Indian Coal Mines (Post Independence period)
  • 23. Trends of Fatal and Serious Accidents in Coal Mines in India Year Fatal accidents Serious accidents Accidents Fatalities Accidents Injuries 1995 137 219 757 813 1996 131 146 677 723 1997 143 165 677 725 1998 128 146 523 560 1999 127 138 595 650 2000 117 144 661 707 2001 106 141 667 720 2002 81 97 629 650 2003 83 113 563 578 2004 90 99 599 608 Average per year 114 141 635 673 Note: (i) Lignite is included in coal.
  • 24.
  • 25.
  • 26.
  • 27.
  • 28.
  • 29.
  • 30.
  • 31.
  • 32.
  • 33. The usual practice is to calculate the death rates and injury rates on the basis of: i. 1000 persons employed ii. 3-lakh manshift worked iii. Million ton of coal produced
  • 34. To calculate the frequency rates per 1000 persons employed, it is necessary to know the actual figures of average daily employment in mines. Frequency rate (FR) for fatal, serious and reportable injuries can be calculated as follows: No of fatal injuries FR/Fatal = ------------------------------------  1000 Average daily employment No of serious injuries FR/Serious = -------------------------------------  1000 Average daily employment No of Reportable injuries FR/Reportable = -------------------------------------  1000 Average daily employment
  • 35. Frequency Rate (FR) per 3 lakh manshift worked can be calculated as below: No of injuries FR/ 3 lakh Manshift worked = -------------------------------  3,00,000 Total Manshift worked No of injuries FR/ Million ton per of coal produced =--------------------------  106 Total coal produced
  • 36. One basis of measurement of safety performance is the frequency of accidents, another is their severity. Severity rate can be calculated as follows: Mandays lost  1000 Severity = ------------------------------------ Average daily employment Mandays lost  300000 Or = ------------------------------------- Total Manshift worked Mandays lost  106 Or = ------------------------------------- Million ton of coal produced
  • 37. Severity Index:----- Severity Index (SI) can be calculated based on following formula: (300F + 10S + R)  100,000 SI = --------------------------------------- Man-shift worked F = Number of deaths S = Number of serious injuries R = Number of Reportable injuries The weightage of 300:10:1 for fatal, serious, and reportable injuries was perhaps arrived at by estimating relative manshift lost by each type of accidents. A modified approach has been established by the DGMS and is as follows: (50F + S )  105 SI = ---------------------------- Man-shift worked
  • 38. Accident Proneness:----- Though FR and SI values can be taken to identify accident proneness of mines; however, it is preferable to compute Arithmetic mean (AM) and Geometric mean (GM) of SI usually for five years periods to identify accident prone mines. The DGMS uses the arithmetic mean for identifying the accident proneness. Accident proneness indices are defined as follows: n AM =  SI/n i=1 n GM = (  SI )1/n i=1
  • 39. Both frequency rate and severity rate indices are useful measures of safety performances of mines. These indices generally are used to identify the accident proneness of mines and based on these indices accident proneness of the same mine may vary. To incorporate both frequency and severity rate, a combined index (CI) has been proposed, where CI is defined as: FR  SI CI = -------------------- 1000 where, CI = Combined Index FR = Frequency Rate Index SI = Severity Index
  • 40. Average Yearly Fatal/Serious Injuries in Indian Mines Place of employment Average daily employment Average number persons killed per year Average number persons seriously injured per year Below ground 2,58,000 110 493 Opencast workings 75,000 18 71 Above ground 1,35,000 13 109 Total 4,68,000 141 673 Calculate the Frequency Rates, Severity Index as per DGMS, and Combine index of Coal Mine Accidents in India.
  • 41.
  • 42. Basis Causes of Accident Occurrence
  • 43.
  • 44.
  • 45.
  • 46.
  • 47. Statistical accident/Injury analysis Methods of Statistical accident/Injury Analysis Bivariate analysis Multivariate analysis
  • 48. Statistical accident/Injury analysis Statistical accident/Injury analysis Place-wise Cause-wise Occupation-wise Body parts-wise Shift-wise
  • 49. Statistical accident/Injury analysis Place-wise analysis based on Belowground Opencast aboveground Shift-wise analysis based on Morning Shift Evening Shift Night Shift
  • 50. Statistical accident/Injury analysis Cause-wise analysis based on Fall-of-Object Fall-of-Roof Fall-of-Side Haulage Loading-of-Coal Slip-and-Fall Tools-and-Machines Transportation of Machine Others
  • 51. Statistical accident/Injury analysis Body parts-wise analysis based on leg Finger Back Hand Knee Thumb Foot Head Others
  • 52. Statistical accident/Injury analysis Occupation-wise analysis based on Fall-of-Object Fall-of-Roof Fall-of-Side Haulage Loading-of-Coal Slip-and-Fall Tools-and-Machines Transportation of Machine Others
  • 53. Statistical Accident Analysis – A Case Study By Dr. P. S. Paul (Published in IM&E Journal, 2001)
  • 54. Frequency of mandays lost due to accidents/injuries for the case study mine during 1993-’96. Mandays lost (day/days) Frequency Percent 1 2 3-5 5-15 >15 19 93 30 61 32 8.09 39.57 12.77 25.96 13.62 Mandays lost/injury Mininmum: 1 Maximum: 172 Average: 10.51 Total mandays lost: 2533
  • 55. Occupation/ job title Frequency Percent Mandays lost Mandays lost per injury Minimum mandays lost Maximum mandays lost Total mandays lost Miner/ Loader 100 41.49 1 172 1230 12.30 Haulage- Worker 28 11.61 1 79 243 8.67 Piece-rated- worker 27 11.20 2 114 298 11.04 Mech./elec.- fitter/helper 18 7.47 1 75 183 10.17 Support- personnel 17 7.05 2 150 180 10.59 Other-face- worker 10 4.15 1 33 99 9.90 Driller/exp. -carrier 5 2.07 1 2 12 2.40 Supervisory- staff 4 1.66 2 3 13 3.25 Other-worker 32 13.28 1 56 275 8.89 Frequency of injuries and mandays lost based on occupation/job title for the case study mine during 1993-‘96
  • 56. Cause of injury/ accident type Frequency Percent Mandays lost Mandays lost per injury Minimum mandays lost Maximum mandays lost Total mandays lost Fall-of-object 24 9.96 1 150 386 16.08 Fall-of-roof 20 8.30 2 144 379 18.95 Fall-of-side 10 4.15 2 96 199 19.90 Haulage 26 10.79 1 23 166 6.38 Loading-of-coal 53 21.99 1 114 557 9.94 Slip-and-fall 41 17.01 1 172 406 9.90 Tool-and- machine 33 13.69 1 44 230 6.97 Transport-of- material 12 4.98 1 19 82 6.83 Other 22 9.13 1 25 127 5.77 Frequency of injuries and mandays lost based on cause of injury/accident type for the case study mine during 1993-‘96
  • 57. Frequency of injury based on occupation and cause of injury and their cross-tabulation for the case study mine during 1993-’96 Cause of Injury Occupation Group Fall of Fall of Fall of Haulage Loading Slip Tool Transport Other object roof side of coal and and of materials fall machine Miner/loader Haulage- worker Piece-rated-worker Mech./Eeec.- fitter/helper Support –personnel Other-face- worker Driller/exp.- carrier Supervisory-staff Other- worker 8 12 7 4 48 12 3 1 5 (8.00) (12.00) (7.0) (4.00) (48.00) (12.00) (3.00) (1.00) (5.00) 3 1 0 7 0 7 7 3 0 (10.71) (3.58) (0.00) (25.00) (0.00) (25.00) (25.00) (10.71) (0.00) 0 0 0 4 0 3 11 5 4 (0.00) (0.00) (0.00) (14.82) (0.00) (11.11) (40.73) (18.52) (14.82) 2 0 0 5 0 4 6 0 1 (11.11) (0.00) (0.00) (27.78) (0.00) (22.22) (33.33) (0.00) (5.56) 6 1 0 3 3 3 0 1 0 (35.29) (5.88) (0.00) (17.65) (17.65) (17.65) (0.00) (5.88) (0.00) 2 3 0 0 0 2 2 0 1 (20.00) (30.00) (0.00) (0.00) (0.00) (20.00) (20.00) (0.00) (10.00) 1 0 0 1 0 1 1 0 1 (20.00) (0.00) (0.00) (20.00) (0.00) (20.00) (20.00) (0.00) (20.00) 0 1 0 0 0 3 0 0 0 (0.00) (25.00) (0.00) (0.00) (0.00) (75.00) (0.00) (0.00) (0.00) 2 2 3 2 2 6 3 2 10 (6.25) (6.25) (9.38) (6.25) (6.25) (18.76) (9.38) (6.25) (31.25) Figures in the brackets indicate the percentage of injuries
  • 58. Body part Frequency Percent Mandays lost Mandays lost per injury Minimum mandays lost Maximum mandays lost Total mandays lost Leg 83 34.44 1 172 1264 15.23 Finger 56 23.24 1 33 265 4.73 Hand 20 8.30 1 73 242 12.10 Back 17 7.05 1 114 282 16.59 Knee 14 5.81 1 13 61 4.36 Thumb 10 4.15 2 18 51 5.1 Foot 8 3.32 1 96 208 26 Head 7 2.91 2 3 15 2.14 All other 26 10.79 1 44 145 5.58 Frequency of injuries and mandays lost based on body parts injured for the case study mine during 1993-‘96
  • 59. Frequency of injury based on body parts injured and cause of injury and their cross-tabulation for the case study mine during 1993- ’96 Cause of Injury Body part Fall of Fall of Fall of Haulage Loading Slip Tool Transport Other object roof side of coal and and of material fall machine Leg Finger Hand Back Knee Thumb Foot Head All other 8 8 5 7 27 14 5 3 6 (9.63) (9.63) (6.02) (8.54) (32.93) (17.07) (6.09) (3.66) (7.32) 3 2 1 8 13 1 16 7 5 (5.36) (3.57) (1.79) (14.29) (23.21) (1.79) (28.56) (12.50) (8.93) 0 2 0 6 1 6 3 0 2 (0.00) (10.00) (0.00) (30.00) (5.00) (30.00) (15.00) (0.00) (10.00) 4 2 1 1 3 2 1 0 3 (23.53) (11.77) (5.88) (5.88) (17.64) (11.76) (5.88) (0.00) (17.65) 2 0 1 3 0 4 1 0 3 (14.289) (0.00) (7.14) (21.43) (0.00) (28.57) (7.14) (0.00) (21.43) 3 0 0 1 3 2 1 0 0 (30.00) (0.00) (0.00) (10.00) (30.00) (20.00) (10.00) (0.00) (0.00) 1 3 2 0 0 1 1 0 0 (12.50) (37.50) (25.00) (0.00) (0.00) (12.50) (12.50) (0.00) (0.00) 0 2 0 0 1 2 0 1 1 (0.00) (33.33) (0.00) (0.00) (16.67) (33.33) (0.00) (16.67) (14.29) 3 1 0 0 5 9 5 1 2 (11.54) (3.85) (0.00) (0.00) (19.23) (34.62) (19.23) (3.84) (7.69) Figures in the brackets indicate the percentage of injuries
  • 60.
  • 61.
  • 62. Chapter - 5 Investigations into Accident and Accident Report
  • 63. Investigations into Accident (Part-I) The primary purpose of accident investigation is to identify the causes and circumstances leading to the accident so that suitable measures may be taken to further accident of similar type.
  • 64. a successful accident investigation must answer three questions: 1. What happened? 2. How it happened? 3. Why it happened? and to serve as a basis of prevention, a fourth question: 4. How it can be prevented?
  • 65. Procedure:  Collection of basic information  Inspection of the site of accident  Preparation of accident site plan by the surveyor  Examination of records, reports, plan etc.  Examination of materials, equipments etc. and their testing, if required.  Examination of Witness  Analysis of evidence: Identification of the unsafe acts and condition
  • 66.  Date and time of accident  Name, age, sex and nature of job of the victim  Details of Vocational training undergone by the victim  Place of accident  Apparent cause of accident  Details of the mine working and operations related to the accident  System of supervision and name of the supervisors
  • 67.  Observation of the minutest details at the accident site  All materials and objects found at the site should be noted  The position of the victim(s) and the eye-witness should be recorded  The enquiry officer should himself draw a sketch plan of the accident site showing all the details
  • 68. They should prepare an accident plan (R.F. of 100:1) showing all the details of the accident site
  • 69. A close examination relating to the accident is essential to ascertain: – The general system of work – Awareness of lurking dangers – Promptness in dealing with defects and dangers – Status of safety prevailing prior to the accident – Availability and effectiveness of supervision
  • 70. These should be examined by experts, and if necessary, be tested at a reliable laboratory
  • 71.  The witness should be examined in a definite sequence  The witness should be examined individually and separately  All eye-witness should be examined at the site of the accident  The inquiry officer should not disturb the emotional and verbose witness but allow them to speak  If conflicting statements are made by different witness, the should be re-examined
  • 72.  The inquiry officer should analyze systematically all the recorded evidence in the light of his own observations at the accident site.  He should point out the contraventions of the statutory provisions and should identify the unsafe acts and unsafe conditions that resulted in the accident
  • 74. The report should be detailed under the following heads: Introduction Background information Events prior to accident Occurrence of the accident Rescue and recovery Inspection and enquiry Analysis of evidence Causes of the accident Responsibility Recommendations
  • 75. As a safety officer, put up a report of enquiry and investigation into a fatal accident due to fall of roof in a depillaring area killing two loaders on spot. From : ---------------- , Safety Officer, ---------------- Colliery. Dated, 1st November, 2010 To The Manager, ----------------- Colliery, Sir, Ref. Your letter No. A/E – 235 dated 17.08.2008 I am submitting herewith a report on roof fall accident that occurred on 13th September, 2010 at about 8 p.m. in the depillaring district in ---------- seam at ------------ colliery and resulted in death of two loaders namely, -------------- and --------------. Encl. Inquiry Report. Yours faithfully, (Signed) ACCIDENT REPORT
  • 77. Chapter - 6 In-depth Study of Accidents due to Multivariate Cause (with case study)
  • 78. Work Injuries Demographics •Age •Experience Negative Personality •Impulsivity •Risk Taking •Negative Affectivity •Depression Social Support •Co-Worker Support •Supervisory Support •Management Worker Interaction Safety Environment •Safety Training •Safety practice •Safety Equipment Availability and Maintenance Work Hazards •Physical Hazards •Production Pressure Job Dissatisfaction Job Stress Safe Work Behavior Determinants of work injuries in mines
  • 79. Identified factors No. of questions asked to the mine workers No. of questions retained after reliability and validity test Reliability Risk taking Negative affectivity Job Dissatisfaction Impulsivity Depression Job stress Safety training Safety practice Safety equipment availability and maintenance Co- worker’s support Supervisory Support Management worker interaction Production pressure Physical hazards Safe work behavior 11 15 13 12 5 12 8 27 9 7 7 14 4 15 8 9 11 12 8 5 8 6 19 8 5 7 10 4 11 8 0.82 0.83 0.83 0.71 0.65 0.67 0.66 0.80 0.72 0.64 0.71 0.84 0.79 0.65 0.67 Reliability and Validity Test of the Collected Data
  • 80. Age 58 55 53 51 49 47 45 43 41 39 37 35 33 31 29 27 25 23 14 12 10 8 6 4 2 0 Group NAG AG Miners’ Age (in Year) Number of AG Respondents in excess of NAG Number of NAG Respondents in excess of AG High-Low Plots between AG and NAG Workers
  • 82. Job Di ssatiafacti on 36.00 34.00 32.00 30.00 28.00 26.00 24.00 22.00 20.00 18.00 16.00 14.00 12.00 20 10 0 Group NAG AG Respondents’ scores on Job Dissatisfaction High-Low Plots between AG and NAG Workers (Contd.)
  • 84. Management Worker Int eraction 30.00 28.00 26.00 24.00 22.00 20.00 18.00 16.00 14.00 12.00 10.00 30 20 10 0 Group NAG AG Respondents’ scores on Management Worker Interaction High-Low Plots between AG and NAG Workers (Contd.)
  • 85.
  • 86. Characteristic Variables Categories Coefficient β (estimate) P-Value (Significance) Crude OR e β (95% CI) Demographic Age AGE0RC -- 0.557 -- 0.019 1 1.74 (1.10-2.78)AGE1 Experience EXP0RC -- 0.51 -- 0.033 1 1.67 (1.04-2.67)EXP1 Negative Personality Impulsivity IMP0RC -- 0.956 -- <0.001 1 2.60 (1.63-4.15)IMP1 Negative Affectivity N_A0RC -- 1.24 -- <0.001 1 3.45 (2.15-5.55)N_A1 Risk Taking RISK_TK0RC -- 0.99 -- <0.001 1 2.70 (1.69-4.31)RISK_TK1 Depression DEPR0RC -- 0.48 -- 0.038 1 1.62 (1.03-2.56)DEPR1 Safe Work Behavior Safe Work Behavior SA_W_BEH0RC -- -0.65 -- 0.006 1 0.52 (0.33-0.83)SA_W_BEH1 Job Stress Job Stress JOB_STR0RC -- 0.76 -- 0.001 1 2.14 (1.35-3.41)JOB_STR1 Bivariate Odds of Injury to Workers for the Variables with Categories
  • 87. Characteristics Variables Categories Coefficient β (estimate) P-Value (Significance) Crude OR (e β) (95% CI) Job Dissatisfaction Job Dissatisfaction JOB_DIS0RC -- 0.95 -- <0.001 1 2.59 (1.63-4.12)JOB_DIS1 Work Hazards Production Pressure PROD_PR0RC -- 0.13 -- 0.56 1 1.14 (0.73-1.80)PROD_PR1 Physical Hazards PHY_HRZ0RC -- 0.87 -- <0.001 1 2.39 (1.50-3.79)PHYHRZ1 Safety Environment Safety Training SAF_TR0RC -- -0.52 -- 0.028 1 0.60 (0.38-0.95)SAF_TR1 Safety Practice SAF_PRC0RC -- -1.34 -- <0.001 1 0.32 (0.20-0.52)SAF_PRC1 Safety Equipment Availability and Maintenance SA_EQUP0RC -- -0.72 -- 0.002 1 0.49 (0.31-0.78)SA_EQUP1 Social Support Co-Worker Support CO_SPRT0RC -- -0.31 -- 0.195 1 0.74 (0.46-1.17)CO_SPRT1 Supervisory Support SUP_SPRT0RC -- -0.87 -- <0.001 1 0.42 (0.26-0.67)SUP_SPRT1 Management Worker Interaction M_W_INT0RC -- -0.95 -- <0.001 1 0.39 (0.24-0.62)M_W_INT1 Bivariate Odds of Injury to Workers for the Variables with Categories (Contd.)
  • 88. Predictor categoricala variables r Model 1 Model 2 Model 3 Model 4 Model 5 Model 6 Demographics Age Experience Negative personality Impulsivity Negative affectivity Depression Risk taking Safe work behavior Safe work behavior Job stress Job stress Job dissatisfaction Job dissatisfaction Work hazards Production pressure Physical hazards Safety environment Safety training Safety practice Safety equipment availability and maintenance Social support Co-worker support Supervisory support Management worker interaction Predictive accuracy (%) Total R2  R2 0.27*** 0.25*** 0.21*** 0.37*** 0.08 0.35*** -0.22*** 0.17*** 0.31*** 0.17*** 0.24*** -0.25*** -0.36*** -0.30*** -0.08 -0.27*** -0.29*** 0.41 0.19 56.7 0.026*** 0.026*** 0.75* 0.15 0.41 1.03*** -0.14 0.59** 67.3 0.189*** 0.163*** 0.77* 0.13 0.35 1.11*** -0.29 0.39 -0.34 -0.22 0.48* 69.3 0.206*** 0.017** 0.70* 0.22 0.40 0.92*** -0.09 0.41 -0.42 -0.25 0.48* 0.41 0.57** 69.3 0.228*** 0.022** 0.75* 0.15 0.50 0.90*** -0.16 0.38 -0.30 -0.12 0.55* 0.40 0.53* 0.46 -0.52 -0.24 68.3 0.241*** 0.013 0.76* 0.15 0.55 0.93*** -0.18 0.36 -0.26 -0.12 0.53* 0.39 0.52* 0.47 -0.48 0.27 0.19 0.14 -0.34 68.7 0.244*** 0.003 Note. For Models 1 – 6, standardized regression coefficients (β) are reported. * P < 0.10, ** P  0.05, *** P  0.01. a category (0) represents the reference group. For example, AGE (0) is the reference group of age variable. The parameter (β) for AGE (1) is estimated with reference to AGE (0). Multivariate Logistic Regression Results Predicting Work Injury
  • 89. Characteristic Variables Categories Coefficient β (estimate) P-Value (Significance Adjusted OR (e β) (95% CI) Demographic Age AGE0RC -- 0.76 -- 0.078 1 2.14 (0.91-4.10)AGE1 Experience EXP0RC -- 0.14 -- 0.732 1 1.16 (0.50-2.69) EXP1 Negative Personality Impulsivity IMP0RC -- 0.55 -- 0.168 1 1.73 (0.79-3.76) IMP1 Negative Affectivity N_A0RC -- 0.933 -- 0.014 1 2.54 (1.21-5.35) N_A1 Risk Taking RISK_TK0RC -- 0.36 -- 0.279 1 1.44 (0.75-2.76) RISK_TK1 Depression DEPR0RC -- -0.18 -- 0.566 1 0.83 (0.44-1.56) DEPR1 Safe Work Behavior Safe Work Behavior SA_W_BEH0RC -- -0.26 -- 0.428 1 0.78 (0.41-1.46) SA_W_BEH1 Job Stress Job Stress JOB_STR0RC -- -0.12 -- 0.772 1 0.89 (0.40-1.97)JOB_STR1 Multivariate Odds of Injury to Workers for the Variables with Categories
  • 90. Characteristics Variables Categories Coefficient β (estimate) P-Value (Significance) Adjusted OR (e β) (95% CI) Job Dissatisfaction Job Dissatisfaction JOB_DIS0RC -- 0.53 -- 0.092 1 1.71 (0.92-3.17)JOB_DIS1 Work Hazards Production Pressure PROD_PR0RC -- 0.39 -- 0.192 1 1.49 (0.83-2.68)PROD_PR1 Physical Hazards PHY_HRZ0RC -- 0.52 -- 0.073 1 1.69 (0.95-3.00)PHY_HRZ1 Safety Environment Safety Training SAF_TR0RC -- 0.47 -- 0.188 1 1.60 (0.80-3.22)SAF_TR1 Safety Practice SAF_PRC0RC -- -0.48 -- 0.239 1 0.62 (0.28-1.38)SAF_PRC1 Safety Equipment Availability & Maintenance SA_EQUP0RC -- 0.27 -- 0.483 1 1.30 (0.62-2.73)SA_EQUP1 Social Support Co-Worker Support CO_SPRT0RC -- 0.19 -- 0.545 1 1.21 (0.66-2.22)CO_SPRT1 Supervisory Support SUP_SPRT0RC -- 0.14 -- 0.729 1 1.15 (0.53-2.49)SUP_SPRT1 Management Worker Interaction M_W_INT0RC -- -0.34 -- 0.433 1 0.72 (0.31-1.65)M_W_INT1 Multivariate Odds of Injury to Workers for the Variables with Categories (Contd.)
  • 91. Age 1.000 Exp 0.816 1.000 Work injury 0.271 0.249 1.000 Impulsivity -0.143 -0.085 0.214 1.000 Negative affectivity -0.114 -0.078 0.373 0.600 1.000 Depression -0.046 -0.059 0.084 0.183 0.409 1.000 Risk taking -0.001 0.033 0.349 0.467 0.586 0.224 1.000 Safety training 0.074 0.060 -0.251 -0.577 -0.444 -0.112 -0.464 1.000 Safety practice 0.052 0.040 -0.358 -0.607 -0.521 -0.251 -0.668 0.523 1.000 SEAM* -0.024 -0.056 -0.296 -0.350 -0.404 -0.277 -0.557 0.344 0.653 1.000 Job stress -0.103 -0.054 0.169 0.630 0.672 0.375 0.568 -0.543 -0.600 -0.460 1.000 Co-worker support 0.118 0.087 -0.078 -0.456 -0.315 -0.084 -0.349 0.300 0.501 0.368 -0.375 1.000 Supervisory support 0.042 -0.001 -0.269 -0.600 -0.547 -0.285 -0.660 0.631 0.716 0.560 -0.660 0.357 1.000 M_W_INT** 0.053 0.012 -0.292 -0.588 -0.515 -0.295 -0.627 0.543 0.799 0.673 -0.659 0.451 0.817 1.000 Job dissatisfaction 0.001 0.026 0.306 0.386 0.475 0.347 0.524 -0.436 -0.573 -0.625 0.617 -0.215 -0.653 -0.665 1.000 Physical hazards 0.094 0.107 0.238 0.301 0.329 0.211 0.424 -0.200 -0.497 -0.514 0.455 -0.251 -0.465 -0.511 0.482 1.000 Production pressure 0.113 0.124 0.169 0.119 0.240 0.413 0.424 -0.293 -0.362 -0.385 0.398 -0.099 -0.542 -0.466 0.507 0.459 1.000 Safe work behaviour 0.055 0.010 -0.217 -0.368 -0.303 -0.362 -0.370 0.166 0.539 0.307 -0.258 0.361 0.396 0.387 -0.288 -0.172 -0.181 1.000 Mean 37.34 14.58 0.50 16.02 20.88 8.707 18.58 13.22 39.67 15.73 16.82 12.86 14.91 20.36 23.54 24.10 8.78 20.27 Standard deviation 9.01 9.25 0.50 4.12 5.95 2.55 5.41 3.27 7.53 3.93 3.99 2.18 3.68 5.44 6.16 4.36 2.82 2.99 * Safety Equipment availability and maintenance ** Management workers interaction Correlation coefficient  0.113 indicates 0.05 probability level of significance Correlations amongst the Major Variables for Accident Path Model
  • 92. Age X 1 Experience X 2 Demographic 1 Work Injury X 3 Work Injury 2 Impulsivity X 4 Negative affectivity X 5 Depression X 6 Risk Taking X 7 Negative Personality 3 Job Stress X 11 Co-Worker Support X 12 Supervisory Support X 13 Management Worker Interaction X 14 Safety Training X8 Safety Practice X 9 Safety equipment Availability and Maintenance X 10 Safety Environment 4 Job Stress 5 Job Dissatisfaction X 15 Physical Hazards X 16 Production Pressure X17 Safe Work Behavior X 18 Social Support 6 Job Dissatisfaction 7 Work Hazards 8 Safe Work Behavior 9 0.99* 0.82* 1.00 0.70* 0.72* 0.40* 0.78* 0.61* 0.85* 0.70* 1.00 0.48* 0.88* 0.90* 1.00 0.71* 0.65* 1.00 [* indicates 0.01 probability level of significance] Path Diagram of Measurement Model
  • 93. Demographic 1.00 Work injury 0.29* 1.00 Negative personality -0.10* 0.41* 1.00 Safety environment 0.04 -0.42* -0.94* 1.00 Job stress -0.09 0.17* 0.86* -0.73* 1.00 Social support 0.06 -0.30* -0.91* 0.83* -0.75* 1.00 Job dissatisfaction 0.01 0.31* 0.65* -0.75* 0.62* -0.70* 1.00 Work hazards 0.17* 0.30* 0.67* -0.77 * 0.63* -0.78* 0.73* 1.00 Safe work behavior 0.04 -0.22* -0.51* 0.49* -0.26* 0.48* -0.29* -0.26* 1.00 * indicates 0.01 probability level of significance Structural Correlations among Latent Variables Presented in the Measurement Model for Injury/Accident Causation
  • 94. Job Dissatisfaction 4 Work Injury 6 Safety Environment 1 Safe Work Behavior 5 Negative Personality 3 Job Stress 2 Work Hazards 1 Social Support 2 Demographic 3 -0.24* 0.69* -0.39* -0.65* -0.06 0.05 -0.02 -0.03 0.38* -0.25* -0.37* 0.37* -0.40* 0.08 -0.01 0.26* 0.29* -0.14* 0.08* 0.76* 0.87* 0.40* 0.22* 0.37* [* indicates 0.05 probability level of significance] Accident Model Path Diagram
  • 95. Chapter - 7 Measures for Improving Safety
  • 96. Chapter - 8 Cost of Accidents
  • 97.
  • 98.
  • 99. Risk This is a measure of the likelihood and severity of a negative effect to environment, equipment/property, or the health. The phase of evaluation is realized by estimating the probability of an unwanted event occurring (P) and the consequences of that event (D). Mathematically, Risk (R) = P x D The sign x expresses the function according to the kind of evaluation. It can be a matrix or product. The risk index, particularly when estimating human risk to safety and health may vary according to human exposure to specific sites or sources.