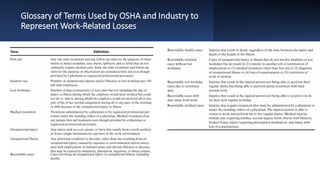
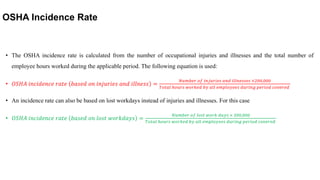
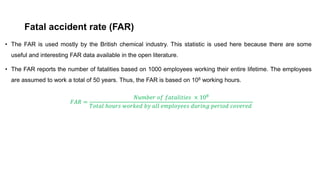
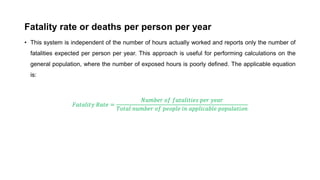
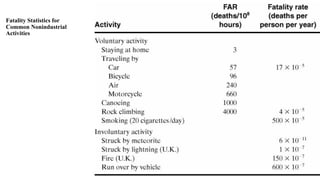
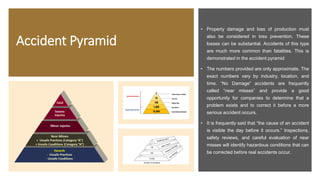
Process Safety Management
(ENCH 422)
Lecture 1
Introduction
•Chemical Engineering
• Chemical engineering involves planning and designing processes and
equipment for chemicals. Because many chemicals are hazardous
materials and many processes involve heat and flammable materials,
chemical engineering education includes some focus on safety.
• The professional organization in the United States is the American
Institute of Chemical Engineers (AIChE). It also operates the Center for
Chemical Process Safety (CCPS).
Safety, hazard, and
risk
• Safety or loss prevention: the prevention of accidents
using appropriate technologies to identify the hazards
of a chemical plant and eliminate them before an
accident occurs.
• Hazard: a chemical or physical condition that has the
potential to cause damage to people, property, or the
environment.
• Risk: a measure of human injury, environmental
damage, or economic loss in terms of both the incident
likelihood and the magnitude of the loss or injury.
Safety Programs
• A successful safety program requires
several ingredients, as shown in
Figure. These ingredients are
• System
• Attitude
• Fundamentals
• Experience
• Time
• You
Distinction between a good and an outstanding safety
program
• It is important to recognize the distinction between a good and an outstanding safety program.
• A good safety program identifies and eliminates existing safety hazards.
• An outstanding safety program has management systems that prevent the existence of safety
• hazards.
• A good safety program eliminates the existing hazards as they are identified, whereas an outstanding safety
program prevents the existence of a hazard in the first place.
• The commonly used management systems directed toward eliminating the existence of hazards include
safety reviews, safety audits, hazard identification techniques, checklists, and proper application of technical
knowledge.
American Institute of
Chemical Engineers
Code of Professional
Ethics or Engineering
Ethics
Accident
and Loss
Statistics
• Accident and loss statistics are important measures of the effectiveness of safety
programs. These statistics are valuable for determining whether a process is safe or
whether a safety procedure is working effectively.
• Many statistical methods are available to characterize accident and loss
performance. These statistics must be used carefully. Like most statistics they are
only averages and do not reflect the potential for single episodes involving
substantial losses. Unfortunately, no single method can measure all required
aspects. The three systems considered here are
• OSHA incidence rate, (OSHA stands for the Occupational Safety and Health
Administration of the United States government)
• Fatal accident rate (FAR)
• Fatality rate, or deaths per person per year
• Accidents – an unexpected event which results in serious injury or illness of an employee and may
also result in property damage.
• Near miss – a narrowly avoided accident.
• Incidents – an instance of something happening, an unexpected event or occurrence that doesn’t
result in serious injury or illness but may result in property damage.
Glossary of Terms Used by OSHA and Industry to
Represent Work-Related Losses
OSHA Incidence Rate
• The OSHA incidence rate is calculated from the number of occupational injuries and illnesses and the total number of
employee hours worked during the applicable period. The following equation is used:
• 𝑂𝑂𝑂𝑂𝑂𝑂𝑂𝑂 𝑖𝑖𝑖𝑖𝑖𝑖𝑖𝑖𝑖𝑖𝑖𝑖𝑖𝑖𝑖𝑖𝑖𝑖 𝑟𝑟𝑟𝑟𝑟𝑟𝑟𝑟 𝑏𝑏𝑏𝑏𝑏𝑏𝑏𝑏𝑏𝑏 𝑜𝑜𝑜𝑜 𝑖𝑖𝑖𝑖𝑖𝑖𝑖𝑖𝑖𝑖𝑖𝑖𝑖𝑖𝑖𝑖 𝑎𝑎𝑎𝑎𝑎𝑎 𝑖𝑖𝑖𝑖𝑖𝑖𝑖𝑖𝑖𝑖𝑖𝑖𝑖𝑖 =
𝑁𝑁𝑁𝑁𝑁𝑁𝑁𝑁𝑁𝑁𝑁𝑁 𝑜𝑜𝑜𝑜 𝑖𝑖𝑖𝑖𝑖𝑖𝑖𝑖𝑖𝑖𝑖𝑖𝑖𝑖𝑖𝑖 𝑎𝑎𝑎𝑎𝑎𝑎 𝑖𝑖𝑖𝑖𝑖𝑖𝑖𝑖𝑖𝑖𝑖𝑖𝑖𝑖𝑖𝑖𝑖𝑖 ×200,000
𝑇𝑇𝑇𝑇𝑇𝑇𝑇𝑇𝑇𝑇 ℎ𝑜𝑜𝑜𝑜𝑜𝑜𝑜𝑜 𝑤𝑤𝑤𝑤𝑤𝑤𝑤𝑤𝑤𝑤𝑤𝑤 𝑏𝑏𝑏𝑏 𝑎𝑎𝑎𝑎𝑎𝑎 𝑒𝑒𝑒𝑒𝑒𝑒𝑒𝑒𝑒𝑒𝑒𝑒𝑒𝑒𝑒𝑒𝑒𝑒 𝑑𝑑𝑑𝑑𝑑𝑑𝑑𝑑𝑑𝑑𝑑𝑑 𝑝𝑝𝑝𝑝𝑝𝑝𝑝𝑝𝑝𝑝𝑝𝑝 𝑐𝑐𝑐𝑐𝑐𝑐𝑐𝑐𝑐𝑐𝑐𝑐𝑐𝑐
• An incidence rate can also be based on lost workdays instead of injuries and illnesses. For this case
• 𝑂𝑂𝑂𝑂𝑂𝑂𝑂𝑂 𝑖𝑖𝑖𝑖𝑖𝑖𝑖𝑖𝑖𝑖𝑖𝑖𝑖𝑖𝑖𝑖𝑖𝑖 𝑟𝑟𝑟𝑟𝑟𝑟𝑟𝑟 𝑏𝑏𝑏𝑏𝑏𝑏𝑏𝑏𝑏𝑏 𝑜𝑜𝑜𝑜 𝑙𝑙𝑙𝑙𝑙𝑙𝑙𝑙 𝑤𝑤𝑤𝑤𝑤𝑤𝑤𝑤𝑤𝑤𝑤𝑤𝑤𝑤𝑤𝑤 =
𝑁𝑁𝑁𝑁𝑁𝑁𝑁𝑁𝑁𝑁𝑁𝑁 𝑜𝑜𝑜𝑜 𝑙𝑙𝑙𝑙𝑙𝑙𝑙𝑙 𝑤𝑤𝑤𝑤𝑤𝑤𝑤𝑤 𝑑𝑑𝑑𝑑𝑑𝑑𝑑𝑑 × 200,000
𝑇𝑇𝑇𝑇𝑇𝑇𝑇𝑇𝑇𝑇 ℎ𝑜𝑜𝑜𝑜𝑜𝑜𝑜𝑜 𝑤𝑤𝑤𝑤𝑤𝑤𝑤𝑤𝑤𝑤𝑤𝑤 𝑏𝑏𝑏𝑏 𝑎𝑎𝑎𝑎𝑎𝑎 𝑒𝑒𝑒𝑒𝑒𝑒𝑒𝑒𝑒𝑒𝑒𝑒𝑒𝑒𝑒𝑒𝑒𝑒 𝑑𝑑𝑑𝑑𝑑𝑑𝑑𝑑𝑑𝑑𝑑𝑑 𝑝𝑝𝑝𝑝𝑝𝑝𝑝𝑝𝑝𝑝𝑝𝑝 𝑐𝑐𝑐𝑐𝑐𝑐𝑐𝑐𝑐𝑐𝑐𝑐𝑐𝑐
Fatal accident rate (FAR)
• The FAR is used mostly by the British chemical industry. This statistic is used here because there are some
useful and interesting FAR data available in the open literature.
• The FAR reports the number of fatalities based on 1000 employees working their entire lifetime. The employees
are assumed to work a total of 50 years. Thus, the FAR is based on 108 working hours.
𝐹𝐹𝐹𝐹𝐹𝐹 =
𝑁𝑁𝑁𝑁𝑁𝑁𝑁𝑁𝑁𝑁𝑁𝑁 𝑜𝑜𝑜𝑜 𝑓𝑓𝑓𝑓𝑓𝑓𝑓𝑓𝑓𝑓𝑓𝑓𝑓𝑓𝑓𝑓𝑓𝑓𝑓𝑓 × 108
𝑇𝑇𝑇𝑇𝑇𝑇𝑇𝑇𝑇𝑇 ℎ𝑜𝑜𝑜𝑜𝑜𝑜𝑜𝑜 𝑤𝑤𝑤𝑤𝑤𝑤𝑤𝑤𝑤𝑤𝑤𝑤 𝑏𝑏𝑏𝑏 𝑎𝑎𝑎𝑎𝑎𝑎 𝑒𝑒𝑒𝑒𝑒𝑒𝑒𝑒𝑒𝑒𝑒𝑒𝑒𝑒𝑒𝑒𝑒𝑒 𝑑𝑑𝑑𝑑𝑑𝑑𝑑𝑑𝑑𝑑𝑑𝑑 𝑝𝑝𝑝𝑝𝑝𝑝𝑝𝑝𝑝𝑝𝑝𝑝 𝑐𝑐𝑐𝑐𝑐𝑐𝑐𝑐𝑐𝑐𝑐𝑐𝑐𝑐
Fatality rate or deaths per person per year
• This system is independent of the number of hours actually worked and reports only the number of
fatalities expected per person per year. This approach is useful for performing calculations on the
general population, where the number of exposed hours is poorly defined. The applicable equation
is:
𝐹𝐹𝐹𝐹𝐹𝐹𝐹𝐹𝐹𝐹𝐹𝐹𝐹𝐹𝐹𝐹 𝑅𝑅𝑅𝑅𝑅𝑅𝑅𝑅 =
𝑁𝑁𝑁𝑁𝑁𝑁𝑁𝑁𝑁𝑁𝑁𝑁 𝑜𝑜𝑜𝑜 𝑓𝑓𝑓𝑓𝑓𝑓𝑓𝑓𝑓𝑓𝑓𝑓𝑓𝑓𝑓𝑓𝑓𝑓𝑓𝑓 𝑝𝑝𝑝𝑝𝑝𝑝 𝑦𝑦𝑦𝑦𝑦𝑦𝑦𝑦
𝑇𝑇𝑇𝑇𝑇𝑇𝑇𝑇𝑇𝑇 𝑛𝑛𝑛𝑛𝑛𝑛𝑛𝑛𝑛𝑛𝑛𝑛 𝑜𝑜𝑜𝑜 𝑝𝑝𝑝𝑝𝑝𝑝𝑝𝑝𝑝𝑝𝑝𝑝 𝑖𝑖𝑖𝑖 𝑎𝑎𝑎𝑎𝑎𝑎𝑎𝑎𝑎𝑎𝑎𝑎𝑎𝑎𝑎𝑎𝑎𝑎𝑎𝑎 𝑝𝑝𝑝𝑝𝑝𝑝𝑝𝑝𝑝𝑝𝑝𝑝𝑝𝑝𝑝𝑝𝑝𝑝𝑝𝑝
Fatality Statistics for
Common Nonindustrial
Activities
Accident Pyramid
• Property damage and loss of production must
also be considered in loss prevention. These
losses can be substantial. Accidents of this type
are much more common than fatalities. This is
demonstrated in the accident pyramid
• The numbers provided are only approximate. The
exact numbers vary by industry, location, and
time. “No Damage” accidents are frequently
called “near misses” and provide a good
opportunity for companies to determine that a
problem exists and to correct it before a more
serious accident occurs.
• It is frequently said that “the cause of an accident
is visible the day before it occurs.” Inspections,
safety reviews, and careful evaluation of near
misses will identify hazardous conditions that can
be corrected before real accidents occur.
Activity
Example 1
• List six different products produced by chemical engineers that are of
significant benefit to mankind.
Solution
• Penicillin, gasoline, synthetic rubber, paper, plastic, concrete.
Inherent safety
• The following four words are recommended
to describe inherent safety:
• Minimize (intensification)
• Substitute (substitution)
• Moderate (attenuation and limitation of
effects)
• Simplify (simplification and error tolerance)
Example
• A company has 17 full-time employees and 3 part-time employees that each work 20 hours per week. This
equates to 28,400 labor hours each year. If the company experienced 2 recordable injuries, then what 𝑂𝑂𝑆𝑆𝐻𝐻𝐴𝐴
𝑖𝑖𝑛𝑛𝑐𝑐𝑖𝑖𝑑𝑑𝑒𝑒𝑛𝑛𝑐𝑐𝑒𝑒 𝑟𝑟𝑎𝑎𝑡𝑡𝑒𝑒?
𝑂𝑂𝑂𝑂𝑂𝑂𝑂𝑂 𝑖𝑖𝑖𝑖𝑖𝑖𝑖𝑖𝑖𝑖𝑖𝑖𝑖𝑖𝑖𝑖𝑖𝑖 𝑟𝑟𝑟𝑟𝑟𝑟𝑟𝑟 𝑏𝑏𝑏𝑏𝑏𝑏𝑏𝑏𝑏𝑏 𝑜𝑜𝑜𝑜 𝑖𝑖𝑖𝑖𝑖𝑖𝑖𝑖𝑖𝑖𝑖𝑖𝑖𝑖𝑖𝑖 𝑎𝑎𝑎𝑎𝑎𝑎 𝑖𝑖𝑖𝑖𝑖𝑖𝑖𝑖𝑖𝑖𝑖𝑖𝑖𝑖 =
𝑁𝑁𝑁𝑁𝑁𝑁𝑁𝑁𝑁𝑁𝑁𝑁 𝑜𝑜𝑜𝑜 𝑖𝑖𝑖𝑖𝑖𝑖𝑖𝑖𝑖𝑖𝑖𝑖𝑖𝑖𝑖𝑖 𝑎𝑎𝑎𝑎𝑎𝑎 𝑖𝑖𝑖𝑖𝑖𝑖𝑖𝑖𝑖𝑖𝑖𝑖𝑖𝑖𝑖𝑖𝑖𝑖 × 200,000
𝑇𝑇𝑇𝑇𝑇𝑇𝑇𝑇𝑇𝑇 ℎ𝑜𝑜𝑜𝑜𝑜𝑜𝑜𝑜 𝑤𝑤𝑤𝑤𝑤𝑤𝑤𝑤𝑤𝑤𝑤𝑤 𝑏𝑏𝑏𝑏 𝑎𝑎𝑎𝑎𝑎𝑎 𝑒𝑒𝑒𝑒𝑒𝑒𝑒𝑒𝑒𝑒𝑒𝑒𝑒𝑒𝑒𝑒𝑒𝑒 𝑑𝑑𝑑𝑑𝑑𝑑𝑑𝑑𝑑𝑑𝑑𝑑 𝑝𝑝𝑝𝑝𝑝𝑝𝑝𝑝𝑝𝑝𝑝𝑝 𝑐𝑐𝑐𝑐𝑐𝑐𝑐𝑐𝑐𝑐𝑐𝑐𝑐𝑐
𝑂𝑂𝑂𝑂𝑂𝑂𝑂𝑂 𝑖𝑖𝑖𝑖𝑖𝑖𝑖𝑖𝑖𝑖𝑖𝑖𝑖𝑖𝑖𝑖𝑖𝑖 𝑟𝑟𝑟𝑟𝑟𝑟𝑟𝑟 𝑏𝑏𝑏𝑏𝑏𝑏𝑏𝑏𝑏𝑏 𝑜𝑜𝑜𝑜 𝑖𝑖𝑖𝑖𝑖𝑖𝑖𝑖𝑖𝑖𝑖𝑖𝑖𝑖𝑖𝑖 𝑎𝑎𝑎𝑎𝑎𝑎 𝑖𝑖𝑖𝑖𝑖𝑖𝑖𝑖𝑖𝑖𝑖𝑖𝑖𝑖 =
2 × 200,000
28,400
𝑶𝑶𝑶𝑶𝑶𝑶𝑶𝑶 𝒊𝒊𝒊𝒊𝒊𝒊𝒊𝒊𝒊𝒊𝒊𝒊𝒊𝒊𝒊𝒊𝒊𝒊 𝒓𝒓𝒓𝒓𝒓𝒓𝒓𝒓 𝒃𝒃𝒃𝒃𝒃𝒃𝒃𝒃𝒃𝒃 𝒐𝒐𝒐𝒐 𝒊𝒊𝒊𝒊𝒊𝒊𝒊𝒊𝒊𝒊𝒊𝒊𝒊𝒊𝒊𝒊 𝒂𝒂𝒂𝒂𝒂𝒂 𝒊𝒊𝒊𝒊𝒊𝒊𝒊𝒊𝒊𝒊𝒊𝒊𝒊𝒊 = 14.08
What is now known is that for every 100 employees, 14.08 employees have been involved in a recordable injury or illness.
𝑂𝑂𝑂𝑂𝑂𝑂𝑂𝑂 𝑖𝑖𝑖𝑖𝑖𝑖𝑖𝑖𝑖𝑖𝑖𝑖𝑖𝑖𝑖𝑖𝑖𝑖 𝑟𝑟𝑟𝑟𝑟𝑟𝑟𝑟 𝑏𝑏𝑏𝑏𝑏𝑏𝑏𝑏𝑏𝑏 𝑜𝑜𝑜𝑜 𝑙𝑙𝑙𝑙𝑙𝑙𝑙𝑙 𝑤𝑤𝑤𝑤𝑤𝑤𝑤𝑤𝑤𝑤𝑤𝑤𝑤𝑤𝑤𝑤 =
𝑁𝑁𝑁𝑁𝑁𝑁𝑁𝑁𝑁𝑁𝑁𝑁 𝑜𝑜𝑜𝑜 𝑙𝑙𝑙𝑙𝑙𝑙𝑙𝑙 𝑤𝑤𝑤𝑤𝑤𝑤𝑤𝑤 𝑑𝑑𝑑𝑑𝑑𝑑𝑑𝑑 × 200,000
𝑇𝑇𝑇𝑇𝑇𝑇𝑇𝑇𝑇𝑇 ℎ𝑜𝑜𝑜𝑜𝑜𝑜𝑜𝑜 𝑤𝑤𝑤𝑤𝑤𝑤𝑤𝑤𝑤𝑤𝑤𝑤 𝑏𝑏𝑏𝑏 𝑎𝑎𝑎𝑎𝑎𝑎 𝑒𝑒𝑒𝑒𝑒𝑒𝑒𝑒𝑒𝑒𝑒𝑒𝑒𝑒𝑒𝑒𝑒𝑒 𝑑𝑑𝑑𝑑𝑑𝑑𝑑𝑑𝑑𝑑𝑑𝑑 𝑝𝑝𝑝𝑝𝑝𝑝𝑝𝑝𝑝𝑝𝑝𝑝 𝑐𝑐𝑐𝑐𝑐𝑐𝑐𝑐𝑐𝑐𝑐𝑐𝑐𝑐
• Using the previous company example and the broken-leg example used earlier, there were 5 lost days due to
the injury. The calculations would look like this:
𝑂𝑂𝑂𝑂𝑂𝑂𝑂𝑂 𝑖𝑖𝑖𝑖𝑖𝑖𝑖𝑖𝑖𝑖𝑖𝑖𝑖𝑖𝑖𝑖𝑖𝑖 𝑟𝑟𝑟𝑟𝑟𝑟𝑟𝑟 𝑏𝑏𝑏𝑏𝑏𝑏𝑏𝑏𝑏𝑏 𝑜𝑜𝑜𝑜 𝑙𝑙𝑙𝑙𝑙𝑙𝑙𝑙 𝑤𝑤𝑤𝑤𝑤𝑤𝑤𝑤𝑤𝑤𝑤𝑤𝑤𝑤𝑤𝑤 =
5 × 200,000
28,400
𝑶𝑶𝑶𝑶𝑶𝑶𝑶𝑶 𝒊𝒊𝒊𝒊𝒊𝒊𝒊𝒊𝒊𝒊𝒊𝒊𝒊𝒊𝒊𝒊𝒊𝒊 𝒓𝒓𝒓𝒓𝒓𝒓𝒓𝒓 𝒃𝒃𝒃𝒃𝒃𝒃𝒃𝒃𝒃𝒃 𝒐𝒐𝒐𝒐 𝒍𝒍𝒍𝒍𝒍𝒍𝒍𝒍 𝒘𝒘𝒘𝒘𝒘𝒘𝒘𝒘𝒘𝒘𝒘𝒘𝒘𝒘𝒘𝒘 = 35.21
• E. 2 A university has 1200 full-time employees and worked for 2.4 x 10⁶ per year. In a particular
year, this university had 38 reportable lost-time injuries with a resulting 274 lost workdays.
Compute the OSHA incidence rate based on injuries and lost workdays.
𝑂𝑂𝑂𝑂𝑂𝑂𝑂𝑂 𝑖𝑖𝑖𝑖𝑖𝑖𝑖𝑖𝑖𝑖𝑖𝑖𝑖𝑖𝑖𝑖𝑖𝑖 𝑟𝑟𝑟𝑟𝑟𝑟𝑟𝑟 𝑏𝑏𝑏𝑏𝑏𝑏𝑏𝑏𝑏𝑏 𝑜𝑜𝑜𝑜 𝑖𝑖𝑖𝑖𝑖𝑖𝑖𝑖𝑖𝑖𝑖𝑖𝑖𝑖𝑖𝑖 𝑎𝑎𝑎𝑎𝑎𝑎 𝑖𝑖𝑖𝑖𝑖𝑖𝑖𝑖𝑖𝑖𝑖𝑖𝑖𝑖 =
𝑁𝑁𝑁𝑁𝑁𝑁𝑁𝑁𝑁𝑁𝑁𝑁 𝑜𝑜𝑜𝑜 𝑖𝑖𝑖𝑖𝑖𝑖𝑖𝑖𝑖𝑖𝑖𝑖𝑖𝑖𝑖𝑖 𝑎𝑎𝑎𝑎𝑎𝑎 𝑖𝑖𝑖𝑖𝑖𝑖𝑖𝑖𝑖𝑖𝑖𝑖𝑖𝑖𝑖𝑖𝑖𝑖 × 200,000
𝑇𝑇𝑇𝑇𝑇𝑇𝑇𝑇𝑇𝑇 ℎ𝑜𝑜𝑜𝑜𝑜𝑜𝑜𝑜 𝑤𝑤𝑤𝑤𝑤𝑤𝑤𝑤𝑤𝑤𝑤𝑤 𝑏𝑏𝑏𝑏 𝑎𝑎𝑎𝑎𝑎𝑎 𝑒𝑒𝑒𝑒𝑒𝑒𝑒𝑒𝑒𝑒𝑒𝑒𝑒𝑒𝑒𝑒𝑒𝑒 𝑑𝑑𝑑𝑑𝑑𝑑𝑑𝑑𝑑𝑑𝑑𝑑 𝑝𝑝𝑝𝑝𝑝𝑝𝑝𝑝𝑝𝑝𝑝𝑝 𝑐𝑐𝑐𝑐𝑐𝑐𝑐𝑐𝑐𝑐𝑐𝑐𝑐𝑐
𝑂𝑂𝑂𝑂𝑂𝑂𝑂𝑂 𝑖𝑖𝑖𝑖𝑖𝑖𝑖𝑖𝑖𝑖𝑖𝑖𝑖𝑖𝑖𝑖𝑖𝑖 𝑟𝑟𝑟𝑟𝑟𝑟𝑟𝑟 𝑏𝑏𝑏𝑏𝑏𝑏𝑏𝑏𝑏𝑏 𝑜𝑜𝑜𝑜 𝑖𝑖𝑖𝑖𝑖𝑖𝑖𝑖𝑖𝑖𝑖𝑖𝑖𝑖𝑖𝑖 𝑎𝑎𝑎𝑎𝑎𝑎 𝑖𝑖𝑖𝑖𝑖𝑖𝑖𝑖𝑖𝑖𝑖𝑖𝑖𝑖 =
38 × 200,000
2.4 x 10⁶
𝑶𝑶𝑶𝑶𝑶𝑶𝑶𝑶 𝒊𝒊𝒊𝒊𝒊𝒊𝒊𝒊𝒊𝒊𝒊𝒊𝒊𝒊𝒊𝒊𝒊𝒊 𝒓𝒓𝒓𝒓𝒓𝒓𝒓𝒓 𝒃𝒃𝒃𝒃𝒃𝒃𝒃𝒃𝒃𝒃 𝒐𝒐𝒐𝒐 𝒊𝒊𝒊𝒊𝒊𝒊𝒊𝒊𝒊𝒊𝒊𝒊𝒊𝒊𝒊𝒊 𝒂𝒂𝒂𝒂𝒂𝒂 𝒊𝒊𝒊𝒊𝒊𝒊𝒊𝒊𝒊𝒊𝒊𝒊𝒊𝒊 = 3.17
𝑂𝑂𝑂𝑂𝑂𝑂𝑂𝑂 𝑖𝑖𝑖𝑖𝑖𝑖𝑖𝑖𝑖𝑖𝑖𝑖𝑖𝑖𝑖𝑖𝑖𝑖 𝑟𝑟𝑟𝑟𝑟𝑟𝑟𝑟 𝑏𝑏𝑏𝑏𝑏𝑏𝑏𝑏𝑏𝑏 𝑜𝑜𝑜𝑜 𝑙𝑙𝑙𝑙𝑙𝑙𝑙𝑙 𝑤𝑤𝑤𝑤𝑤𝑤𝑤𝑤𝑤𝑤𝑤𝑤𝑤𝑤𝑤𝑤 =
𝑁𝑁𝑁𝑁𝑁𝑁𝑁𝑁𝑁𝑁𝑁𝑁 𝑜𝑜𝑜𝑜 𝑙𝑙𝑙𝑙𝑙𝑙𝑙𝑙 𝑤𝑤𝑤𝑤𝑤𝑤𝑤𝑤 𝑑𝑑𝑑𝑑𝑑𝑑𝑑𝑑 × 200,000
𝑇𝑇𝑇𝑇𝑇𝑇𝑇𝑇𝑇𝑇 ℎ𝑜𝑜𝑜𝑜𝑜𝑜𝑜𝑜 𝑤𝑤𝑤𝑤𝑤𝑤𝑤𝑤𝑤𝑤𝑤𝑤 𝑏𝑏𝑏𝑏 𝑎𝑎𝑎𝑎𝑎𝑎 𝑒𝑒𝑒𝑒𝑒𝑒𝑒𝑒𝑒𝑒𝑒𝑒𝑒𝑒𝑒𝑒𝑒𝑒 𝑑𝑑𝑑𝑑𝑑𝑑𝑑𝑑𝑑𝑑𝑑𝑑 𝑝𝑝𝑝𝑝𝑝𝑝𝑝𝑝𝑝𝑝𝑝𝑝 𝑐𝑐𝑐𝑐𝑐𝑐𝑐𝑐𝑐𝑐𝑐𝑐𝑐𝑐
𝑂𝑂𝑂𝑂𝑂𝑂𝑂𝑂 𝑖𝑖𝑖𝑖𝑖𝑖𝑖𝑖𝑖𝑖𝑖𝑖𝑖𝑖𝑖𝑖𝑖𝑖 𝑟𝑟𝑟𝑟𝑟𝑟𝑟𝑟 𝑏𝑏𝑏𝑏𝑏𝑏𝑏𝑏𝑏𝑏 𝑜𝑜𝑜𝑜 𝑙𝑙𝑙𝑙𝑙𝑙𝑙𝑙 𝑤𝑤𝑤𝑤𝑤𝑤𝑤𝑤𝑤𝑤𝑤𝑤𝑤𝑤𝑤𝑤 =
274 × 200,000
2.4 x 10⁶
𝑶𝑶𝑶𝑶𝑶𝑶𝑶𝑶 𝒊𝒊𝒊𝒊𝒊𝒊𝒊𝒊𝒊𝒊𝒊𝒊𝒊𝒊𝒊𝒊𝒊𝒊 𝒓𝒓𝒓𝒓𝒓𝒓𝒓𝒓 𝒃𝒃𝒃𝒃𝒃𝒃𝒃𝒃𝒃𝒃 𝒐𝒐𝒐𝒐 𝒍𝒍𝒍𝒍𝒍𝒍𝒍𝒍 𝒘𝒘𝒘𝒘𝒘𝒘𝒘𝒘𝒘𝒘𝒘𝒘𝒘𝒘𝒘𝒘 = 22.8

lecture 1.pdf

  • 1.
  • 2.
    Introduction •Chemical Engineering • Chemicalengineering involves planning and designing processes and equipment for chemicals. Because many chemicals are hazardous materials and many processes involve heat and flammable materials, chemical engineering education includes some focus on safety. • The professional organization in the United States is the American Institute of Chemical Engineers (AIChE). It also operates the Center for Chemical Process Safety (CCPS).
  • 3.
    Safety, hazard, and risk •Safety or loss prevention: the prevention of accidents using appropriate technologies to identify the hazards of a chemical plant and eliminate them before an accident occurs. • Hazard: a chemical or physical condition that has the potential to cause damage to people, property, or the environment. • Risk: a measure of human injury, environmental damage, or economic loss in terms of both the incident likelihood and the magnitude of the loss or injury.
  • 5.
    Safety Programs • Asuccessful safety program requires several ingredients, as shown in Figure. These ingredients are • System • Attitude • Fundamentals • Experience • Time • You
  • 6.
    Distinction between agood and an outstanding safety program • It is important to recognize the distinction between a good and an outstanding safety program. • A good safety program identifies and eliminates existing safety hazards. • An outstanding safety program has management systems that prevent the existence of safety • hazards. • A good safety program eliminates the existing hazards as they are identified, whereas an outstanding safety program prevents the existence of a hazard in the first place. • The commonly used management systems directed toward eliminating the existence of hazards include safety reviews, safety audits, hazard identification techniques, checklists, and proper application of technical knowledge.
  • 7.
    American Institute of ChemicalEngineers Code of Professional Ethics or Engineering Ethics
  • 8.
    Accident and Loss Statistics • Accidentand loss statistics are important measures of the effectiveness of safety programs. These statistics are valuable for determining whether a process is safe or whether a safety procedure is working effectively. • Many statistical methods are available to characterize accident and loss performance. These statistics must be used carefully. Like most statistics they are only averages and do not reflect the potential for single episodes involving substantial losses. Unfortunately, no single method can measure all required aspects. The three systems considered here are • OSHA incidence rate, (OSHA stands for the Occupational Safety and Health Administration of the United States government) • Fatal accident rate (FAR) • Fatality rate, or deaths per person per year
  • 9.
    • Accidents –an unexpected event which results in serious injury or illness of an employee and may also result in property damage. • Near miss – a narrowly avoided accident. • Incidents – an instance of something happening, an unexpected event or occurrence that doesn’t result in serious injury or illness but may result in property damage.
  • 10.
    Glossary of TermsUsed by OSHA and Industry to Represent Work-Related Losses
  • 11.
    OSHA Incidence Rate •The OSHA incidence rate is calculated from the number of occupational injuries and illnesses and the total number of employee hours worked during the applicable period. The following equation is used: • 𝑂𝑂𝑂𝑂𝑂𝑂𝑂𝑂 𝑖𝑖𝑖𝑖𝑖𝑖𝑖𝑖𝑖𝑖𝑖𝑖𝑖𝑖𝑖𝑖𝑖𝑖 𝑟𝑟𝑟𝑟𝑟𝑟𝑟𝑟 𝑏𝑏𝑏𝑏𝑏𝑏𝑏𝑏𝑏𝑏 𝑜𝑜𝑜𝑜 𝑖𝑖𝑖𝑖𝑖𝑖𝑖𝑖𝑖𝑖𝑖𝑖𝑖𝑖𝑖𝑖 𝑎𝑎𝑎𝑎𝑎𝑎 𝑖𝑖𝑖𝑖𝑖𝑖𝑖𝑖𝑖𝑖𝑖𝑖𝑖𝑖 = 𝑁𝑁𝑁𝑁𝑁𝑁𝑁𝑁𝑁𝑁𝑁𝑁 𝑜𝑜𝑜𝑜 𝑖𝑖𝑖𝑖𝑖𝑖𝑖𝑖𝑖𝑖𝑖𝑖𝑖𝑖𝑖𝑖 𝑎𝑎𝑎𝑎𝑎𝑎 𝑖𝑖𝑖𝑖𝑖𝑖𝑖𝑖𝑖𝑖𝑖𝑖𝑖𝑖𝑖𝑖𝑖𝑖 ×200,000 𝑇𝑇𝑇𝑇𝑇𝑇𝑇𝑇𝑇𝑇 ℎ𝑜𝑜𝑜𝑜𝑜𝑜𝑜𝑜 𝑤𝑤𝑤𝑤𝑤𝑤𝑤𝑤𝑤𝑤𝑤𝑤 𝑏𝑏𝑏𝑏 𝑎𝑎𝑎𝑎𝑎𝑎 𝑒𝑒𝑒𝑒𝑒𝑒𝑒𝑒𝑒𝑒𝑒𝑒𝑒𝑒𝑒𝑒𝑒𝑒 𝑑𝑑𝑑𝑑𝑑𝑑𝑑𝑑𝑑𝑑𝑑𝑑 𝑝𝑝𝑝𝑝𝑝𝑝𝑝𝑝𝑝𝑝𝑝𝑝 𝑐𝑐𝑐𝑐𝑐𝑐𝑐𝑐𝑐𝑐𝑐𝑐𝑐𝑐 • An incidence rate can also be based on lost workdays instead of injuries and illnesses. For this case • 𝑂𝑂𝑂𝑂𝑂𝑂𝑂𝑂 𝑖𝑖𝑖𝑖𝑖𝑖𝑖𝑖𝑖𝑖𝑖𝑖𝑖𝑖𝑖𝑖𝑖𝑖 𝑟𝑟𝑟𝑟𝑟𝑟𝑟𝑟 𝑏𝑏𝑏𝑏𝑏𝑏𝑏𝑏𝑏𝑏 𝑜𝑜𝑜𝑜 𝑙𝑙𝑙𝑙𝑙𝑙𝑙𝑙 𝑤𝑤𝑤𝑤𝑤𝑤𝑤𝑤𝑤𝑤𝑤𝑤𝑤𝑤𝑤𝑤 = 𝑁𝑁𝑁𝑁𝑁𝑁𝑁𝑁𝑁𝑁𝑁𝑁 𝑜𝑜𝑜𝑜 𝑙𝑙𝑙𝑙𝑙𝑙𝑙𝑙 𝑤𝑤𝑤𝑤𝑤𝑤𝑤𝑤 𝑑𝑑𝑑𝑑𝑑𝑑𝑑𝑑 × 200,000 𝑇𝑇𝑇𝑇𝑇𝑇𝑇𝑇𝑇𝑇 ℎ𝑜𝑜𝑜𝑜𝑜𝑜𝑜𝑜 𝑤𝑤𝑤𝑤𝑤𝑤𝑤𝑤𝑤𝑤𝑤𝑤 𝑏𝑏𝑏𝑏 𝑎𝑎𝑎𝑎𝑎𝑎 𝑒𝑒𝑒𝑒𝑒𝑒𝑒𝑒𝑒𝑒𝑒𝑒𝑒𝑒𝑒𝑒𝑒𝑒 𝑑𝑑𝑑𝑑𝑑𝑑𝑑𝑑𝑑𝑑𝑑𝑑 𝑝𝑝𝑝𝑝𝑝𝑝𝑝𝑝𝑝𝑝𝑝𝑝 𝑐𝑐𝑐𝑐𝑐𝑐𝑐𝑐𝑐𝑐𝑐𝑐𝑐𝑐
  • 12.
    Fatal accident rate(FAR) • The FAR is used mostly by the British chemical industry. This statistic is used here because there are some useful and interesting FAR data available in the open literature. • The FAR reports the number of fatalities based on 1000 employees working their entire lifetime. The employees are assumed to work a total of 50 years. Thus, the FAR is based on 108 working hours. 𝐹𝐹𝐹𝐹𝐹𝐹 = 𝑁𝑁𝑁𝑁𝑁𝑁𝑁𝑁𝑁𝑁𝑁𝑁 𝑜𝑜𝑜𝑜 𝑓𝑓𝑓𝑓𝑓𝑓𝑓𝑓𝑓𝑓𝑓𝑓𝑓𝑓𝑓𝑓𝑓𝑓𝑓𝑓 × 108 𝑇𝑇𝑇𝑇𝑇𝑇𝑇𝑇𝑇𝑇 ℎ𝑜𝑜𝑜𝑜𝑜𝑜𝑜𝑜 𝑤𝑤𝑤𝑤𝑤𝑤𝑤𝑤𝑤𝑤𝑤𝑤 𝑏𝑏𝑏𝑏 𝑎𝑎𝑎𝑎𝑎𝑎 𝑒𝑒𝑒𝑒𝑒𝑒𝑒𝑒𝑒𝑒𝑒𝑒𝑒𝑒𝑒𝑒𝑒𝑒 𝑑𝑑𝑑𝑑𝑑𝑑𝑑𝑑𝑑𝑑𝑑𝑑 𝑝𝑝𝑝𝑝𝑝𝑝𝑝𝑝𝑝𝑝𝑝𝑝 𝑐𝑐𝑐𝑐𝑐𝑐𝑐𝑐𝑐𝑐𝑐𝑐𝑐𝑐
  • 13.
    Fatality rate ordeaths per person per year • This system is independent of the number of hours actually worked and reports only the number of fatalities expected per person per year. This approach is useful for performing calculations on the general population, where the number of exposed hours is poorly defined. The applicable equation is: 𝐹𝐹𝐹𝐹𝐹𝐹𝐹𝐹𝐹𝐹𝐹𝐹𝐹𝐹𝐹𝐹 𝑅𝑅𝑅𝑅𝑅𝑅𝑅𝑅 = 𝑁𝑁𝑁𝑁𝑁𝑁𝑁𝑁𝑁𝑁𝑁𝑁 𝑜𝑜𝑜𝑜 𝑓𝑓𝑓𝑓𝑓𝑓𝑓𝑓𝑓𝑓𝑓𝑓𝑓𝑓𝑓𝑓𝑓𝑓𝑓𝑓 𝑝𝑝𝑝𝑝𝑝𝑝 𝑦𝑦𝑦𝑦𝑦𝑦𝑦𝑦 𝑇𝑇𝑇𝑇𝑇𝑇𝑇𝑇𝑇𝑇 𝑛𝑛𝑛𝑛𝑛𝑛𝑛𝑛𝑛𝑛𝑛𝑛 𝑜𝑜𝑜𝑜 𝑝𝑝𝑝𝑝𝑝𝑝𝑝𝑝𝑝𝑝𝑝𝑝 𝑖𝑖𝑖𝑖 𝑎𝑎𝑎𝑎𝑎𝑎𝑎𝑎𝑎𝑎𝑎𝑎𝑎𝑎𝑎𝑎𝑎𝑎𝑎𝑎 𝑝𝑝𝑝𝑝𝑝𝑝𝑝𝑝𝑝𝑝𝑝𝑝𝑝𝑝𝑝𝑝𝑝𝑝𝑝𝑝
  • 14.
    Fatality Statistics for CommonNonindustrial Activities
  • 15.
    Accident Pyramid • Propertydamage and loss of production must also be considered in loss prevention. These losses can be substantial. Accidents of this type are much more common than fatalities. This is demonstrated in the accident pyramid • The numbers provided are only approximate. The exact numbers vary by industry, location, and time. “No Damage” accidents are frequently called “near misses” and provide a good opportunity for companies to determine that a problem exists and to correct it before a more serious accident occurs. • It is frequently said that “the cause of an accident is visible the day before it occurs.” Inspections, safety reviews, and careful evaluation of near misses will identify hazardous conditions that can be corrected before real accidents occur.
  • 16.
    Activity Example 1 • Listsix different products produced by chemical engineers that are of significant benefit to mankind. Solution • Penicillin, gasoline, synthetic rubber, paper, plastic, concrete.
  • 17.
    Inherent safety • Thefollowing four words are recommended to describe inherent safety: • Minimize (intensification) • Substitute (substitution) • Moderate (attenuation and limitation of effects) • Simplify (simplification and error tolerance)
  • 18.
    Example • A companyhas 17 full-time employees and 3 part-time employees that each work 20 hours per week. This equates to 28,400 labor hours each year. If the company experienced 2 recordable injuries, then what 𝑂𝑂𝑆𝑆𝐻𝐻𝐴𝐴 𝑖𝑖𝑛𝑛𝑐𝑐𝑖𝑖𝑑𝑑𝑒𝑒𝑛𝑛𝑐𝑐𝑒𝑒 𝑟𝑟𝑎𝑎𝑡𝑡𝑒𝑒? 𝑂𝑂𝑂𝑂𝑂𝑂𝑂𝑂 𝑖𝑖𝑖𝑖𝑖𝑖𝑖𝑖𝑖𝑖𝑖𝑖𝑖𝑖𝑖𝑖𝑖𝑖 𝑟𝑟𝑟𝑟𝑟𝑟𝑟𝑟 𝑏𝑏𝑏𝑏𝑏𝑏𝑏𝑏𝑏𝑏 𝑜𝑜𝑜𝑜 𝑖𝑖𝑖𝑖𝑖𝑖𝑖𝑖𝑖𝑖𝑖𝑖𝑖𝑖𝑖𝑖 𝑎𝑎𝑎𝑎𝑎𝑎 𝑖𝑖𝑖𝑖𝑖𝑖𝑖𝑖𝑖𝑖𝑖𝑖𝑖𝑖 = 𝑁𝑁𝑁𝑁𝑁𝑁𝑁𝑁𝑁𝑁𝑁𝑁 𝑜𝑜𝑜𝑜 𝑖𝑖𝑖𝑖𝑖𝑖𝑖𝑖𝑖𝑖𝑖𝑖𝑖𝑖𝑖𝑖 𝑎𝑎𝑎𝑎𝑎𝑎 𝑖𝑖𝑖𝑖𝑖𝑖𝑖𝑖𝑖𝑖𝑖𝑖𝑖𝑖𝑖𝑖𝑖𝑖 × 200,000 𝑇𝑇𝑇𝑇𝑇𝑇𝑇𝑇𝑇𝑇 ℎ𝑜𝑜𝑜𝑜𝑜𝑜𝑜𝑜 𝑤𝑤𝑤𝑤𝑤𝑤𝑤𝑤𝑤𝑤𝑤𝑤 𝑏𝑏𝑏𝑏 𝑎𝑎𝑎𝑎𝑎𝑎 𝑒𝑒𝑒𝑒𝑒𝑒𝑒𝑒𝑒𝑒𝑒𝑒𝑒𝑒𝑒𝑒𝑒𝑒 𝑑𝑑𝑑𝑑𝑑𝑑𝑑𝑑𝑑𝑑𝑑𝑑 𝑝𝑝𝑝𝑝𝑝𝑝𝑝𝑝𝑝𝑝𝑝𝑝 𝑐𝑐𝑐𝑐𝑐𝑐𝑐𝑐𝑐𝑐𝑐𝑐𝑐𝑐 𝑂𝑂𝑂𝑂𝑂𝑂𝑂𝑂 𝑖𝑖𝑖𝑖𝑖𝑖𝑖𝑖𝑖𝑖𝑖𝑖𝑖𝑖𝑖𝑖𝑖𝑖 𝑟𝑟𝑟𝑟𝑟𝑟𝑟𝑟 𝑏𝑏𝑏𝑏𝑏𝑏𝑏𝑏𝑏𝑏 𝑜𝑜𝑜𝑜 𝑖𝑖𝑖𝑖𝑖𝑖𝑖𝑖𝑖𝑖𝑖𝑖𝑖𝑖𝑖𝑖 𝑎𝑎𝑎𝑎𝑎𝑎 𝑖𝑖𝑖𝑖𝑖𝑖𝑖𝑖𝑖𝑖𝑖𝑖𝑖𝑖 = 2 × 200,000 28,400 𝑶𝑶𝑶𝑶𝑶𝑶𝑶𝑶 𝒊𝒊𝒊𝒊𝒊𝒊𝒊𝒊𝒊𝒊𝒊𝒊𝒊𝒊𝒊𝒊𝒊𝒊 𝒓𝒓𝒓𝒓𝒓𝒓𝒓𝒓 𝒃𝒃𝒃𝒃𝒃𝒃𝒃𝒃𝒃𝒃 𝒐𝒐𝒐𝒐 𝒊𝒊𝒊𝒊𝒊𝒊𝒊𝒊𝒊𝒊𝒊𝒊𝒊𝒊𝒊𝒊 𝒂𝒂𝒂𝒂𝒂𝒂 𝒊𝒊𝒊𝒊𝒊𝒊𝒊𝒊𝒊𝒊𝒊𝒊𝒊𝒊 = 14.08 What is now known is that for every 100 employees, 14.08 employees have been involved in a recordable injury or illness. 𝑂𝑂𝑂𝑂𝑂𝑂𝑂𝑂 𝑖𝑖𝑖𝑖𝑖𝑖𝑖𝑖𝑖𝑖𝑖𝑖𝑖𝑖𝑖𝑖𝑖𝑖 𝑟𝑟𝑟𝑟𝑟𝑟𝑟𝑟 𝑏𝑏𝑏𝑏𝑏𝑏𝑏𝑏𝑏𝑏 𝑜𝑜𝑜𝑜 𝑙𝑙𝑙𝑙𝑙𝑙𝑙𝑙 𝑤𝑤𝑤𝑤𝑤𝑤𝑤𝑤𝑤𝑤𝑤𝑤𝑤𝑤𝑤𝑤 = 𝑁𝑁𝑁𝑁𝑁𝑁𝑁𝑁𝑁𝑁𝑁𝑁 𝑜𝑜𝑜𝑜 𝑙𝑙𝑙𝑙𝑙𝑙𝑙𝑙 𝑤𝑤𝑤𝑤𝑤𝑤𝑤𝑤 𝑑𝑑𝑑𝑑𝑑𝑑𝑑𝑑 × 200,000 𝑇𝑇𝑇𝑇𝑇𝑇𝑇𝑇𝑇𝑇 ℎ𝑜𝑜𝑜𝑜𝑜𝑜𝑜𝑜 𝑤𝑤𝑤𝑤𝑤𝑤𝑤𝑤𝑤𝑤𝑤𝑤 𝑏𝑏𝑏𝑏 𝑎𝑎𝑎𝑎𝑎𝑎 𝑒𝑒𝑒𝑒𝑒𝑒𝑒𝑒𝑒𝑒𝑒𝑒𝑒𝑒𝑒𝑒𝑒𝑒 𝑑𝑑𝑑𝑑𝑑𝑑𝑑𝑑𝑑𝑑𝑑𝑑 𝑝𝑝𝑝𝑝𝑝𝑝𝑝𝑝𝑝𝑝𝑝𝑝 𝑐𝑐𝑐𝑐𝑐𝑐𝑐𝑐𝑐𝑐𝑐𝑐𝑐𝑐 • Using the previous company example and the broken-leg example used earlier, there were 5 lost days due to the injury. The calculations would look like this: 𝑂𝑂𝑂𝑂𝑂𝑂𝑂𝑂 𝑖𝑖𝑖𝑖𝑖𝑖𝑖𝑖𝑖𝑖𝑖𝑖𝑖𝑖𝑖𝑖𝑖𝑖 𝑟𝑟𝑟𝑟𝑟𝑟𝑟𝑟 𝑏𝑏𝑏𝑏𝑏𝑏𝑏𝑏𝑏𝑏 𝑜𝑜𝑜𝑜 𝑙𝑙𝑙𝑙𝑙𝑙𝑙𝑙 𝑤𝑤𝑤𝑤𝑤𝑤𝑤𝑤𝑤𝑤𝑤𝑤𝑤𝑤𝑤𝑤 = 5 × 200,000 28,400 𝑶𝑶𝑶𝑶𝑶𝑶𝑶𝑶 𝒊𝒊𝒊𝒊𝒊𝒊𝒊𝒊𝒊𝒊𝒊𝒊𝒊𝒊𝒊𝒊𝒊𝒊 𝒓𝒓𝒓𝒓𝒓𝒓𝒓𝒓 𝒃𝒃𝒃𝒃𝒃𝒃𝒃𝒃𝒃𝒃 𝒐𝒐𝒐𝒐 𝒍𝒍𝒍𝒍𝒍𝒍𝒍𝒍 𝒘𝒘𝒘𝒘𝒘𝒘𝒘𝒘𝒘𝒘𝒘𝒘𝒘𝒘𝒘𝒘 = 35.21
  • 19.
    • E. 2A university has 1200 full-time employees and worked for 2.4 x 10⁶ per year. In a particular year, this university had 38 reportable lost-time injuries with a resulting 274 lost workdays. Compute the OSHA incidence rate based on injuries and lost workdays. 𝑂𝑂𝑂𝑂𝑂𝑂𝑂𝑂 𝑖𝑖𝑖𝑖𝑖𝑖𝑖𝑖𝑖𝑖𝑖𝑖𝑖𝑖𝑖𝑖𝑖𝑖 𝑟𝑟𝑟𝑟𝑟𝑟𝑟𝑟 𝑏𝑏𝑏𝑏𝑏𝑏𝑏𝑏𝑏𝑏 𝑜𝑜𝑜𝑜 𝑖𝑖𝑖𝑖𝑖𝑖𝑖𝑖𝑖𝑖𝑖𝑖𝑖𝑖𝑖𝑖 𝑎𝑎𝑎𝑎𝑎𝑎 𝑖𝑖𝑖𝑖𝑖𝑖𝑖𝑖𝑖𝑖𝑖𝑖𝑖𝑖 = 𝑁𝑁𝑁𝑁𝑁𝑁𝑁𝑁𝑁𝑁𝑁𝑁 𝑜𝑜𝑜𝑜 𝑖𝑖𝑖𝑖𝑖𝑖𝑖𝑖𝑖𝑖𝑖𝑖𝑖𝑖𝑖𝑖 𝑎𝑎𝑎𝑎𝑎𝑎 𝑖𝑖𝑖𝑖𝑖𝑖𝑖𝑖𝑖𝑖𝑖𝑖𝑖𝑖𝑖𝑖𝑖𝑖 × 200,000 𝑇𝑇𝑇𝑇𝑇𝑇𝑇𝑇𝑇𝑇 ℎ𝑜𝑜𝑜𝑜𝑜𝑜𝑜𝑜 𝑤𝑤𝑤𝑤𝑤𝑤𝑤𝑤𝑤𝑤𝑤𝑤 𝑏𝑏𝑏𝑏 𝑎𝑎𝑎𝑎𝑎𝑎 𝑒𝑒𝑒𝑒𝑒𝑒𝑒𝑒𝑒𝑒𝑒𝑒𝑒𝑒𝑒𝑒𝑒𝑒 𝑑𝑑𝑑𝑑𝑑𝑑𝑑𝑑𝑑𝑑𝑑𝑑 𝑝𝑝𝑝𝑝𝑝𝑝𝑝𝑝𝑝𝑝𝑝𝑝 𝑐𝑐𝑐𝑐𝑐𝑐𝑐𝑐𝑐𝑐𝑐𝑐𝑐𝑐 𝑂𝑂𝑂𝑂𝑂𝑂𝑂𝑂 𝑖𝑖𝑖𝑖𝑖𝑖𝑖𝑖𝑖𝑖𝑖𝑖𝑖𝑖𝑖𝑖𝑖𝑖 𝑟𝑟𝑟𝑟𝑟𝑟𝑟𝑟 𝑏𝑏𝑏𝑏𝑏𝑏𝑏𝑏𝑏𝑏 𝑜𝑜𝑜𝑜 𝑖𝑖𝑖𝑖𝑖𝑖𝑖𝑖𝑖𝑖𝑖𝑖𝑖𝑖𝑖𝑖 𝑎𝑎𝑎𝑎𝑎𝑎 𝑖𝑖𝑖𝑖𝑖𝑖𝑖𝑖𝑖𝑖𝑖𝑖𝑖𝑖 = 38 × 200,000 2.4 x 10⁶ 𝑶𝑶𝑶𝑶𝑶𝑶𝑶𝑶 𝒊𝒊𝒊𝒊𝒊𝒊𝒊𝒊𝒊𝒊𝒊𝒊𝒊𝒊𝒊𝒊𝒊𝒊 𝒓𝒓𝒓𝒓𝒓𝒓𝒓𝒓 𝒃𝒃𝒃𝒃𝒃𝒃𝒃𝒃𝒃𝒃 𝒐𝒐𝒐𝒐 𝒊𝒊𝒊𝒊𝒊𝒊𝒊𝒊𝒊𝒊𝒊𝒊𝒊𝒊𝒊𝒊 𝒂𝒂𝒂𝒂𝒂𝒂 𝒊𝒊𝒊𝒊𝒊𝒊𝒊𝒊𝒊𝒊𝒊𝒊𝒊𝒊 = 3.17 𝑂𝑂𝑂𝑂𝑂𝑂𝑂𝑂 𝑖𝑖𝑖𝑖𝑖𝑖𝑖𝑖𝑖𝑖𝑖𝑖𝑖𝑖𝑖𝑖𝑖𝑖 𝑟𝑟𝑟𝑟𝑟𝑟𝑟𝑟 𝑏𝑏𝑏𝑏𝑏𝑏𝑏𝑏𝑏𝑏 𝑜𝑜𝑜𝑜 𝑙𝑙𝑙𝑙𝑙𝑙𝑙𝑙 𝑤𝑤𝑤𝑤𝑤𝑤𝑤𝑤𝑤𝑤𝑤𝑤𝑤𝑤𝑤𝑤 = 𝑁𝑁𝑁𝑁𝑁𝑁𝑁𝑁𝑁𝑁𝑁𝑁 𝑜𝑜𝑜𝑜 𝑙𝑙𝑙𝑙𝑙𝑙𝑙𝑙 𝑤𝑤𝑤𝑤𝑤𝑤𝑤𝑤 𝑑𝑑𝑑𝑑𝑑𝑑𝑑𝑑 × 200,000 𝑇𝑇𝑇𝑇𝑇𝑇𝑇𝑇𝑇𝑇 ℎ𝑜𝑜𝑜𝑜𝑜𝑜𝑜𝑜 𝑤𝑤𝑤𝑤𝑤𝑤𝑤𝑤𝑤𝑤𝑤𝑤 𝑏𝑏𝑏𝑏 𝑎𝑎𝑎𝑎𝑎𝑎 𝑒𝑒𝑒𝑒𝑒𝑒𝑒𝑒𝑒𝑒𝑒𝑒𝑒𝑒𝑒𝑒𝑒𝑒 𝑑𝑑𝑑𝑑𝑑𝑑𝑑𝑑𝑑𝑑𝑑𝑑 𝑝𝑝𝑝𝑝𝑝𝑝𝑝𝑝𝑝𝑝𝑝𝑝 𝑐𝑐𝑐𝑐𝑐𝑐𝑐𝑐𝑐𝑐𝑐𝑐𝑐𝑐 𝑂𝑂𝑂𝑂𝑂𝑂𝑂𝑂 𝑖𝑖𝑖𝑖𝑖𝑖𝑖𝑖𝑖𝑖𝑖𝑖𝑖𝑖𝑖𝑖𝑖𝑖 𝑟𝑟𝑟𝑟𝑟𝑟𝑟𝑟 𝑏𝑏𝑏𝑏𝑏𝑏𝑏𝑏𝑏𝑏 𝑜𝑜𝑜𝑜 𝑙𝑙𝑙𝑙𝑙𝑙𝑙𝑙 𝑤𝑤𝑤𝑤𝑤𝑤𝑤𝑤𝑤𝑤𝑤𝑤𝑤𝑤𝑤𝑤 = 274 × 200,000 2.4 x 10⁶ 𝑶𝑶𝑶𝑶𝑶𝑶𝑶𝑶 𝒊𝒊𝒊𝒊𝒊𝒊𝒊𝒊𝒊𝒊𝒊𝒊𝒊𝒊𝒊𝒊𝒊𝒊 𝒓𝒓𝒓𝒓𝒓𝒓𝒓𝒓 𝒃𝒃𝒃𝒃𝒃𝒃𝒃𝒃𝒃𝒃 𝒐𝒐𝒐𝒐 𝒍𝒍𝒍𝒍𝒍𝒍𝒍𝒍 𝒘𝒘𝒘𝒘𝒘𝒘𝒘𝒘𝒘𝒘𝒘𝒘𝒘𝒘𝒘𝒘 = 22.8