


![Difficulties of study
1. Time consuming lead to reduction of the validity of
source; there are few devices to gather the raw data.
2. The collaboration in the target survey [ Subjects may
give invalid information ]
3. The experience of subjects in BMIR life
4. Bias in the Data collecting process
5. Bias in Sampling Design.
6. The Error in evaluation process](https://image.slidesharecdn.com/researchpresentationkeynoteforweb-120408055007-phpapp01/85/Research-Presentation-keynote-not-yet-result-29-320.jpg)


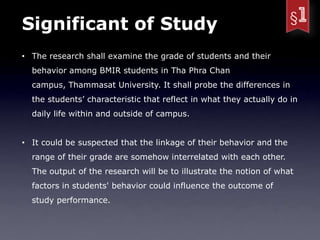
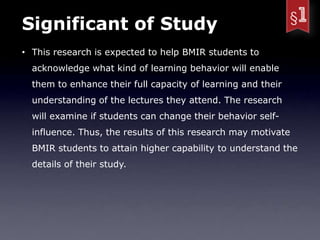
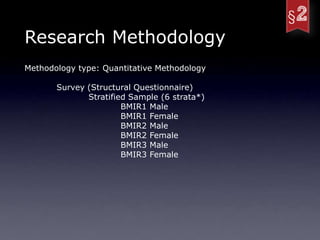
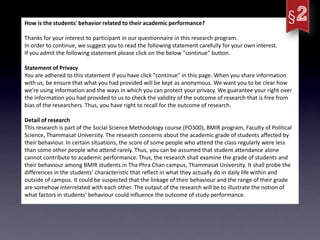
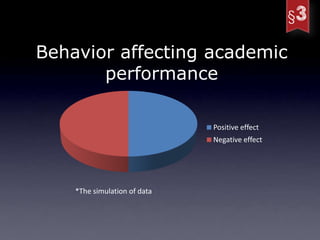
This document outlines a study investigating the relationship between student behavior and academic performance among BMIR students at Thammasat University. It discusses research questions, methodologies, and the significance of understanding behavioral factors that could influence educational outcomes. The study aims to illustrate how different behaviors affect academic scores, emphasizing the importance of variables like attendance, study time, and student-instructor interactions.