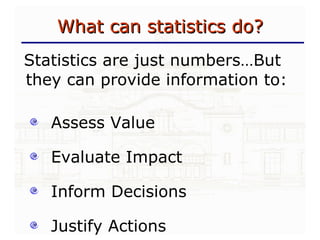
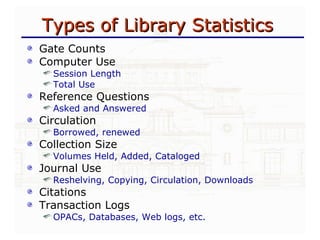
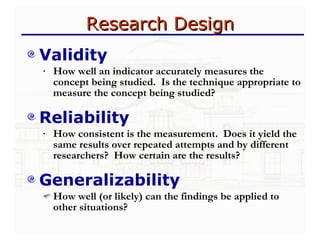
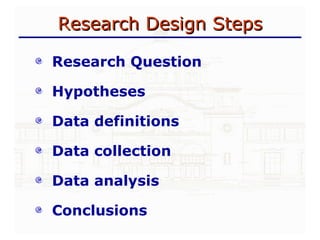
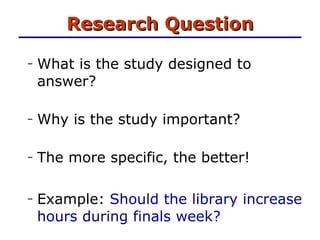
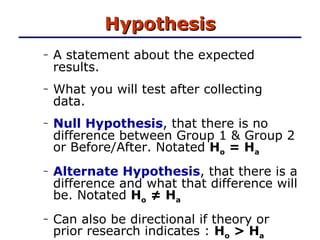
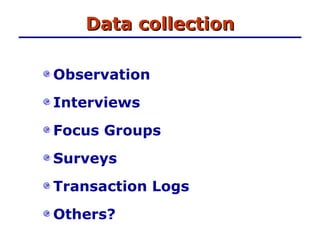
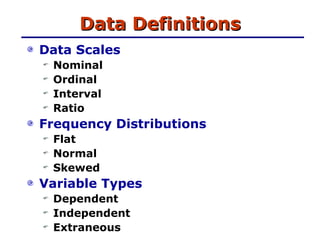
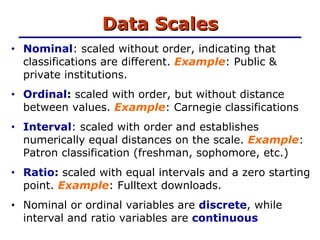
Statistics in Libraries How to use and evaluate statistical information in library research John McDonald Acquisitions Librarian Caltech
What can statistics do? Statistics are just numbers…But they can provide information to: Assess Value Evaluate Impact Inform Decisions Justify Actions
Types of Library Statistics Gate Counts Computer Use Session Length Total Use Reference Questions  Asked and Answered Circulation Borrowed, renewed Collection Size Volumes Held, Added, Cataloged Journal Use Reshelving, Copying, Circulation, Downloads Citations Transaction Logs OPACs, Databases, Web logs, etc.
Statistics Part I : Research Design Part II : Statistical Concepts Part III : Evaluating Library Statistics
Research Design Validity How well an indicator accurately measures the concept being studied.  Is the technique appropriate to measure the concept being studied? Reliability How consistent is the measurement.  Does it yield the same results over repeated attempts and by different researchers?  How certain are the results? Generalizability How well (or likely) can the findings be applied to other situations?
Research Design Steps Research Question Hypotheses Data definitions Data collection Data analysis  Conclusions
Research Question What is the study designed to answer? Why is the study important? The more specific, the better! Example:  Should the library increase hours during finals week?
Hypothesis A statement about the expected results. What you will test after collecting data. Null Hypothesis , that there is no difference between Group 1 & Group 2 or Before/After. Notated  H o  = H a Alternate Hypothesis , that there is a difference and what that difference will be. Notated  H o  ≠ H a   Can also be directional if theory or prior research indicates :  H o  > H a
Data collection Observation Interviews Focus Groups Surveys Transaction Logs Others?
Data Definitions Data Scales Nominal Ordinal Interval Ratio Frequency Distributions Flat Normal Skewed Variable Types Dependent Independent Extraneous
Data Scales Nominal : scaled without order, indicating that  classifications are different.  Example : Public & private institutions. Ordinal :  scaled with order, but without distance between values.  Example : Carnegie classifications Interval : scaled with order and establishes numerically equal distances on the scale.  Example : Patron classification (freshman, sophomore, etc.) Ratio :  scaled with equal intervals and a zero starting point.  Example : Fulltext downloads. Nominal or ordinal variables are  discrete , while interval and ratio variables are  continuous
Data Distributions Described by their kurtosis (variability) and skew (extremes) Non-normal  (skewed): extreme values with steep slopes Normal : bell shaped curve with gradual slopes
Variables Dependent:  the variable being measured, studied, and predicted. Independent :  variables that can be manipulated or theorized to be predictors of the dependent variable. Extraneous : variables other than the independent variables that can influence the dependent variable.
Data analysis Descriptive statistics Mean, Median, Mode Standard Deviation Correlational statistics Correlation Inferential statistics Chi-square Regression ANOVA
Review: Research Design Research Question What will the study answer? Hypotheses What do you think the results will be? Data definitions What scales are the variables, what is the distribution, and what are the dependent, independent & extraneous variables? Data collection What is the best method for collecting the variables of interest? Data analysis  What are the proper statistical tests to use on the data? Conclusions What does the data show us or indicate?
Case Studies Citation Analysis Antelman, K (2004) “Do Open-Access Articles Have a Greater Research Impact?”  College & Research Libraries News  65(5):pp. 372-382 Usage Analysis Blecic, DD (1999) “Measurements of journal use: an analysis of the correlations between three methods.” Bull Med Libr Assoc 87(1): 20-25. Service Analysis Nichols, J; Shaffer, B; Shockey, K. (2003). “Changing the Face of Instruction: Is Online or In-class More Effective?”  College & Research Libraries , 64:5: 378-389.
“ Changing the Face of Instruction…” Is an online tutorial as effective in teaching library instruction as a classroom setting? H3. Students will report as much or more satisfaction with online instruction as students taking traditional instruction. Research Question Hypotheses H1. Students will have higher scores in information literacy tests after library instruction. H2. Students will have the same or higher scores in info-lit tests after taking online tutorials as students taking traditional instruction.
“ Changing the Face of Instruction…” Variables: Test scores & survey results Data Collection: Pretest/Posttest & Survey Variables &  Data Collection Statistical Tests Conclusions Accept H1:  Instruction improves literacy.  Desc Stats incl. mean, standard deviation, standard error, T-tests (1 & 2 tailed) Accept H3 alternative hypothesis – Student satisfaction is equal with both methods. Accept H2 alternative hypothesis – Online has no significant difference from traditional.
Discussion Questions about developing Research Questions?  About Data Definitions, Data Collection, or Data Analysis? What Research Questions need to be answered at the College Library? Which of these can be analyzed using statistical methods?
My favorite statistic Baseball is 90% mental –  the other half is physical.

Statistics for Librarians: How to Use and Evaluate Statistical Evidence

  • 1.
    Statistics in LibrariesHow to use and evaluate statistical information in library research John McDonald Acquisitions Librarian Caltech
  • 2.
    What can statisticsdo? Statistics are just numbers…But they can provide information to: Assess Value Evaluate Impact Inform Decisions Justify Actions
  • 3.
    Types of LibraryStatistics Gate Counts Computer Use Session Length Total Use Reference Questions Asked and Answered Circulation Borrowed, renewed Collection Size Volumes Held, Added, Cataloged Journal Use Reshelving, Copying, Circulation, Downloads Citations Transaction Logs OPACs, Databases, Web logs, etc.
  • 4.
    Statistics Part I: Research Design Part II : Statistical Concepts Part III : Evaluating Library Statistics
  • 5.
    Research Design ValidityHow well an indicator accurately measures the concept being studied. Is the technique appropriate to measure the concept being studied? Reliability How consistent is the measurement. Does it yield the same results over repeated attempts and by different researchers? How certain are the results? Generalizability How well (or likely) can the findings be applied to other situations?
  • 6.
    Research Design StepsResearch Question Hypotheses Data definitions Data collection Data analysis Conclusions
  • 7.
    Research Question Whatis the study designed to answer? Why is the study important? The more specific, the better! Example: Should the library increase hours during finals week?
  • 8.
    Hypothesis A statementabout the expected results. What you will test after collecting data. Null Hypothesis , that there is no difference between Group 1 & Group 2 or Before/After. Notated H o = H a Alternate Hypothesis , that there is a difference and what that difference will be. Notated H o ≠ H a Can also be directional if theory or prior research indicates : H o > H a
  • 9.
    Data collection ObservationInterviews Focus Groups Surveys Transaction Logs Others?
  • 10.
    Data Definitions DataScales Nominal Ordinal Interval Ratio Frequency Distributions Flat Normal Skewed Variable Types Dependent Independent Extraneous
  • 11.
    Data Scales Nominal: scaled without order, indicating that classifications are different. Example : Public & private institutions. Ordinal : scaled with order, but without distance between values. Example : Carnegie classifications Interval : scaled with order and establishes numerically equal distances on the scale. Example : Patron classification (freshman, sophomore, etc.) Ratio : scaled with equal intervals and a zero starting point. Example : Fulltext downloads. Nominal or ordinal variables are discrete , while interval and ratio variables are continuous
  • 12.
    Data Distributions Describedby their kurtosis (variability) and skew (extremes) Non-normal (skewed): extreme values with steep slopes Normal : bell shaped curve with gradual slopes
  • 13.
    Variables Dependent: the variable being measured, studied, and predicted. Independent : variables that can be manipulated or theorized to be predictors of the dependent variable. Extraneous : variables other than the independent variables that can influence the dependent variable.
  • 14.
    Data analysis Descriptivestatistics Mean, Median, Mode Standard Deviation Correlational statistics Correlation Inferential statistics Chi-square Regression ANOVA
  • 15.
    Review: Research DesignResearch Question What will the study answer? Hypotheses What do you think the results will be? Data definitions What scales are the variables, what is the distribution, and what are the dependent, independent & extraneous variables? Data collection What is the best method for collecting the variables of interest? Data analysis What are the proper statistical tests to use on the data? Conclusions What does the data show us or indicate?
  • 16.
    Case Studies CitationAnalysis Antelman, K (2004) “Do Open-Access Articles Have a Greater Research Impact?” College & Research Libraries News 65(5):pp. 372-382 Usage Analysis Blecic, DD (1999) “Measurements of journal use: an analysis of the correlations between three methods.” Bull Med Libr Assoc 87(1): 20-25. Service Analysis Nichols, J; Shaffer, B; Shockey, K. (2003). “Changing the Face of Instruction: Is Online or In-class More Effective?” College & Research Libraries , 64:5: 378-389.
  • 17.
    “ Changing theFace of Instruction…” Is an online tutorial as effective in teaching library instruction as a classroom setting? H3. Students will report as much or more satisfaction with online instruction as students taking traditional instruction. Research Question Hypotheses H1. Students will have higher scores in information literacy tests after library instruction. H2. Students will have the same or higher scores in info-lit tests after taking online tutorials as students taking traditional instruction.
  • 18.
    “ Changing theFace of Instruction…” Variables: Test scores & survey results Data Collection: Pretest/Posttest & Survey Variables & Data Collection Statistical Tests Conclusions Accept H1: Instruction improves literacy. Desc Stats incl. mean, standard deviation, standard error, T-tests (1 & 2 tailed) Accept H3 alternative hypothesis – Student satisfaction is equal with both methods. Accept H2 alternative hypothesis – Online has no significant difference from traditional.
  • 19.
    Discussion Questions aboutdeveloping Research Questions? About Data Definitions, Data Collection, or Data Analysis? What Research Questions need to be answered at the College Library? Which of these can be analyzed using statistical methods?
  • 20.
    My favorite statisticBaseball is 90% mental – the other half is physical.