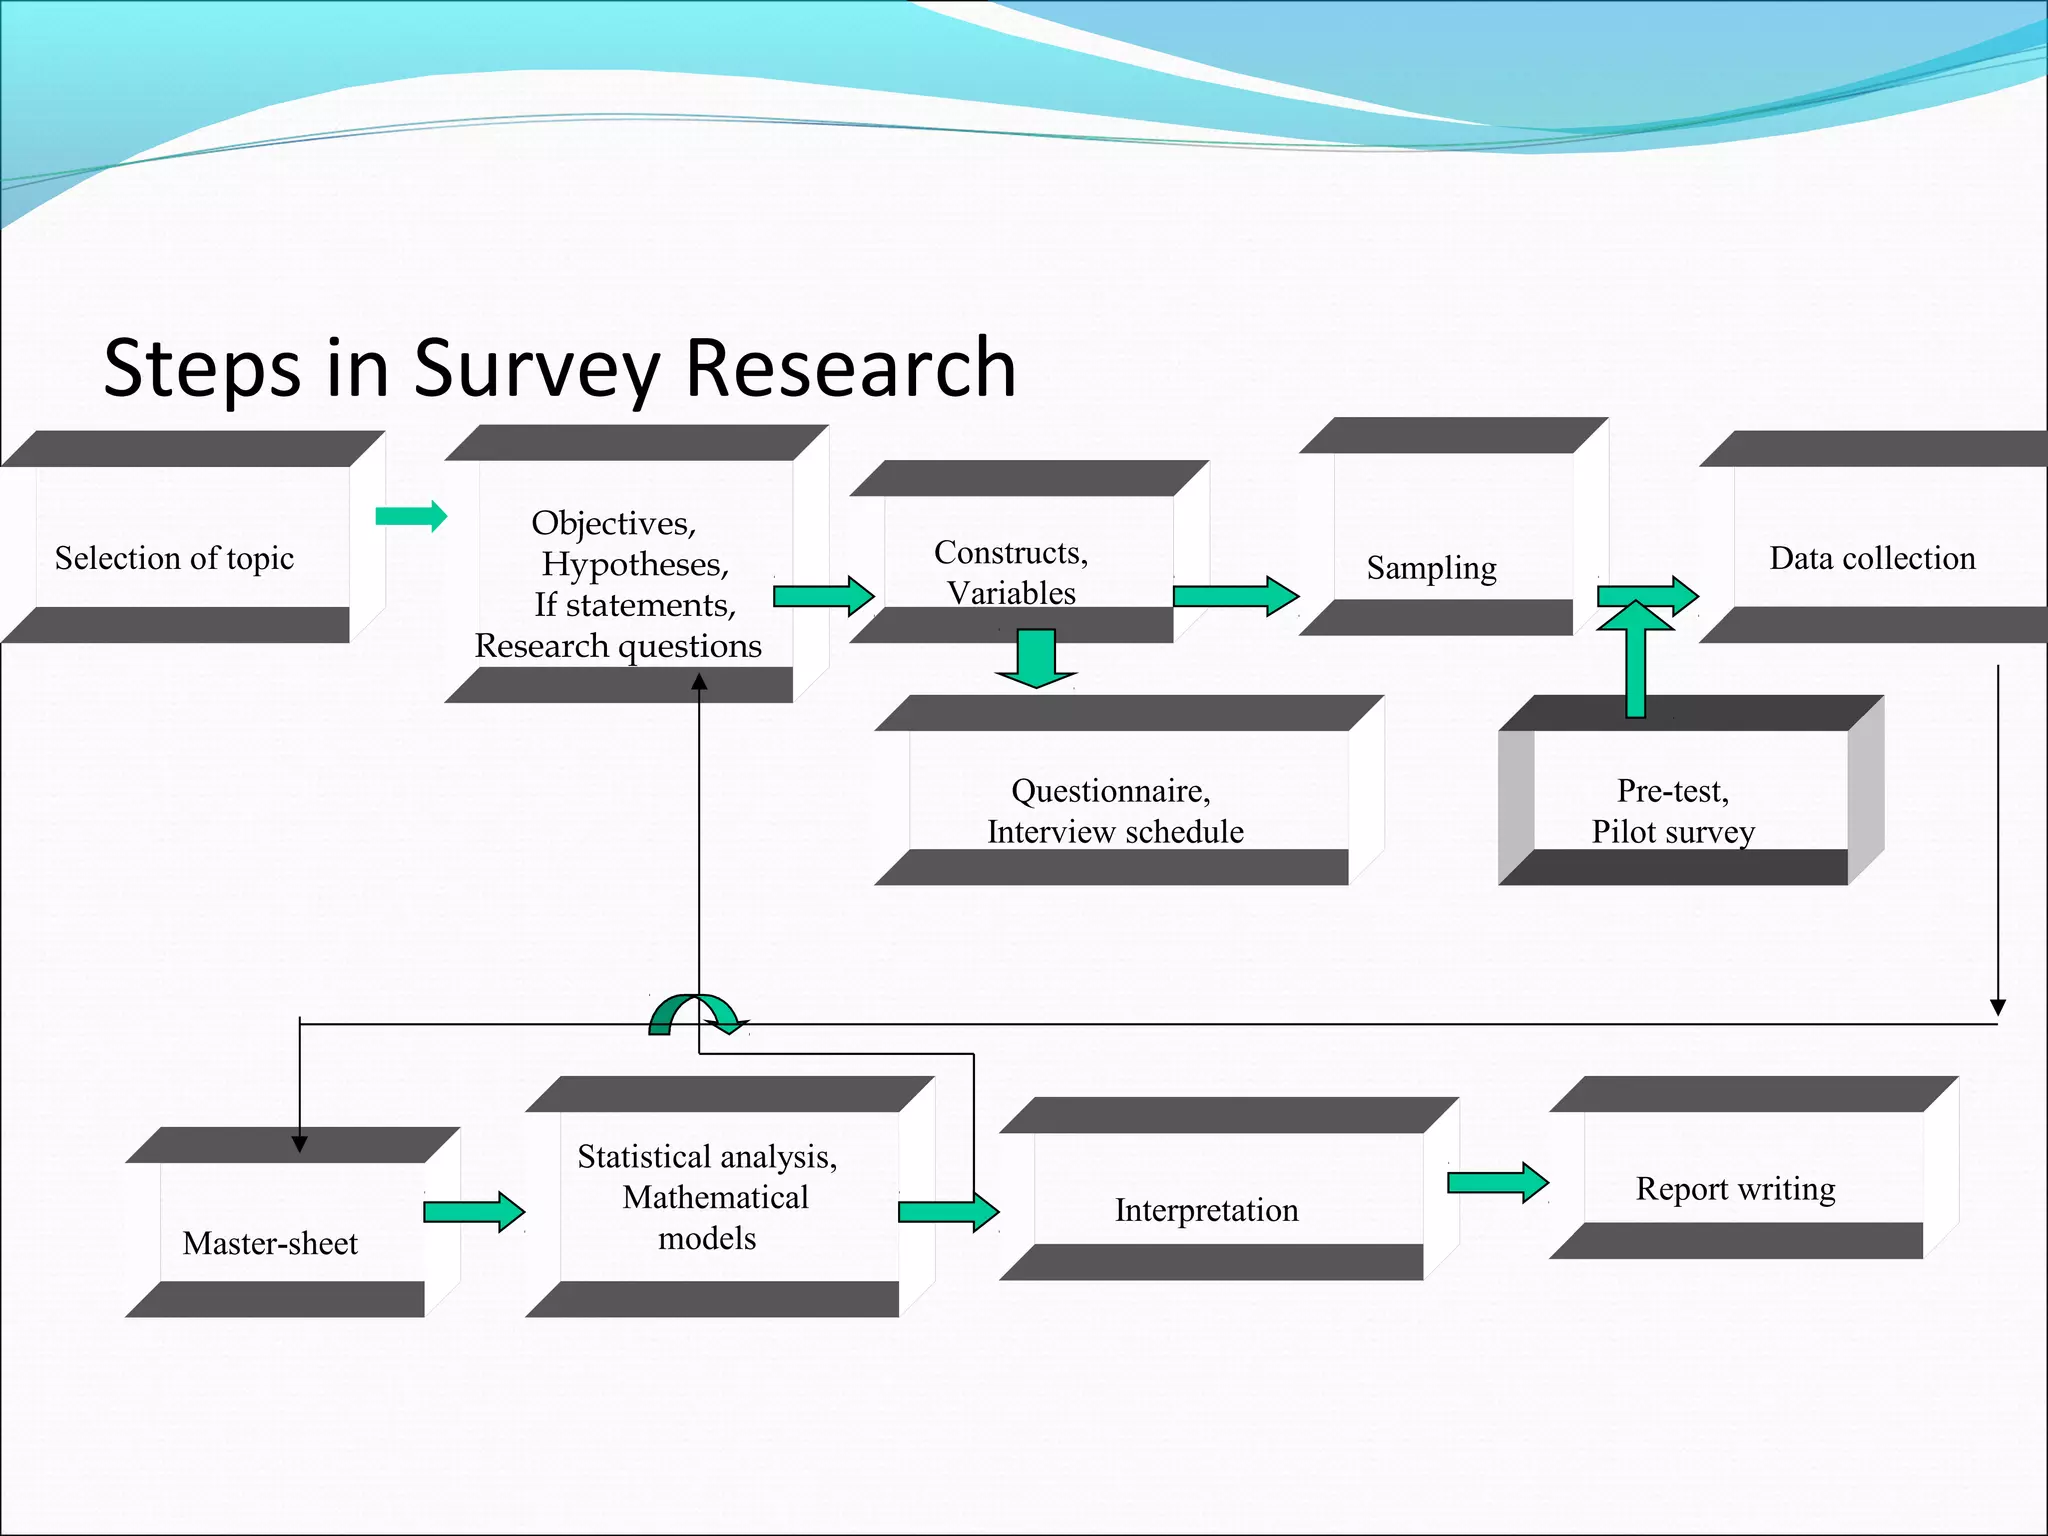
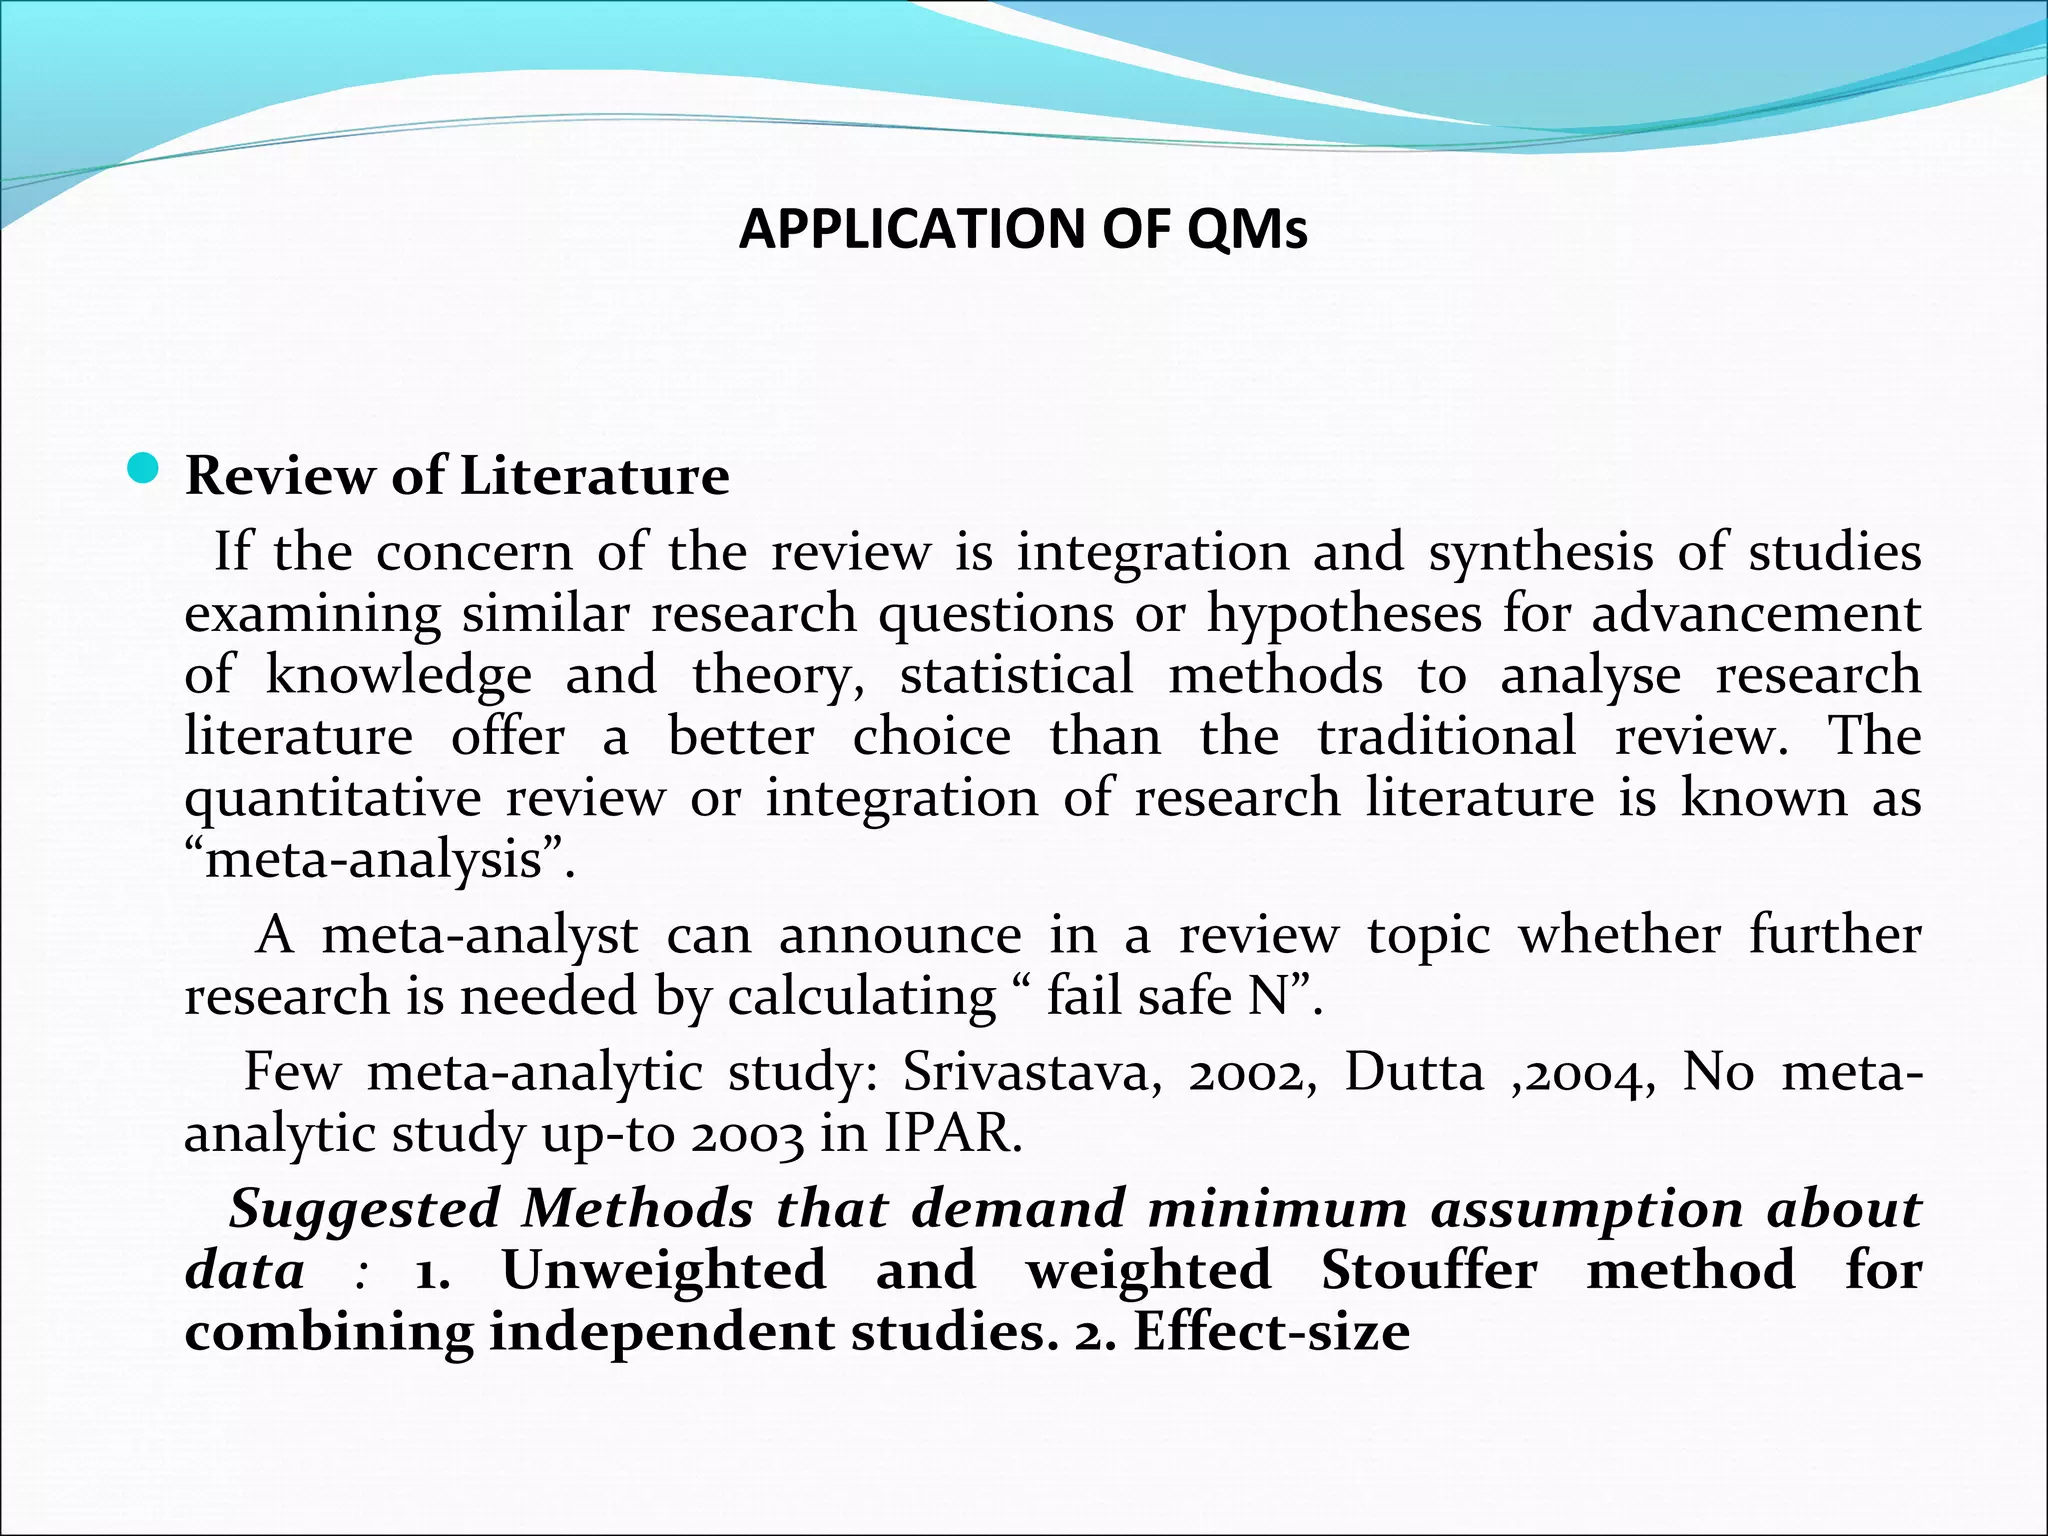
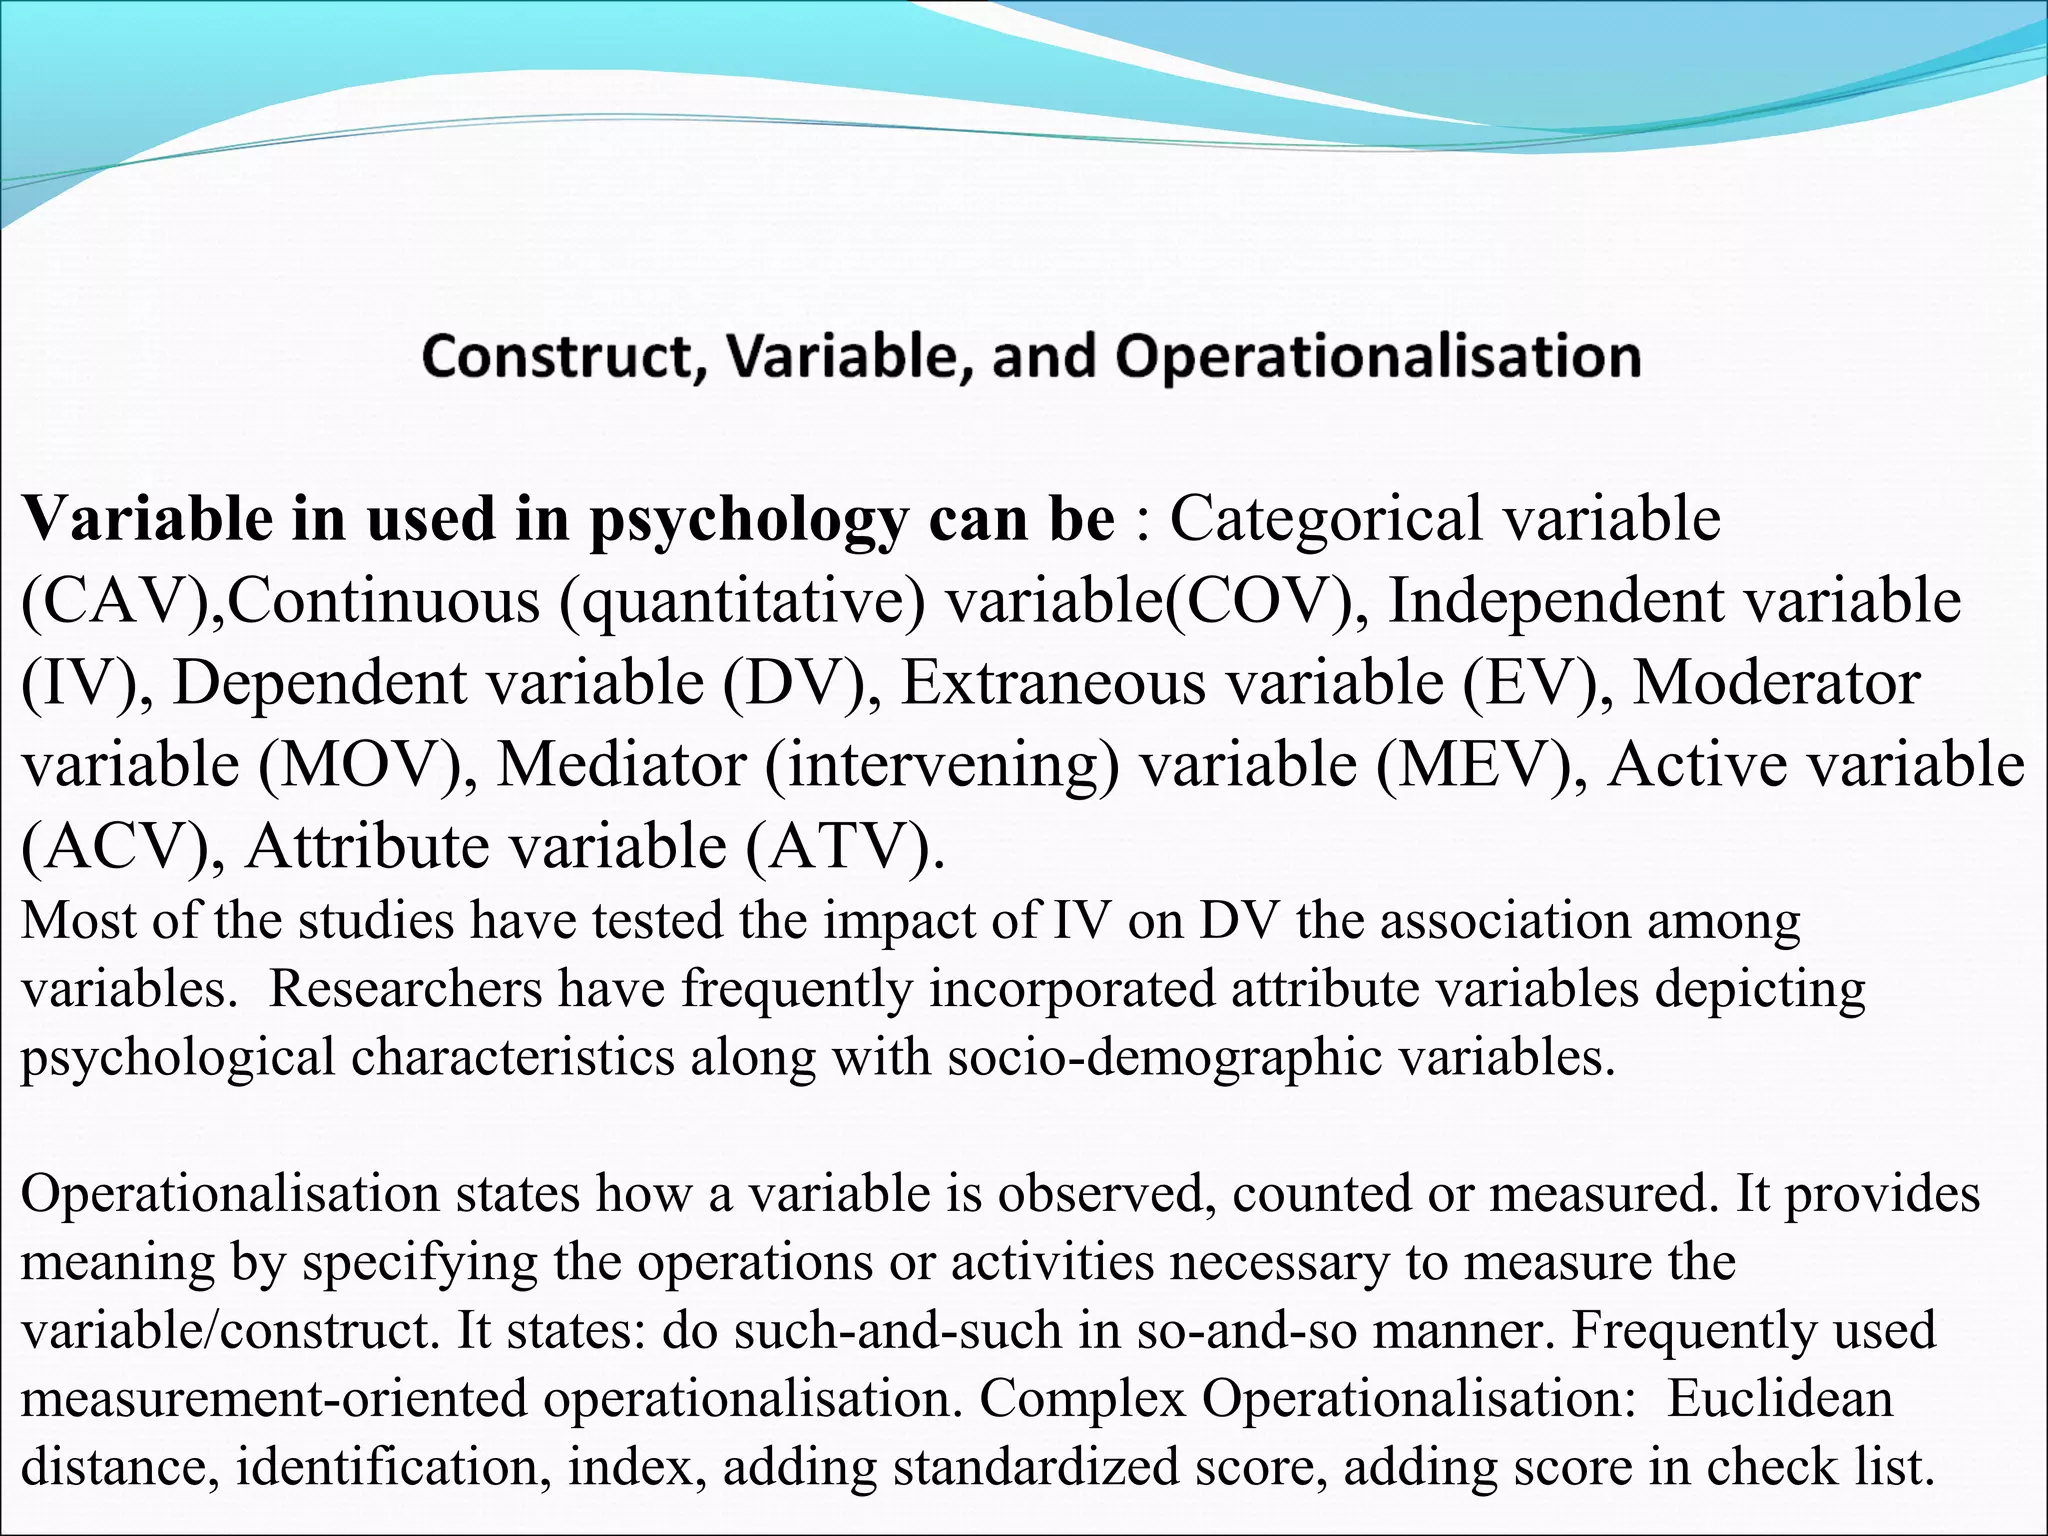
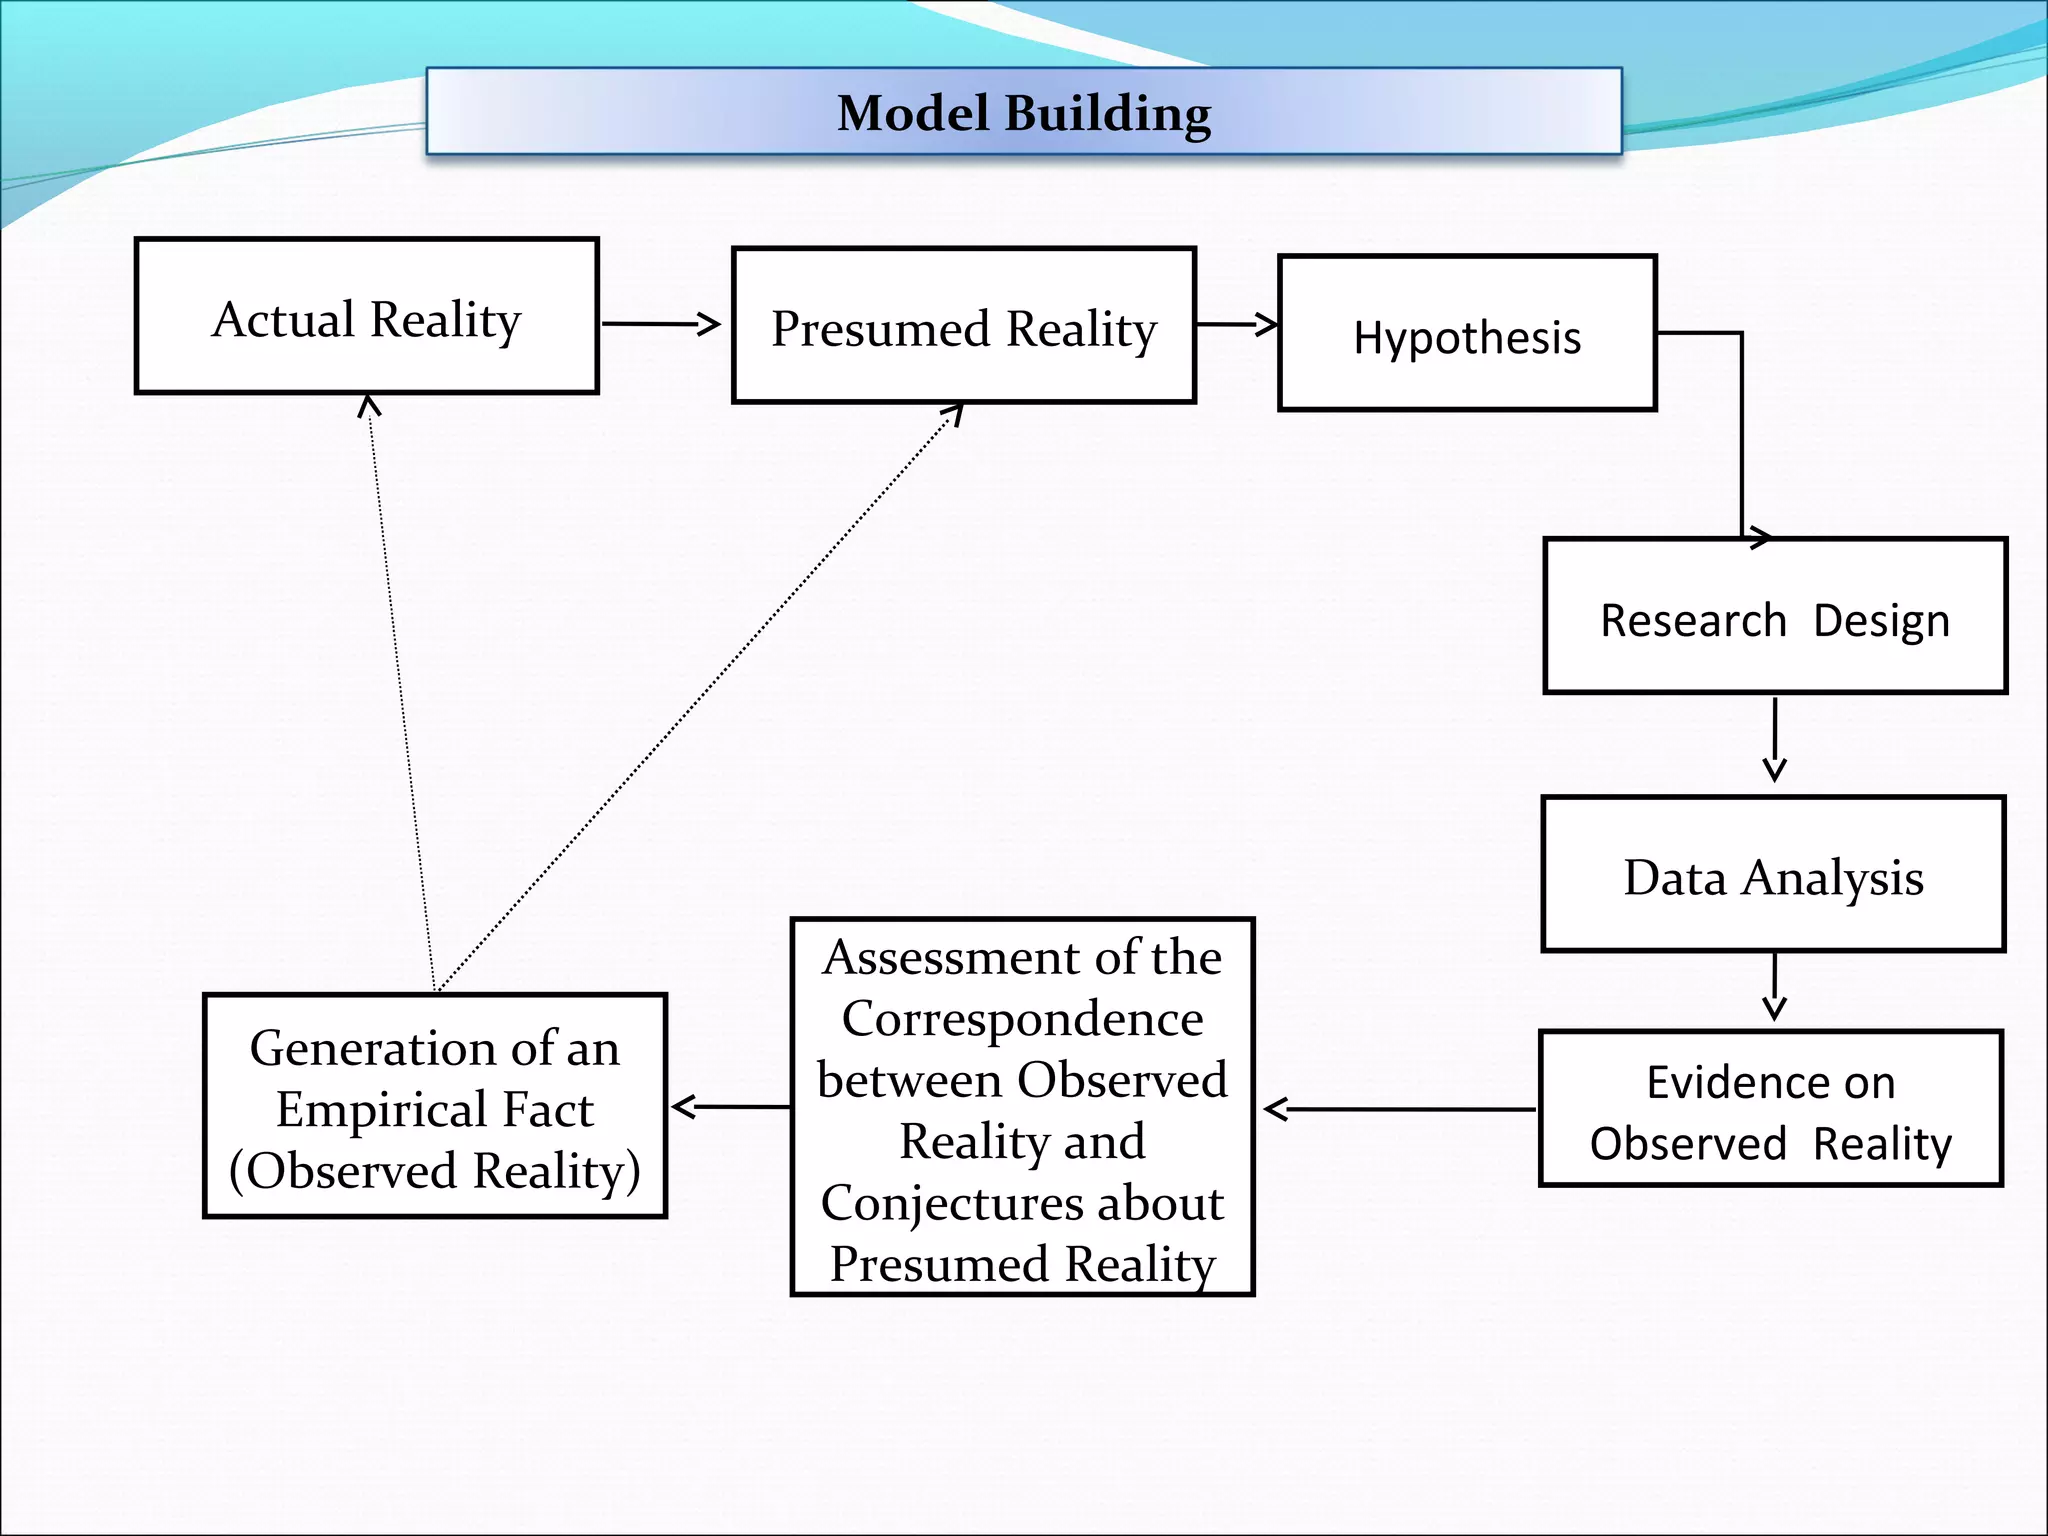
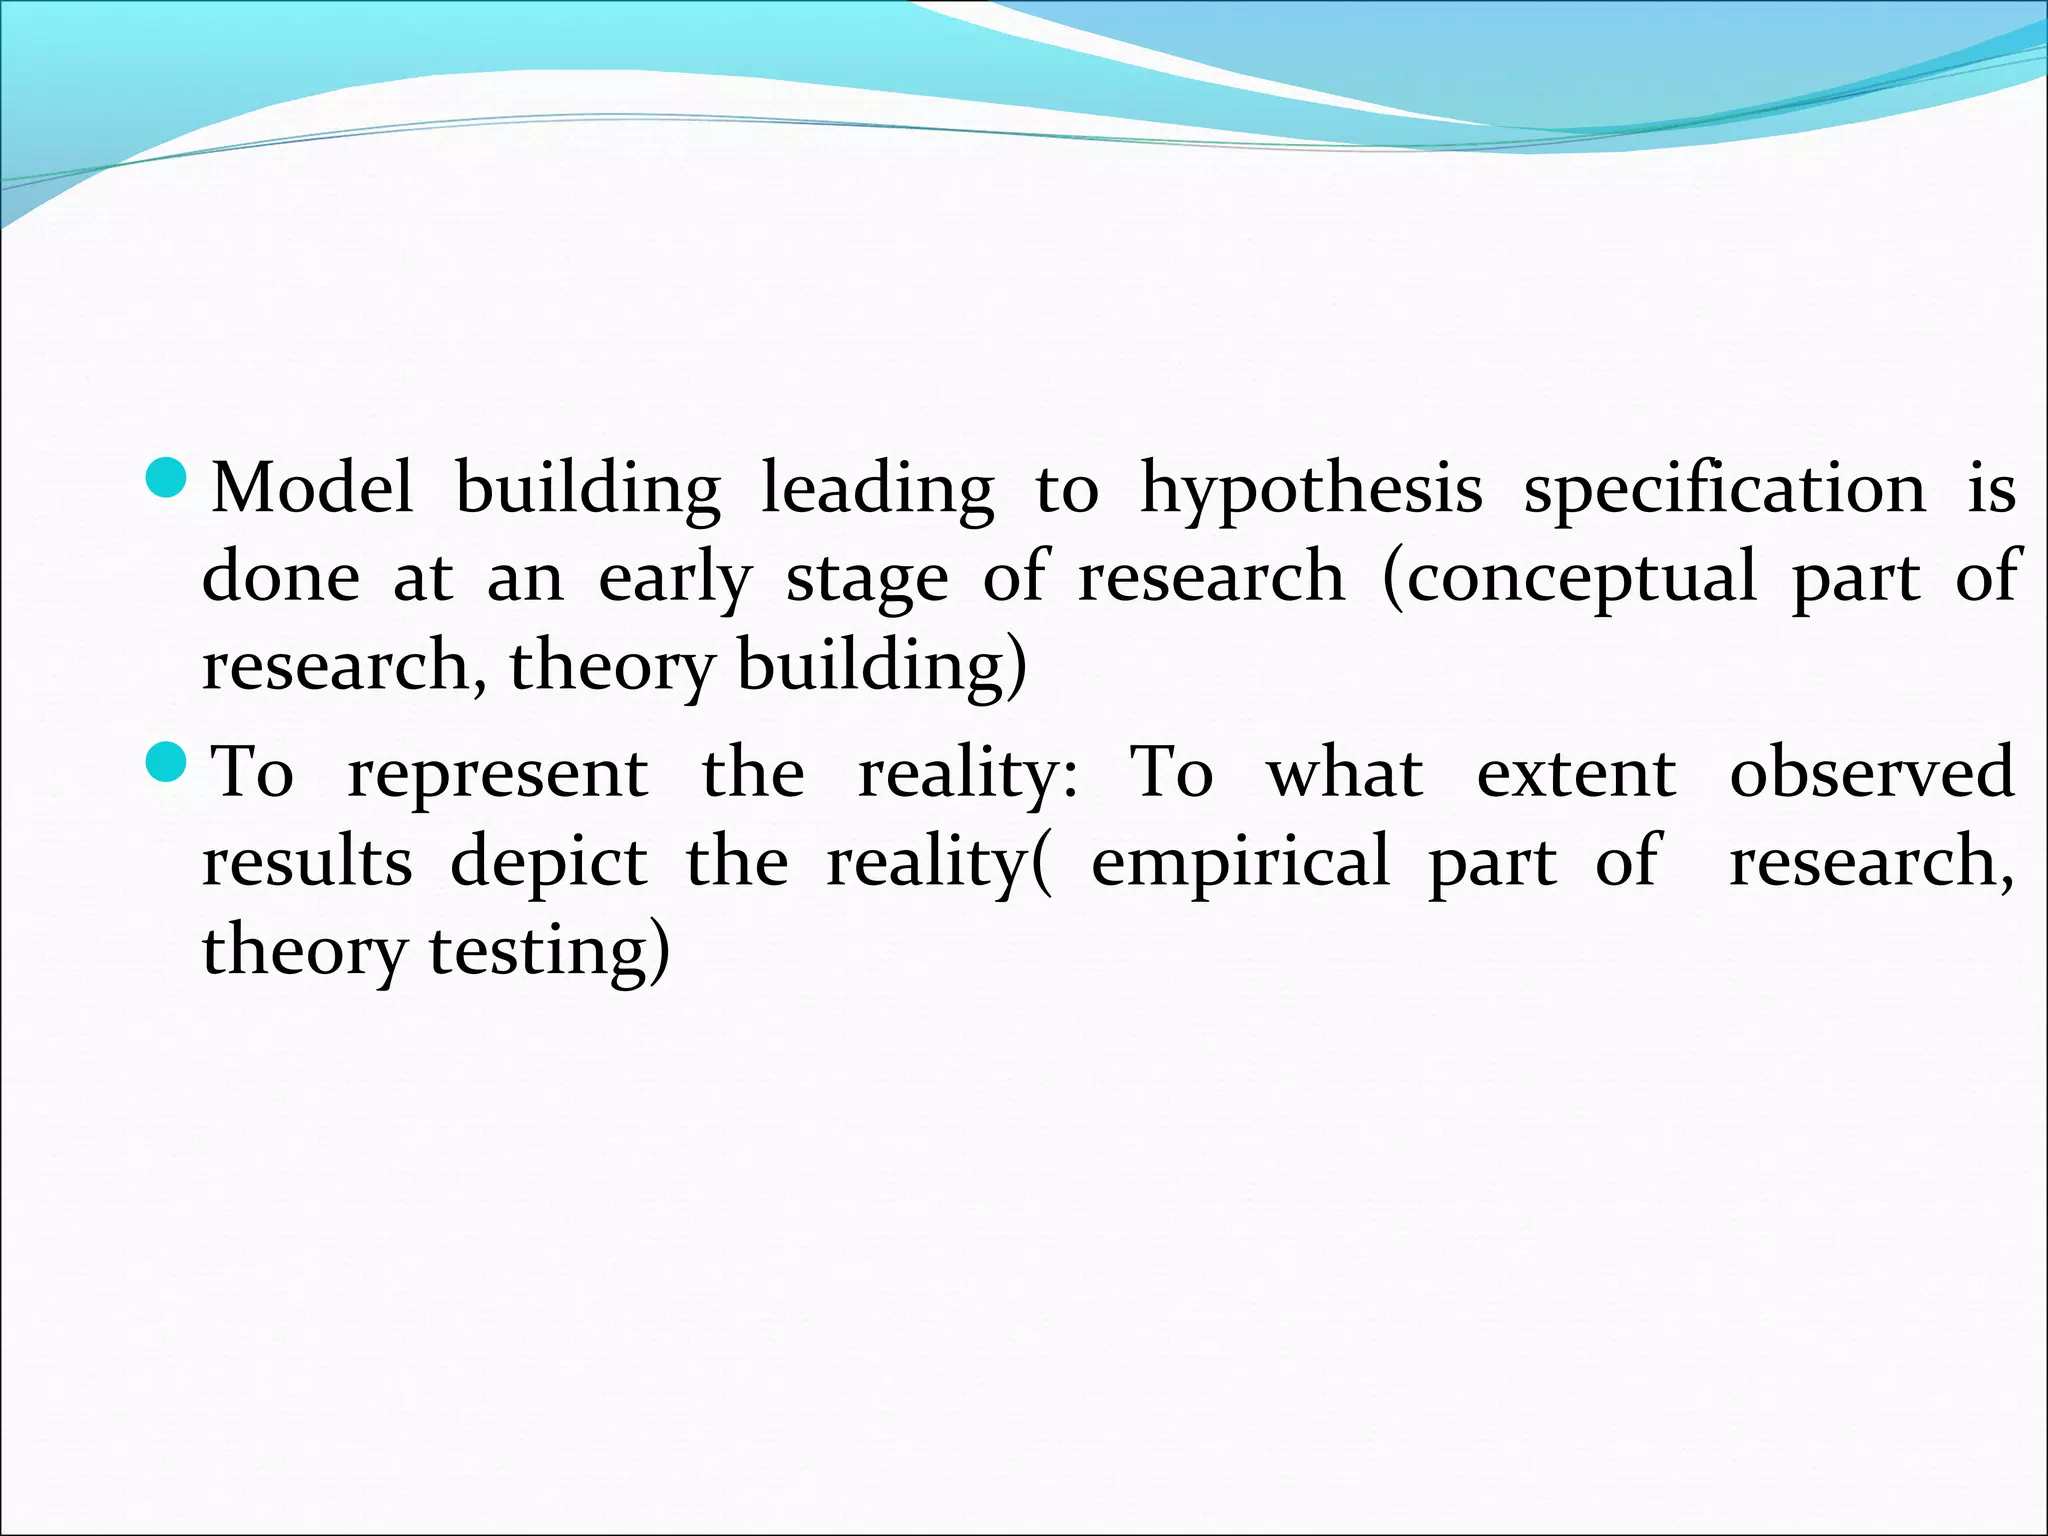
The document discusses methodological paradigms in research. It covers:
1) The history of methodological behaviorism as the dominant paradigm and quantitative methods (QMs) being synonymous with scientific knowledge.
2) Qualitative methods employ techniques like interviews and observation, while QMs use experiments, surveys, and statistics.
3) Both methods have strengths and weaknesses, and using mixed methods can overcome some limitations.
4) Other approaches like action research also exist beyond qualitative and quantitative divides. The methods differ in their philosophical assumptions and focus.
RESEARCH DESIGN , Sampling Designs , Dependent and Independent Variables, Extraneous Variables, Hypothesis, Exploratory Research Design, Descriptive and Diagnostic Research
In this all about the descriptive and analytical research...you can find the definitions and explanations from this document.... I am uploading this document for the other students who face the problems to find data about th descriptive and analytical research.... i hope you can get this data of research easily...thanks
A research design is the arrangement of conditions for collection and analysis of data in a manner that aims to combine relevance to the research with economy in procedure.
It is a conceptual structure within which research is conducted; it constitutes the blueprint for the collection, measurement and analysis of data.
Concept of Qualitative and Quantitative Research Design.pptxSobiaAlvi
Topic: Concept of Qualitative and Quantitative Research Design
Content List
1. Quantitative Research Design
Definition
What is Quantitative Research
Characteristics of Quantitative Research
Quantitative Research: Key Advantages
Quantitative Research Methodology
7 Best Practices to Conduct Quantitative Research
Basic Research Design for Quantitative Studies
Strengths of Using Quantitative Methods
Limitations of Using Quantitative Methods
2. Qualitative research design
Definition
What is Qualitative Research?
Characteristics of Qualitative Research
Three Key Elements of Qualitative Research
Quantitative Research: Key Advantages
Basic Research Design for Qualitative Studies
Strengths of Using Qualitative Methods
Limitations of Using Qualitative Methods
5 Key Types of Qualitative Research
Qualitative Research Methods: The Top 4 Techniques
Qualitative Research Best Practices
References
https://libguides.usc.edu/writingguide/quantitative#:~:text=Quantitative%20research%20deals%20in%20numbers,%2C%20free%2Dflowing%20manner%5D
https://www.scribbr.com/methodology/qualitative-quantitative-research/
https://www.enago.com/academy/qualitative-vs-quantitative-research/
https://www.investopedia.com/terms/q/quantitativeanalysis.asp
https://ideascale.com/blog/what-is-quantitative-research/
https://ideascale.com/blog/what-is-qualitative-research/
Quantitative Research Qualitative Research
Ask broad, general Qs.
Collecting data consisting
largely of words (text) or
image (picture).
Descriptions and analysis of
words for themes.
Conducts inquiry in
subjective, biased manner.
Ask specific narrow Qs.
Collects data from
participants.
Analyzes numbers using
statistics.
Conducts the inquiry in
unbiased, objective manner.
Qualitative & Quantitative Research Methods.docxSobiaAlvi
Content List
Topic: Concept of Qualitative & Quantitative Research Design
1. Quantitative Research
2. Qualitative Research
Topic: Comparison of Qualitative & Quantitative Research
1. Qualitative Vs. Quantitative Research – A Comparison
References
Research design decisions and be competent in the process of reliable data co...Stats Statswork
Research Design may be described as the researchers scheme of outlining the flow of his project. It is based on research design, that the researcher goes about gathering data to answer his research question. It enables the researcher to prioritize his work, create better questionnaires and arrive at conclusions with greater clarity. Statswork offers statistical services as per the requirements of the customers. When you Order statistical Services at Statswork, we promise you the following – Always on Time, outstanding customer support, and High-quality Subject Matter Experts.
Learn More: http://bit.ly/2S312hb
Why Statswork?
Plagiarism Free | Unlimited Support | Prompt Turnaround Times | Subject Matter Expertise | Experienced Bio-statisticians & Statisticians | Statistics Across Methodologies | Wide Range Of Tools & Technologies Supports | Tutoring Services | 24/7 Email Support | Recommended by Universities
Contact Us:
Website: www.statswork.com/
Email: info@statswork.com
UnitedKingdom: +44-1143520021
India: +91-4448137070
WhatsApp: +91-8754446690
Difference Between Qualitative and Quantitative Research.docxzekfeker
Literature search tools Zekarias Tilaye
Hints:
These tools help researchers to find and collect relevant scholarly literature, such as
academic journals, books, and conference proceedings. Some examples of literature
search tools include Google Scholar, PubMed, and Scopus.
Therefore, please provide us with clear information on this topic.
Statistical Techniques for Processing & Analysis of Data Part 9.pdfAdebisiAdetayo1
the present book has been written with two clear objectives, viz., (i) to
enable researchers, irrespective of their discipline, in developing the most appropriate methodology
for their research studies; and (ii) to make them familiar with the art of using different researchmethods
and techniques. It is hoped that the humble effort made in the form of this book will assist in
the accomplishment of exploratory as well as result-oriented research studies.
Research methods and paradigms is a topic from the subject Methods of Research (FC 402) of the degree Master of Arts in Educational Management, quantitative research, descriptive, survey, developmental, correlational, causal-comparative, experimental, true experimental, quasi-experimental, qualitative research, mixed methods research
2. Disciplinary Context of Methodological Paradigms
History: Currently, methodological behaviourism has become the dominant paradigm
and the QM has turned into the synonym of scientific, objective, and dependable source
of knowledge.
Qualitative methods employ case studies, historical methods, in-depth interview,
participant observation, participatory rural appraisal, grounded theory, and narratives.
QMs employ mathematics, modelling, meta-analysis, true and quasi experiments,
objective assessments, sample surveys, and statistical data analyses.
Both methods have their assets, liabilities and standards of practice. The shortcomings
can be upset adopting triangulated or mixed method.
Still there is another called action research, execution of projects, modifying knowledge
getting feedback from field.
The methods differ in reasoning, defining reality, emphasis, research objective, focus,
types of questions, nature of observation, sample, nature of data, data collection
methods, analysis and report preparation. Both Qualitative and QMs are complimentary.
A quantitative study is also qualitative because interpretation is common to both.
QMs are favoured because of positivist scientific approach, more precision, large
sample and generalisation, availability of computer software.
3. Steps in Survey Research
Objectives,
Selection of topic Hypotheses, Constructs, Sampling Data collection
If statements, Variables
Research questions
Questionnaire, Pre-test,
Interview schedule Pilot survey
Statistical analysis,
Mathematical Report writing
Interpretation
Master-sheet models
4. APPLICATION OF QMs
Review of Literature
If the concern of the review is integration and synthesis of studies
examining similar research questions or hypotheses for advancement
of knowledge and theory, statistical methods to analyse research
literature offer a better choice than the traditional review. The
quantitative review or integration of research literature is known as
“meta-analysis”.
A meta-analyst can announce in a review topic whether further
research is needed by calculating “ fail safe N”.
Few meta-analytic study: Srivastava, 2002, Dutta ,2004, No meta-
analytic study up-to 2003 in IPAR.
Suggested Methods that demand minimum assumption about
data : 1. Unweighted and weighted Stouffer method for
combining independent studies. 2. Effect-size
5. Variable in used in psychology can be : Categorical variable
(CAV),Continuous (quantitative) variable(COV), Independent variable
(IV), Dependent variable (DV), Extraneous variable (EV), Moderator
variable (MOV), Mediator (intervening) variable (MEV), Active variable
(ACV), Attribute variable (ATV).
Most of the studies have tested the impact of IV on DV the association among
variables. Researchers have frequently incorporated attribute variables depicting
psychological characteristics along with socio-demographic variables.
Operationalisation states how a variable is observed, counted or measured. It provides
meaning by specifying the operations or activities necessary to measure the
variable/construct. It states: do such-and-such in so-and-so manner. Frequently used
measurement-oriented operationalisation. Complex Operationalisation: Euclidean
distance, identification, index, adding standardized score, adding score in check list.
6. Conceptual Model
A model is a proposed abstraction of reality. It represents the principles
with essential characteristics of behaviour or phenomenon in the real world
in a simplified way. Though the complex covert (mental processes) and
overt behaviour of the organism are not easy to model quantitatively, higher
level of abstraction is necessary for the construction of conceptual models.
Models are more precise than verbal descriptions and offer greater
manipulability.
Suar (1992), studying the polarisation phenomenon, derived that: R ≥ (Uc-
Uf) / (Us-Uf). Using graph theory concepts of nodes or vertices, edges, and
ambisidigraph, Acharya and Joshi (2005) have rationalised the various
combinations of attraction, repulsion, and indifference among members in
small social groups.
7. Sampling
The power of a sample to produce a close approximation to the population depends
on (a) the sample size, (b) the methods by which we draw the sample, and (c) the
measurement of non respondent bias.
None of the studies has provided information on the process that leads to sample
size decision. Adequate sample size can be rationally determined (a) in advance
before conducting the study, (b) applying rules of thumb, and (c) collecting pilot
data.
Cohen Table: effect-size, power, alpha level
Rule of Thumb: Factorial design: 20 cases per cell, correlation an path diagram 1:10,
reliability:300-400, SEM > 200.
Collecting pilot data: n = SD2 X (Z2 / E2)
Method: Rarely mentioned, mostly non-probability sampling, Response Rate,
Nonrespondent Bias: The nonrespondent bias is measured either (a) stating sample
representativeness, (b) comparing those who respond and who do not, or (c) early
versus late respondents.
8. Methods of Data Collection
Experimental Research: External validity
Presence-absence, amount, type techniques are followed
in pure experimental deign.
A close perusal of the reports of these studies indicates
several features. First, attrition of experimental subjects
caused due to noncompliance, dropout, and other
reasons is not mentioned. Second, researchers have
frequently randomized block design, and factorial
designs and reported main and interaction effects. Latin
square design, and split-plot and repeated measures are
hardly used. Lastly, in experiments on human subjects,
authors and/or coauthors are the experimenters. They
need to disclose what specific methods are adopted to
deal with research artifacts.
Experimenter bias and implicit demand on subjects’
performance are research artifacts.
9. Methods of Data Collection
Double-blind control, computer-based experiments,
conduct experiments via Internet. Semi- or quasi-
experiments to understand reality.
Non-experimental research: (a) comparative research,
and (b) correlational research.
A self-reported questionnaire has become an ubiquitous
tool for such research. Checklist, multiple choice,
ranking questions are rare. Reliability and validity poor.
PI, C-OAR, Scaling response categories, dolls, ladder,
visuals, contextual measuring tools, secondary data
use.One main source of measurement error in
behavioural investigation is the “common method bias”,
variance attributable to measurement method rather
than to the construct of interest. It includes the
contents of specific items, scale-type, response format,
and the general context, or the response biases as hallo
effects, social desirability, acquiescence, and leniency
10. Data Analysis, Assessment and Indigenous Psychology
Data Analysis
Data Entry,
Examine Raw Data: Examining the data statistically
or graphically has three basic purposes. First, the
researcher gets insight into the basic character of the
data, relationships, and differences among variables.
Second, missing values, illegal values, and outliers are
identified and resolved. Third, the basic assumptions
of the statistical methods are identified and compiled
with.
The researcher can test the basic assumption in data
graphically or statistically that statistical methods
demand. The common among them are normality,
linearity, homoscedasticity, and multicollinearity.
11. Data Analysis, Assessment and Indigenous Psychology
Statistical Data Analysis: First, what the investigator is
looking for in accordance with objectives, hypotheses, and
research questions? Different statistical methods will be used
for understanding difference, relationship, prediction, and
interaction. Second, are the data from same set of sample or
different samples? Depending on sample categories/groups,
analyses differ. Third, in which scale are the data of different
variables (metric--interval and ratio scale, nonmetric-- ordinal
and nominal scale)? Once the questions are replied,
appropriate statistical methods may be employed to answer
the research questions.
Occasionally used multivariate statistics are multiple
regression with dummy variables, canonical correlation,
correspondence analysis, cluster analysis, principal
component analysis, confirmatory factor analysis, and path
analysis. State-of-art method: SEM
12. AN AGENDA FOR FUTURE
Revamp the Course on Research Methodology
Contents need inclusion are quantitative reviews; sampling; item-
response theory, and scale construction; content analysis; multivariate
statistics of multiple regression analysis; discriminate analysis;
conjoint analysis; correspondence analysis; canonical correlation;
confirmatory factor analysis; and path analysis. Psychologists treat the
real world phenomena as linear and simple which are nonlinear,
dynamic, and complex. It is a challenge for us to determine whether the
methodologies that have been developed to study dynamic, non-linear,
and complex systems can fundamentally advance our understanding of
human behaviour.
Analytical and reflective mindset: Pedagogy- lecture and case study
methods. Hands-on-experience and learning by doing in SPSS, SYSTAT,
and AMOS with hypothetical data, analysis, and interpretation can
boost the confidence of researchers
13. Representative Sample, Longitudinal Studies, and New Methods of
Data Collection
Longitudinal studies are required on the same sample or cohort groups over
an extended period of time repeatedly for understanding, and predicting of
individuals’, groups’, and communities’ history, transitions, differences,
future expectations, and cumulative effects. It would help testing or
generating theories, and formulating public policy.
The tools of interview schedule, semi-projective tests, projective-inventory,
visuals, and contextual measuring methods can be used and developed to
measure variables. Single case study, which has important bearing in
clinical investigation, also deserves our attention.
Use of Available Secondary Data: Census reports, statistical handbooks,
national sample survey records, annual reports of companies, Internet, and
intranet provide a wealth of data. The substance from the secondary “hard
data” can and will definitely supplement to the behavioural soft data.
14. Data Documentation: A databank, created by a nodal psychology
department of the country, will eliminate the collection of underused data,
reveal the phenomenon across time, increase the electronic access to data,
help doing meta-analysis, and guide policy formulation with evidence on
important social issues of poverty, health, education, employment, etc.
Theory-driven Research
Integrate Qualitative and QMs, and Multi-disciplinary
Perspective: More complex the psychological issues under
investigation, multiple methodologies are required for comprehending and
in-depth probing. If the QMs can be applied with participant observation,
ethnography, unstructured interview, content analysis, and historical
methods, the information base will be rich for advancement of knowledge.
An unidisciplinary outlook provides tunnel vision. Integration of multi-
disciplinary perspectives can contribute to the fuller understanding of the
phenomenon under investigation.
15. Model Building
Actual Reality Presumed Reality Hypothesis
Research Design
Data Analysis
Assessment of the
Correspondence
Generation of an
between Observed Evidence on
Empirical Fact
Reality and Observed Reality
(Observed Reality)
Conjectures about
Presumed Reality
16. Model building leading to hypothesis specification is
done at an early stage of research (conceptual part of
research, theory building)
To represent the reality: To what extent observed
results depict the reality( empirical part of research,
theory testing)
17. Knowledge: Actual knowledge about reality exists
outside. The researcher formulates beliefs about that
reality.
The belief statements about the happenings of reality
are the basis of conjectures/hypotheses/research
questions
Then these are tested collecting data, analysising data,
and reporting results.
If the results supports the beliefs, knowledge generated
is accepted.
Social science models are in fuzzy state.
18. Role Exhaustion Cynicism Professional
ambiguity efficacy
Work
performance
Role
conflict H1a +
_
H1b + + + H2a _ + + + Affective
Schedule commitment
pressure
_ H1c + + +
Subjective
well-being
Irregular
shifts
H1d + H3a _ H2 b _ Organizational + Normative
commitment
Job commitment
H1e + burnout H3b _ +
Pressure from +
client Social Continuance
interaction H1f + support + commitment
H3c _
Group non-
cooperation H1g + Practising
yoga and
meditation
Psychological
contract H1h +
violation _
H2c + + +
Work-family
conflict
Interpersonal
relationships
Note: ‘+’ indicates positive impact and ‘–’ indicates negative impact
Fig. 1. Conceptual model of antecedents, job burnout, work-related outcomes, and buffers
19. Physical
health
Exhaustion
_ _ _
+ H4a +
Anxiety and
_ depression
H5a Subjective _ +
well-being
Cynicism + Job burnout H4b + Mental + Social
dysfunction
_ _
health
H5b Social +
support Loss of
_ confidence
H5c
_ Practising yoga
Professional and meditation
_ _ _
efficacy
H4c +
Behavioral
symptoms
Note: ‘+’ indicates positive impact and ‘–’ indicates negative impact
Fig. 2. Conceptual model of job burnout, health-related outcomes, and buffers