Download to read offline
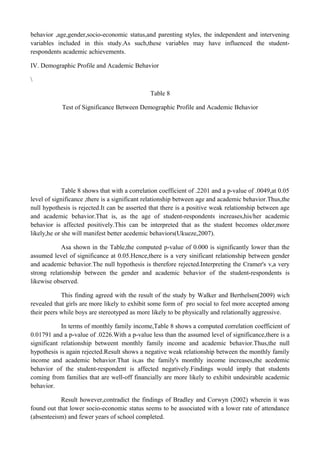
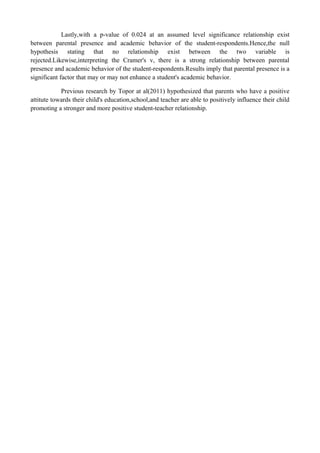

The document summarizes data gathered from a study on student academic behavior and performance. It provides details on: 1) The demographic characteristics of 44 student respondents, including their age, gender, family income, and parental status. 2) The academic behavior ratings of students, as perceived by teachers, with most students rated as "slightly unacceptable". 3) The process used to analyze the data, which involved calculating frequencies, percentages, means, and using Likert scales and Pearson's correlation coefficient to determine relationships between variables.


