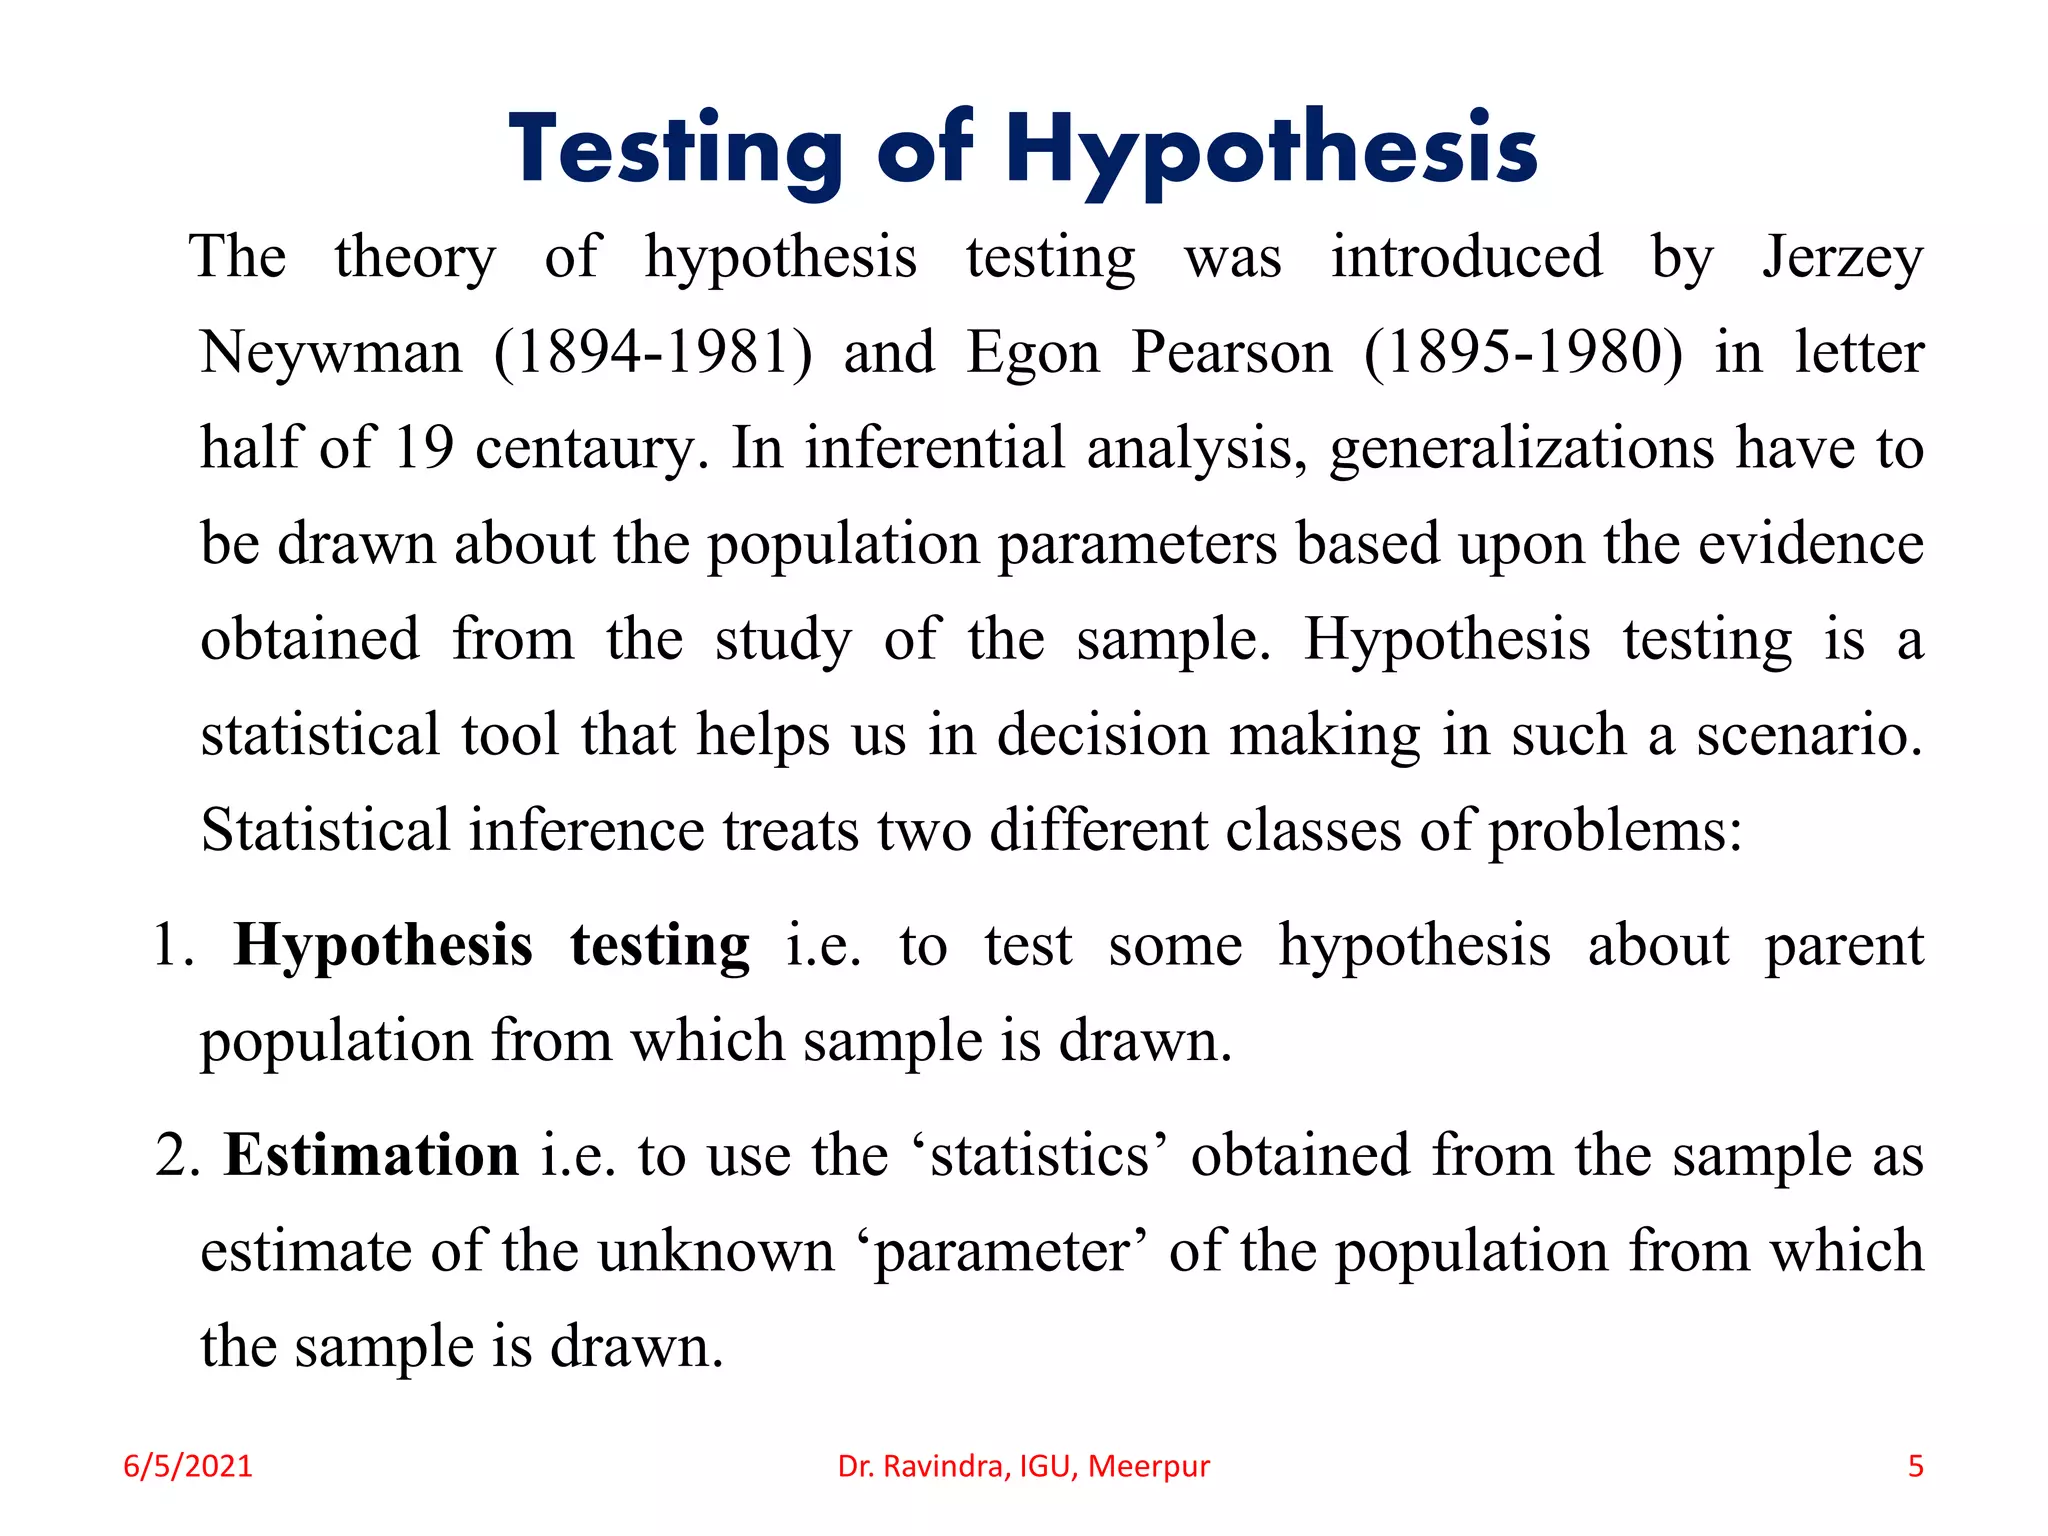
Research Hypothesis
Dr. Ravindra
Associate Professor
Department of Commerce
Indira Gandhi University, Meerpur, Rewari
Email: ravindra.commerce@igu.ac.in
6/5/2021 Dr. Ravindra, IGU, Meerpur 1
Meaning and Definition of Research
Hypothesis
• Meaning
Research hypothesis is tentative assumption made in order to draw
out and test its logical or empirical consequences. As such the
manner in which research hypothesis are developed is particularly
important since they provide the focal point for research.
• Definition
“Hypothesis is a tentative generalization, the validity of which
remains to be tested, in its most eliminatory stage it’s may be very
hunchy, gussy and imaginative data which became the basis of
action and investigation.”
“A hypothesis in statistics is simply a quantitative statement about
the population.”
By: Prof. Morris Hamburg
6/5/2021 Dr. Ravindra, IGU, Meerpur 2
Characteristics
• Hypothesis should be clear and specific.
• Delimiting the research area.
• Explain about, what type of data is required.
• Guide about the statistical tool required.
• Keep the researcher on right track.
• It’s sharpening the thinking of researcher.
• Hypothesis should be capable of being tested.
• Hypothesis should be stated as far as possible in most simple terms.
• Hypothesis should be amenable to testing within reasonable time.
• Hypothesis must explain the facts that gave rise to the need for
explanation.
6/5/2021 Dr. Ravindra, IGU, Meerpur 3
How does one go about developing working
hypothesis?
• Discuss with colleagues and experts.
• Examine the related data and concerned records if available.
• Review of similar studies in the area of research.
• Exploratory personal investigation.
• Some time dreams/sixth sense of the researcher also play major
role in developing the hypothesis.
Thus, working hypothesis arise as result of a priori thinking about
the subject, examination of the available data and the material
including in related studies and the counsel of experts and
interested parties.
6/5/2021 Dr. Ravindra, IGU, Meerpur 4
Testing of Hypothesis
The theory of hypothesis testing was introduced by Jerzey
Neywman (1894-1981) and Egon Pearson (1895-1980) in letter
half of 19 centaury. In inferential analysis, generalizations have to
be drawn about the population parameters based upon the evidence
obtained from the study of the sample. Hypothesis testing is a
statistical tool that helps us in decision making in such a scenario.
Statistical inference treats two different classes of problems:
1. Hypothesis testing i.e. to test some hypothesis about parent
population from which sample is drawn.
2. Estimation i.e. to use the ‘statistics’ obtained from the sample as
estimate of the unknown ‘parameter’ of the population from which
the sample is drawn.
6/5/2021 Dr. Ravindra, IGU, Meerpur 5
Procedure of Testing the Hypothesis
The procedure of testing hypotheses follows five
sequential steps, which are as:
1. Set up the Hypothesis
2. Set up the significance level
3. Setting a test criterion
4. Doing calculations
5. Making decisions
6/5/2021 Dr. Ravindra, IGU, Meerpur 6
Procedure of Testing the Hypothesis
1. Set up the Hypothesis: In the context of statistical
analysis, we often talk about null hypothesis and
alternative hypothesis. The null hypothesis is a very
useful tool in testing the significance of difference. In its
simplest form the hypothesis asserts that there is no real
difference in the sample and the population in the
particular matter under consideration, hence, the word
‘null’ which means ‘invalid’, ‘void’ or ‘amounting to
nothing’, and that the difference found is accidental and
unimportant arising out of fluctuations of sampling.
6/5/2021 Dr. Ravindra, IGU, Meerpur 7
Procedure of Testing the Hypothesis
As against the null hypothesis, the alternative hypothesis
specifies those values that the researcher believes to hold
true, and, of course, he hopes that the sample data leads to
acceptance of this hypothesis as true. The null and
alternative hypotheses are distinguished by the use of two
different symbols i.e.
Ho = Null Hypothesis
Ha = Alternative Hypothesis
6/5/2021 Dr. Ravindra, IGU, Meerpur 8
Procedure of Testing the Hypothesis
2. Set up a Suitable Significance Level: The next step is
to test the validity of Ho against that of Ha as at certain
level of significance. The confidence with which an
experimenter rejects or retains a null hypothesis depends
upon the significance level adopted. The significance level
generally express in a percentage i.e. 5% level of
significance or 1% level of significance. At 5% level of
significance the value of SE is 1.96, whereas, at 1% level
the value of SE is 2.58. .95 ÷ 2 = .4750 or .99 ÷ 2 = .4950
6/5/2021 Dr. Ravindra, IGU, Meerpur 9
Procedure of Testing the Hypothesis
6/5/2021 Dr. Ravindra, IGU, Meerpur 10
Procedure of Testing the Hypothesis
3. Setting a Test Criterion: This involves selecting an appropriate
probability distribution for the particular test. Some probability
distributions that are commonly used in testing procedures are t-
test, F-test, Chi-square test etc.
4. Doing Calculations: Having taken the first three steps, we have
completely designed a statistical test. We now proceed to the
fourth steps- performance of various computations- from a random
sample of size n, necessary for the test. These calculations include
the testing statistics and the standard error of testing statistics.
5. Making Decisions: Finally at fifth step, we may draw statistical
conclusions and take decisions. A statistical conclusion or decision
of rejection or acceptance the null hypothesis is as under:
6/5/2021 Dr. Ravindra, IGU, Meerpur 11
Procedure of Testing the Hypothesis
Decision Criterion
a. Test statistic approach
Calculated test Statistics > Table Value, Ho Rejected
Calculated test Statistics ≤ Table Value, Ho Accepted
b. P-value approach
If calculated P-value ≥ Critical Value i.e. 0.05, Ho is
Accepted.
If calculated P-value < Critical Value i.e. 0.05, Ho is
Rejected.
6/5/2021 Dr. Ravindra, IGU, Meerpur 12
Concepts Related to Testing the
Hypothesis
Type-I Error and Type-II Error
Type-I Error: In a statistical hypothesis testing
experiment, a Type-I error is committed by rejecting the
null hypothesis when it is true. Type-I error is denoted by
‘α’.
Type-II Error: The Type-II error is committed by not
rejecting the null hypothesis when it is false. The
probability of committing a Type-II is denoted by ‘β’.
6/5/2021 Dr. Ravindra, IGU, Meerpur 13
Concepts Related to Testing the
Hypothesis
Accept Ho Reject Ho
Ho is True Correct Decision Type-I Error
[Confidence Level (1-α)] [Critical Value – α]
Ho is False Type – II Error Correct Decision
[β ] [Power of the Test (1-β)]
6/5/2021 Dr. Ravindra, IGU, Meerpur 14
Two- tailed and One-tailed test of Hypothesis
• Two-tailed test: When rejection region/criterion is locating on both
side of the distribution then it is the case of two-tailed test i.e.
Ha: u ≠ uo
6/5/2021 Dr. Ravindra, IGU, Meerpur 15
Continue….
• One-tailed test: When the decision region/criterion locates on one
side of the distribution, then it is the case of one-tailed i.e. Ha: u >
uo or Ha: u < uo
6/5/2021 Dr. Ravindra, IGU, Meerpur 16
Standard Errors
Standard Error: Standard deviation of sampling distribution is
called the standard error.
Sampling Distribution: If we select number of samples of same
size from a given population, and calculate some statistics (like
mean, mode, SD etc.) from each sample, we shall get a series of
values of these statistics. These values obtained from different
samples can be put in the form of a frequency distribution. The
distribution so formed of all possible values of a statistics is called
‘sampling distribution’.
Universe Distribution: Such a distribution emerges when each and
every item of the universe is studied, and we have full knowledge
of its mean and standard deviation.
6/5/2021 Dr. Ravindra, IGU, Meerpur 17
Standard Errors
Sample Distribution: If instead of all the items of the universe
we study only a small part of it i.e. takes a sample, we arrived
at a distribution which technically called a sample
distribution.
Properties of Sampling Distribution
1. The arithmetic mean of the sampling distribution is the same
as the mean of the universe from which samples were taken.
2. The sampling distribution of mean has a standard deviation
equal to the population standard deviation by the square root
of the sample size.
3. The sampling distribution of means is normally distributed.
6/5/2021 Dr. Ravindra, IGU, Meerpur 18
Utility of Standard Deviation
Utilities of S.D.
1. It is used as an instrument in testing the hypothesis.
2. Standard error provides the idea about the unreliability of
a sample. The greater the SE, the greater is the departure
of actual frequency from the expected ones hence the
greater the unreliability of the sample. The reciprocal of
S.E., is a measure of reliability of the sample.
3. With the help of S.E. we can determine the limits within
which the parameter values are expected to lie i.e. Mean±
3 S.E. will gives you 99.73% values.
6/5/2021 Dr. Ravindra, IGU, Meerpur 19
(Appendix) Normal Distribution Table
6/5/2021 Dr. Ravindra, IGU, Meerpur 20
(Appendix) Appropriate Tools for Casual Association
Sr. No. Dependent Variable Independent Variable Tool for Analysis
1. Metric Metric Regression
2. Metric Metric and Non- metric Regression
3. Metric Non-metric variable with
Two Categories t-test
4. Metric Non-metric Variable with
More than two Categories ANOVA
5. Metric More than one Non-metric Factorial Design
Independent Variable (one-way ANOVA)
6. More than one One or more non-metric MANOVA
Metric Variable Independent Variable
7. Non-metric Metric Discriminant Analysis
8. Non-metric Non-metric Chi-Square Test
6/5/2021 Dr. Ravindra, IGU, Meerpur 21
Research Hypothesis
Thank You !
6/5/2021 Dr. Ravindra, IGU, Meerpur 22

Research Hypothesis

  • 1.
    Research Hypothesis Dr. Ravindra AssociateProfessor Department of Commerce Indira Gandhi University, Meerpur, Rewari Email: ravindra.commerce@igu.ac.in 6/5/2021 Dr. Ravindra, IGU, Meerpur 1
  • 2.
    Meaning and Definitionof Research Hypothesis • Meaning Research hypothesis is tentative assumption made in order to draw out and test its logical or empirical consequences. As such the manner in which research hypothesis are developed is particularly important since they provide the focal point for research. • Definition “Hypothesis is a tentative generalization, the validity of which remains to be tested, in its most eliminatory stage it’s may be very hunchy, gussy and imaginative data which became the basis of action and investigation.” “A hypothesis in statistics is simply a quantitative statement about the population.” By: Prof. Morris Hamburg 6/5/2021 Dr. Ravindra, IGU, Meerpur 2
  • 3.
    Characteristics • Hypothesis shouldbe clear and specific. • Delimiting the research area. • Explain about, what type of data is required. • Guide about the statistical tool required. • Keep the researcher on right track. • It’s sharpening the thinking of researcher. • Hypothesis should be capable of being tested. • Hypothesis should be stated as far as possible in most simple terms. • Hypothesis should be amenable to testing within reasonable time. • Hypothesis must explain the facts that gave rise to the need for explanation. 6/5/2021 Dr. Ravindra, IGU, Meerpur 3
  • 4.
    How does onego about developing working hypothesis? • Discuss with colleagues and experts. • Examine the related data and concerned records if available. • Review of similar studies in the area of research. • Exploratory personal investigation. • Some time dreams/sixth sense of the researcher also play major role in developing the hypothesis. Thus, working hypothesis arise as result of a priori thinking about the subject, examination of the available data and the material including in related studies and the counsel of experts and interested parties. 6/5/2021 Dr. Ravindra, IGU, Meerpur 4
  • 5.
    Testing of Hypothesis Thetheory of hypothesis testing was introduced by Jerzey Neywman (1894-1981) and Egon Pearson (1895-1980) in letter half of 19 centaury. In inferential analysis, generalizations have to be drawn about the population parameters based upon the evidence obtained from the study of the sample. Hypothesis testing is a statistical tool that helps us in decision making in such a scenario. Statistical inference treats two different classes of problems: 1. Hypothesis testing i.e. to test some hypothesis about parent population from which sample is drawn. 2. Estimation i.e. to use the ‘statistics’ obtained from the sample as estimate of the unknown ‘parameter’ of the population from which the sample is drawn. 6/5/2021 Dr. Ravindra, IGU, Meerpur 5
  • 6.
    Procedure of Testingthe Hypothesis The procedure of testing hypotheses follows five sequential steps, which are as: 1. Set up the Hypothesis 2. Set up the significance level 3. Setting a test criterion 4. Doing calculations 5. Making decisions 6/5/2021 Dr. Ravindra, IGU, Meerpur 6
  • 7.
    Procedure of Testingthe Hypothesis 1. Set up the Hypothesis: In the context of statistical analysis, we often talk about null hypothesis and alternative hypothesis. The null hypothesis is a very useful tool in testing the significance of difference. In its simplest form the hypothesis asserts that there is no real difference in the sample and the population in the particular matter under consideration, hence, the word ‘null’ which means ‘invalid’, ‘void’ or ‘amounting to nothing’, and that the difference found is accidental and unimportant arising out of fluctuations of sampling. 6/5/2021 Dr. Ravindra, IGU, Meerpur 7
  • 8.
    Procedure of Testingthe Hypothesis As against the null hypothesis, the alternative hypothesis specifies those values that the researcher believes to hold true, and, of course, he hopes that the sample data leads to acceptance of this hypothesis as true. The null and alternative hypotheses are distinguished by the use of two different symbols i.e. Ho = Null Hypothesis Ha = Alternative Hypothesis 6/5/2021 Dr. Ravindra, IGU, Meerpur 8
  • 9.
    Procedure of Testingthe Hypothesis 2. Set up a Suitable Significance Level: The next step is to test the validity of Ho against that of Ha as at certain level of significance. The confidence with which an experimenter rejects or retains a null hypothesis depends upon the significance level adopted. The significance level generally express in a percentage i.e. 5% level of significance or 1% level of significance. At 5% level of significance the value of SE is 1.96, whereas, at 1% level the value of SE is 2.58. .95 ÷ 2 = .4750 or .99 ÷ 2 = .4950 6/5/2021 Dr. Ravindra, IGU, Meerpur 9
  • 10.
    Procedure of Testingthe Hypothesis 6/5/2021 Dr. Ravindra, IGU, Meerpur 10
  • 11.
    Procedure of Testingthe Hypothesis 3. Setting a Test Criterion: This involves selecting an appropriate probability distribution for the particular test. Some probability distributions that are commonly used in testing procedures are t- test, F-test, Chi-square test etc. 4. Doing Calculations: Having taken the first three steps, we have completely designed a statistical test. We now proceed to the fourth steps- performance of various computations- from a random sample of size n, necessary for the test. These calculations include the testing statistics and the standard error of testing statistics. 5. Making Decisions: Finally at fifth step, we may draw statistical conclusions and take decisions. A statistical conclusion or decision of rejection or acceptance the null hypothesis is as under: 6/5/2021 Dr. Ravindra, IGU, Meerpur 11
  • 12.
    Procedure of Testingthe Hypothesis Decision Criterion a. Test statistic approach Calculated test Statistics > Table Value, Ho Rejected Calculated test Statistics ≤ Table Value, Ho Accepted b. P-value approach If calculated P-value ≥ Critical Value i.e. 0.05, Ho is Accepted. If calculated P-value < Critical Value i.e. 0.05, Ho is Rejected. 6/5/2021 Dr. Ravindra, IGU, Meerpur 12
  • 13.
    Concepts Related toTesting the Hypothesis Type-I Error and Type-II Error Type-I Error: In a statistical hypothesis testing experiment, a Type-I error is committed by rejecting the null hypothesis when it is true. Type-I error is denoted by ‘α’. Type-II Error: The Type-II error is committed by not rejecting the null hypothesis when it is false. The probability of committing a Type-II is denoted by ‘β’. 6/5/2021 Dr. Ravindra, IGU, Meerpur 13
  • 14.
    Concepts Related toTesting the Hypothesis Accept Ho Reject Ho Ho is True Correct Decision Type-I Error [Confidence Level (1-α)] [Critical Value – α] Ho is False Type – II Error Correct Decision [β ] [Power of the Test (1-β)] 6/5/2021 Dr. Ravindra, IGU, Meerpur 14
  • 15.
    Two- tailed andOne-tailed test of Hypothesis • Two-tailed test: When rejection region/criterion is locating on both side of the distribution then it is the case of two-tailed test i.e. Ha: u ≠ uo 6/5/2021 Dr. Ravindra, IGU, Meerpur 15
  • 16.
    Continue…. • One-tailed test:When the decision region/criterion locates on one side of the distribution, then it is the case of one-tailed i.e. Ha: u > uo or Ha: u < uo 6/5/2021 Dr. Ravindra, IGU, Meerpur 16
  • 17.
    Standard Errors Standard Error:Standard deviation of sampling distribution is called the standard error. Sampling Distribution: If we select number of samples of same size from a given population, and calculate some statistics (like mean, mode, SD etc.) from each sample, we shall get a series of values of these statistics. These values obtained from different samples can be put in the form of a frequency distribution. The distribution so formed of all possible values of a statistics is called ‘sampling distribution’. Universe Distribution: Such a distribution emerges when each and every item of the universe is studied, and we have full knowledge of its mean and standard deviation. 6/5/2021 Dr. Ravindra, IGU, Meerpur 17
  • 18.
    Standard Errors Sample Distribution:If instead of all the items of the universe we study only a small part of it i.e. takes a sample, we arrived at a distribution which technically called a sample distribution. Properties of Sampling Distribution 1. The arithmetic mean of the sampling distribution is the same as the mean of the universe from which samples were taken. 2. The sampling distribution of mean has a standard deviation equal to the population standard deviation by the square root of the sample size. 3. The sampling distribution of means is normally distributed. 6/5/2021 Dr. Ravindra, IGU, Meerpur 18
  • 19.
    Utility of StandardDeviation Utilities of S.D. 1. It is used as an instrument in testing the hypothesis. 2. Standard error provides the idea about the unreliability of a sample. The greater the SE, the greater is the departure of actual frequency from the expected ones hence the greater the unreliability of the sample. The reciprocal of S.E., is a measure of reliability of the sample. 3. With the help of S.E. we can determine the limits within which the parameter values are expected to lie i.e. Mean± 3 S.E. will gives you 99.73% values. 6/5/2021 Dr. Ravindra, IGU, Meerpur 19
  • 20.
    (Appendix) Normal DistributionTable 6/5/2021 Dr. Ravindra, IGU, Meerpur 20
  • 21.
    (Appendix) Appropriate Toolsfor Casual Association Sr. No. Dependent Variable Independent Variable Tool for Analysis 1. Metric Metric Regression 2. Metric Metric and Non- metric Regression 3. Metric Non-metric variable with Two Categories t-test 4. Metric Non-metric Variable with More than two Categories ANOVA 5. Metric More than one Non-metric Factorial Design Independent Variable (one-way ANOVA) 6. More than one One or more non-metric MANOVA Metric Variable Independent Variable 7. Non-metric Metric Discriminant Analysis 8. Non-metric Non-metric Chi-Square Test 6/5/2021 Dr. Ravindra, IGU, Meerpur 21
  • 22.
    Research Hypothesis Thank You! 6/5/2021 Dr. Ravindra, IGU, Meerpur 22