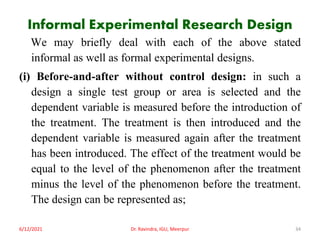
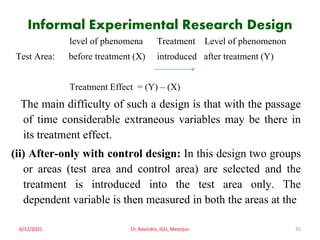
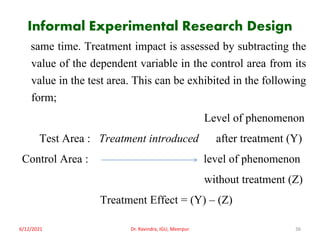
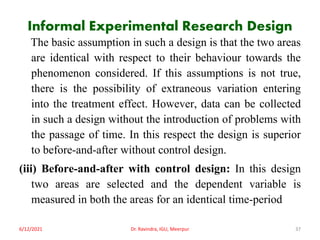
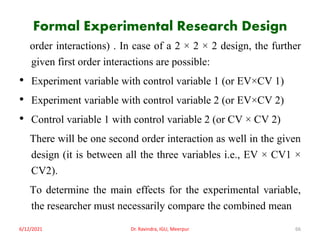
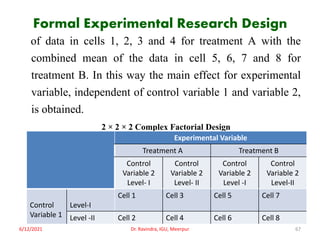
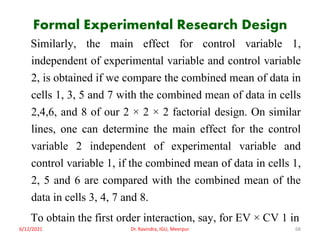
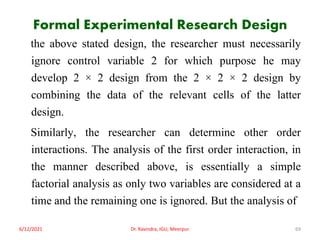
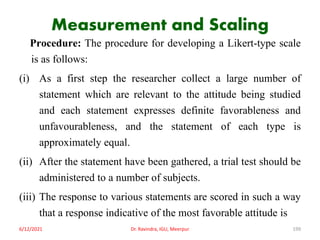
This document discusses the concept of research design, defining it as the structured plan for data collection and analysis tailored to specific research purposes. It outlines key components, features of effective designs, and the need for careful planning to ensure reliability and minimize errors. Additionally, it describes different types of research designs, including exploratory, descriptive/diagnostic, and experimental designs, while emphasizing principles such as replication, randomization, and control for reliable results.

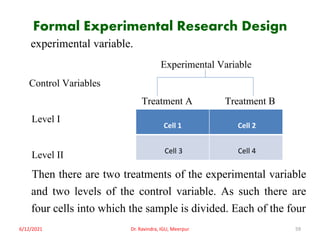


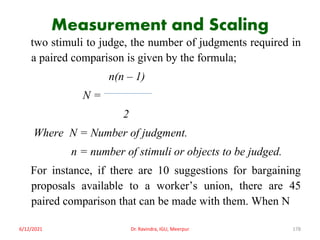


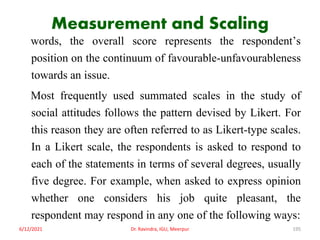
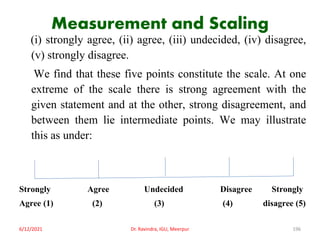
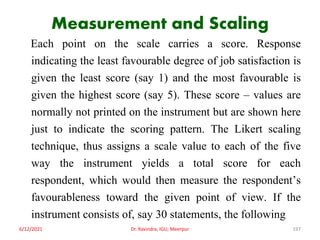
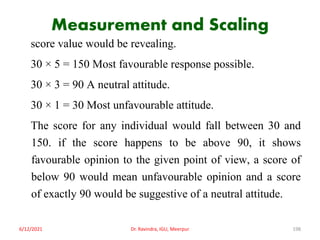
![Measurement and Scaling
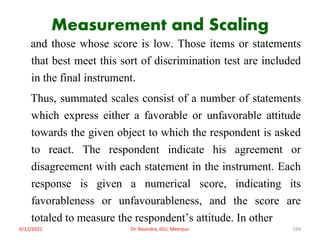
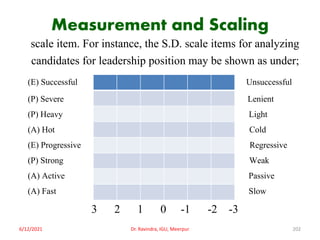
+5 +5 +5
+4 +4 +4
+3 +3 [+3]
+2 +2 +2
[ +1] +1 +1
Tasty Food Fast Service Good Ambience
-1 -1 -1
-2 [-2] -2
-3 -3 -3
-4 -4 -4
-5 -5 -5
6/12/2021 Dr. Ravindra, IGU, Meerpur 208](https://image.slidesharecdn.com/businessresearchmethodsppts-11-210612120215/85/Business-research-methods-pp-ts-11-208-320.jpg)