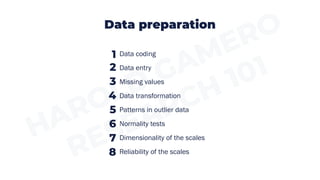
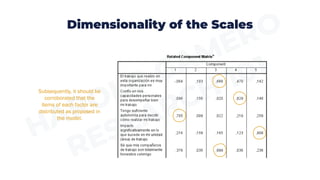
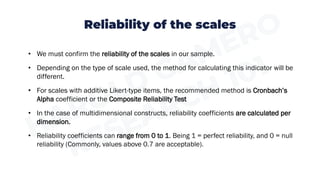
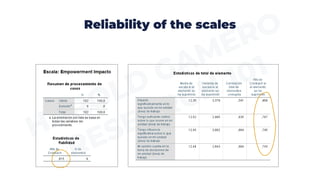
Research 101: Data Preparation
Harold Gamero
Data preparation
Data coding
Data entry
Missing values
Data transformation
Patterns in outlier data
Normality tests
Dimensionality of the scales
Reliability of the scales
1
2
3
4
5
6
7
8
Data Coding
• Coding is the process of converting data to numerical values.
• A codebook is a document that details the scales of each variable, the responses to each
item and what numerical values correspond to each response category.
• In some cases, it is possible to directly code the respondent's answer (age, income).
• Sometimes it is necessary to assign values to represent each variable (sex, profession).
• Qualitative results (such as interviews) cannot be “coded” and analysed statistically.
Data Coding
Data Entry
• Data can be entered into spreadsheets, databases or specialized statistical programs
(SPSS, Mplus, Stata, R, etc.).
• In the case of SPSS, rows represent individuals and columns represent variables, items
or response categories.
• The data entered should be constantly monitored for errors or invalid questionnaires (e.g.
meaningless patterns: all 1 or 5).
• Surveys with these errors should be discarded from further statistical analysis.
Missing Values
• Missing values may be unavoidable.
• Identify whether they appear randomly or show a pattern.
• If there is a pattern, the problem lies in the instrument or in the method applied (pilot
test).
• Examine the extent of the missing data.
• Select the way in which these values will be (not) used.
• By default, programs delete questionnaires with missing data (listwise deletion).
• Some allow the estimation and replacement of them (imputation).
• 2 types of unbiased imputation: maximum likelihood and multiple imputation methods.
Data Transformation
In some cases, data must be presented in a different way than collected.
For example:
➢ Scales that have items posed inversely
➢ Items that must be summed to obtain scores per dimension or variable
➢ Variables to be aggregated to obtain indexes
➢ Data that should be grouped into categories or ranges (age groups)
Patterns in Outlier Data
• Atypical data may appear due to:
➢ Errors in the data collection process
➢ Accumulated effect of external factors
➢ Extraordinary events
➢ Extraordinary remarks
• Outliers should be excluded from the analysis when they are an error (e.g., illogical or
erroneously entered responses).
• Outliers can be identified using steam & leaf plots.
Patterns in Outlier Data
Outliers
Less
dispersion
More
dispersion
Normality Test
• To use the normal statistical indicators (parametric statistics), we must verify that the
statistical assumptions are met.
• For this we can use:
Histograms Q-Q normality plots
Normality Test
• To use the normal statistical indicators (parametric statistics), we must verify that the
statistical assumptions are met.
• For this we can use:
Kolmogorov–Smirnov
test
Shapiro–Wilk test
Dimensionality of the Scales
• The next step is to verify that the items of our scales have been correctly distributed
across the dimensions of the construct of interest.
• For example, Empowerment is a multidimensional construct with 5 factors or
dimensions (Spreitzer, 1995):
➢ Meaning
➢ Competition
➢ Self-determination
➢ Impact
➢ Security
Dimensionality of the Scales
Confirmatory Factor
Analysis (CFA)
shows the presence of 5
factors or dimensions.
Dimensionality of the Scales
Subsequently, it should be
corroborated that the
items of each factor are
distributed as proposed in
the model.
Reliability of the scales
• We must confirm the reliability of the scales in our sample.
• Depending on the type of scale used, the method for calculating this indicator will be
different.
• For scales with additive Likert-type items, the recommended method is Cronbach’s
Alpha coefficient or the Composite Reliability Test
• In the case of multidimensional constructs, reliability coefficients are calculated per
dimension.
• Reliability coefficients can range from 0 to 1. Being 1 = perfect reliability, and 0 = null
reliability (Commonly, values above 0.7 are acceptable).
Reliability of the scales
Thank you.
Harold Gamero

Research 101: Quantitative Data Preparation

  • 1.
    Research 101: DataPreparation Harold Gamero
  • 2.
    Data preparation Data coding Dataentry Missing values Data transformation Patterns in outlier data Normality tests Dimensionality of the scales Reliability of the scales 1 2 3 4 5 6 7 8
  • 3.
    Data Coding • Codingis the process of converting data to numerical values. • A codebook is a document that details the scales of each variable, the responses to each item and what numerical values correspond to each response category. • In some cases, it is possible to directly code the respondent's answer (age, income). • Sometimes it is necessary to assign values to represent each variable (sex, profession). • Qualitative results (such as interviews) cannot be “coded” and analysed statistically.
  • 4.
  • 5.
    Data Entry • Datacan be entered into spreadsheets, databases or specialized statistical programs (SPSS, Mplus, Stata, R, etc.). • In the case of SPSS, rows represent individuals and columns represent variables, items or response categories. • The data entered should be constantly monitored for errors or invalid questionnaires (e.g. meaningless patterns: all 1 or 5). • Surveys with these errors should be discarded from further statistical analysis.
  • 6.
    Missing Values • Missingvalues may be unavoidable. • Identify whether they appear randomly or show a pattern. • If there is a pattern, the problem lies in the instrument or in the method applied (pilot test). • Examine the extent of the missing data. • Select the way in which these values will be (not) used. • By default, programs delete questionnaires with missing data (listwise deletion). • Some allow the estimation and replacement of them (imputation). • 2 types of unbiased imputation: maximum likelihood and multiple imputation methods.
  • 7.
    Data Transformation In somecases, data must be presented in a different way than collected. For example: ➢ Scales that have items posed inversely ➢ Items that must be summed to obtain scores per dimension or variable ➢ Variables to be aggregated to obtain indexes ➢ Data that should be grouped into categories or ranges (age groups)
  • 8.
    Patterns in OutlierData • Atypical data may appear due to: ➢ Errors in the data collection process ➢ Accumulated effect of external factors ➢ Extraordinary events ➢ Extraordinary remarks • Outliers should be excluded from the analysis when they are an error (e.g., illogical or erroneously entered responses). • Outliers can be identified using steam & leaf plots.
  • 9.
    Patterns in OutlierData Outliers Less dispersion More dispersion
  • 10.
    Normality Test • Touse the normal statistical indicators (parametric statistics), we must verify that the statistical assumptions are met. • For this we can use: Histograms Q-Q normality plots
  • 11.
    Normality Test • Touse the normal statistical indicators (parametric statistics), we must verify that the statistical assumptions are met. • For this we can use: Kolmogorov–Smirnov test Shapiro–Wilk test
  • 12.
    Dimensionality of theScales • The next step is to verify that the items of our scales have been correctly distributed across the dimensions of the construct of interest. • For example, Empowerment is a multidimensional construct with 5 factors or dimensions (Spreitzer, 1995): ➢ Meaning ➢ Competition ➢ Self-determination ➢ Impact ➢ Security
  • 13.
    Dimensionality of theScales Confirmatory Factor Analysis (CFA) shows the presence of 5 factors or dimensions.
  • 14.
    Dimensionality of theScales Subsequently, it should be corroborated that the items of each factor are distributed as proposed in the model.
  • 15.
    Reliability of thescales • We must confirm the reliability of the scales in our sample. • Depending on the type of scale used, the method for calculating this indicator will be different. • For scales with additive Likert-type items, the recommended method is Cronbach’s Alpha coefficient or the Composite Reliability Test • In the case of multidimensional constructs, reliability coefficients are calculated per dimension. • Reliability coefficients can range from 0 to 1. Being 1 = perfect reliability, and 0 = null reliability (Commonly, values above 0.7 are acceptable).
  • 16.
  • 17.