Downloaded 890 times
![Seminar 5 Data Collection, Preparation and Analysis Using SPSS By Dr. Muhammad Ramzan [email_address] , 03004487844 Edited by Ahsan Khan Eco [email_address] 03008046243](https://image.slidesharecdn.com/week5-datacollectionpreparationandanalysis-120210051601-phpapp01/75/Business-Research-Methods-data-collection-preparation-and-analysis-1-2048.jpg)
![You are good students-NOW PRACTICE By Dr. Muhammad Ramzan [email_address] , 03004487844 Edited by Ahsan Khan Eco [email_address] 03008046243](https://image.slidesharecdn.com/week5-datacollectionpreparationandanalysis-120210051601-phpapp01/75/Business-Research-Methods-data-collection-preparation-and-analysis-43-2048.jpg)

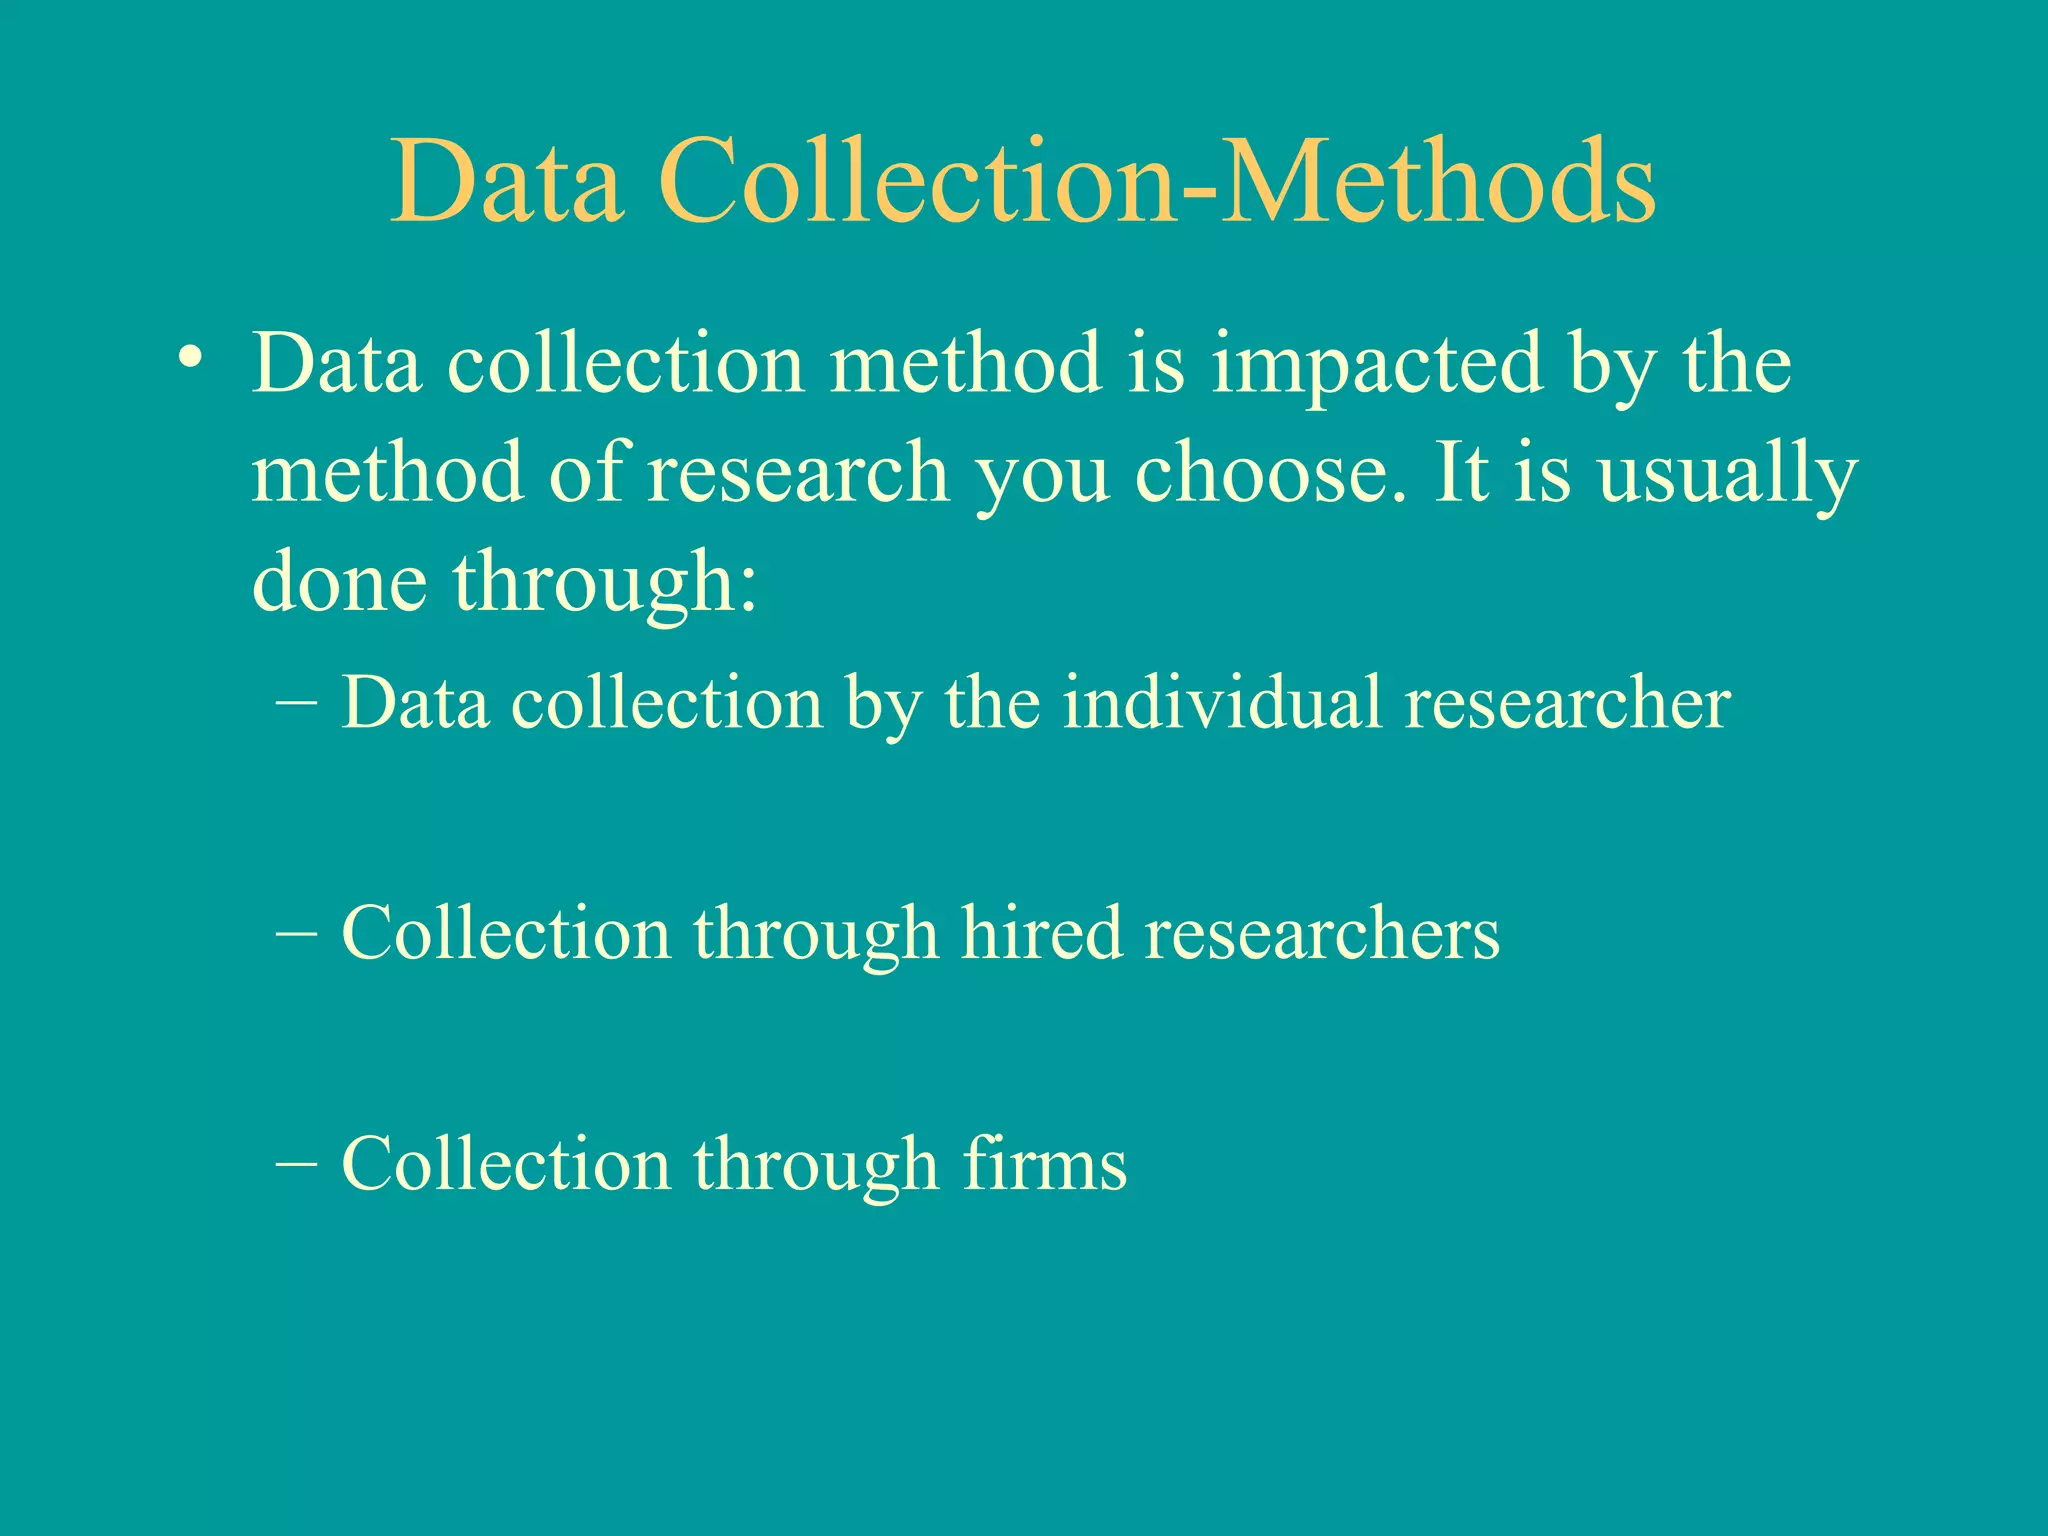
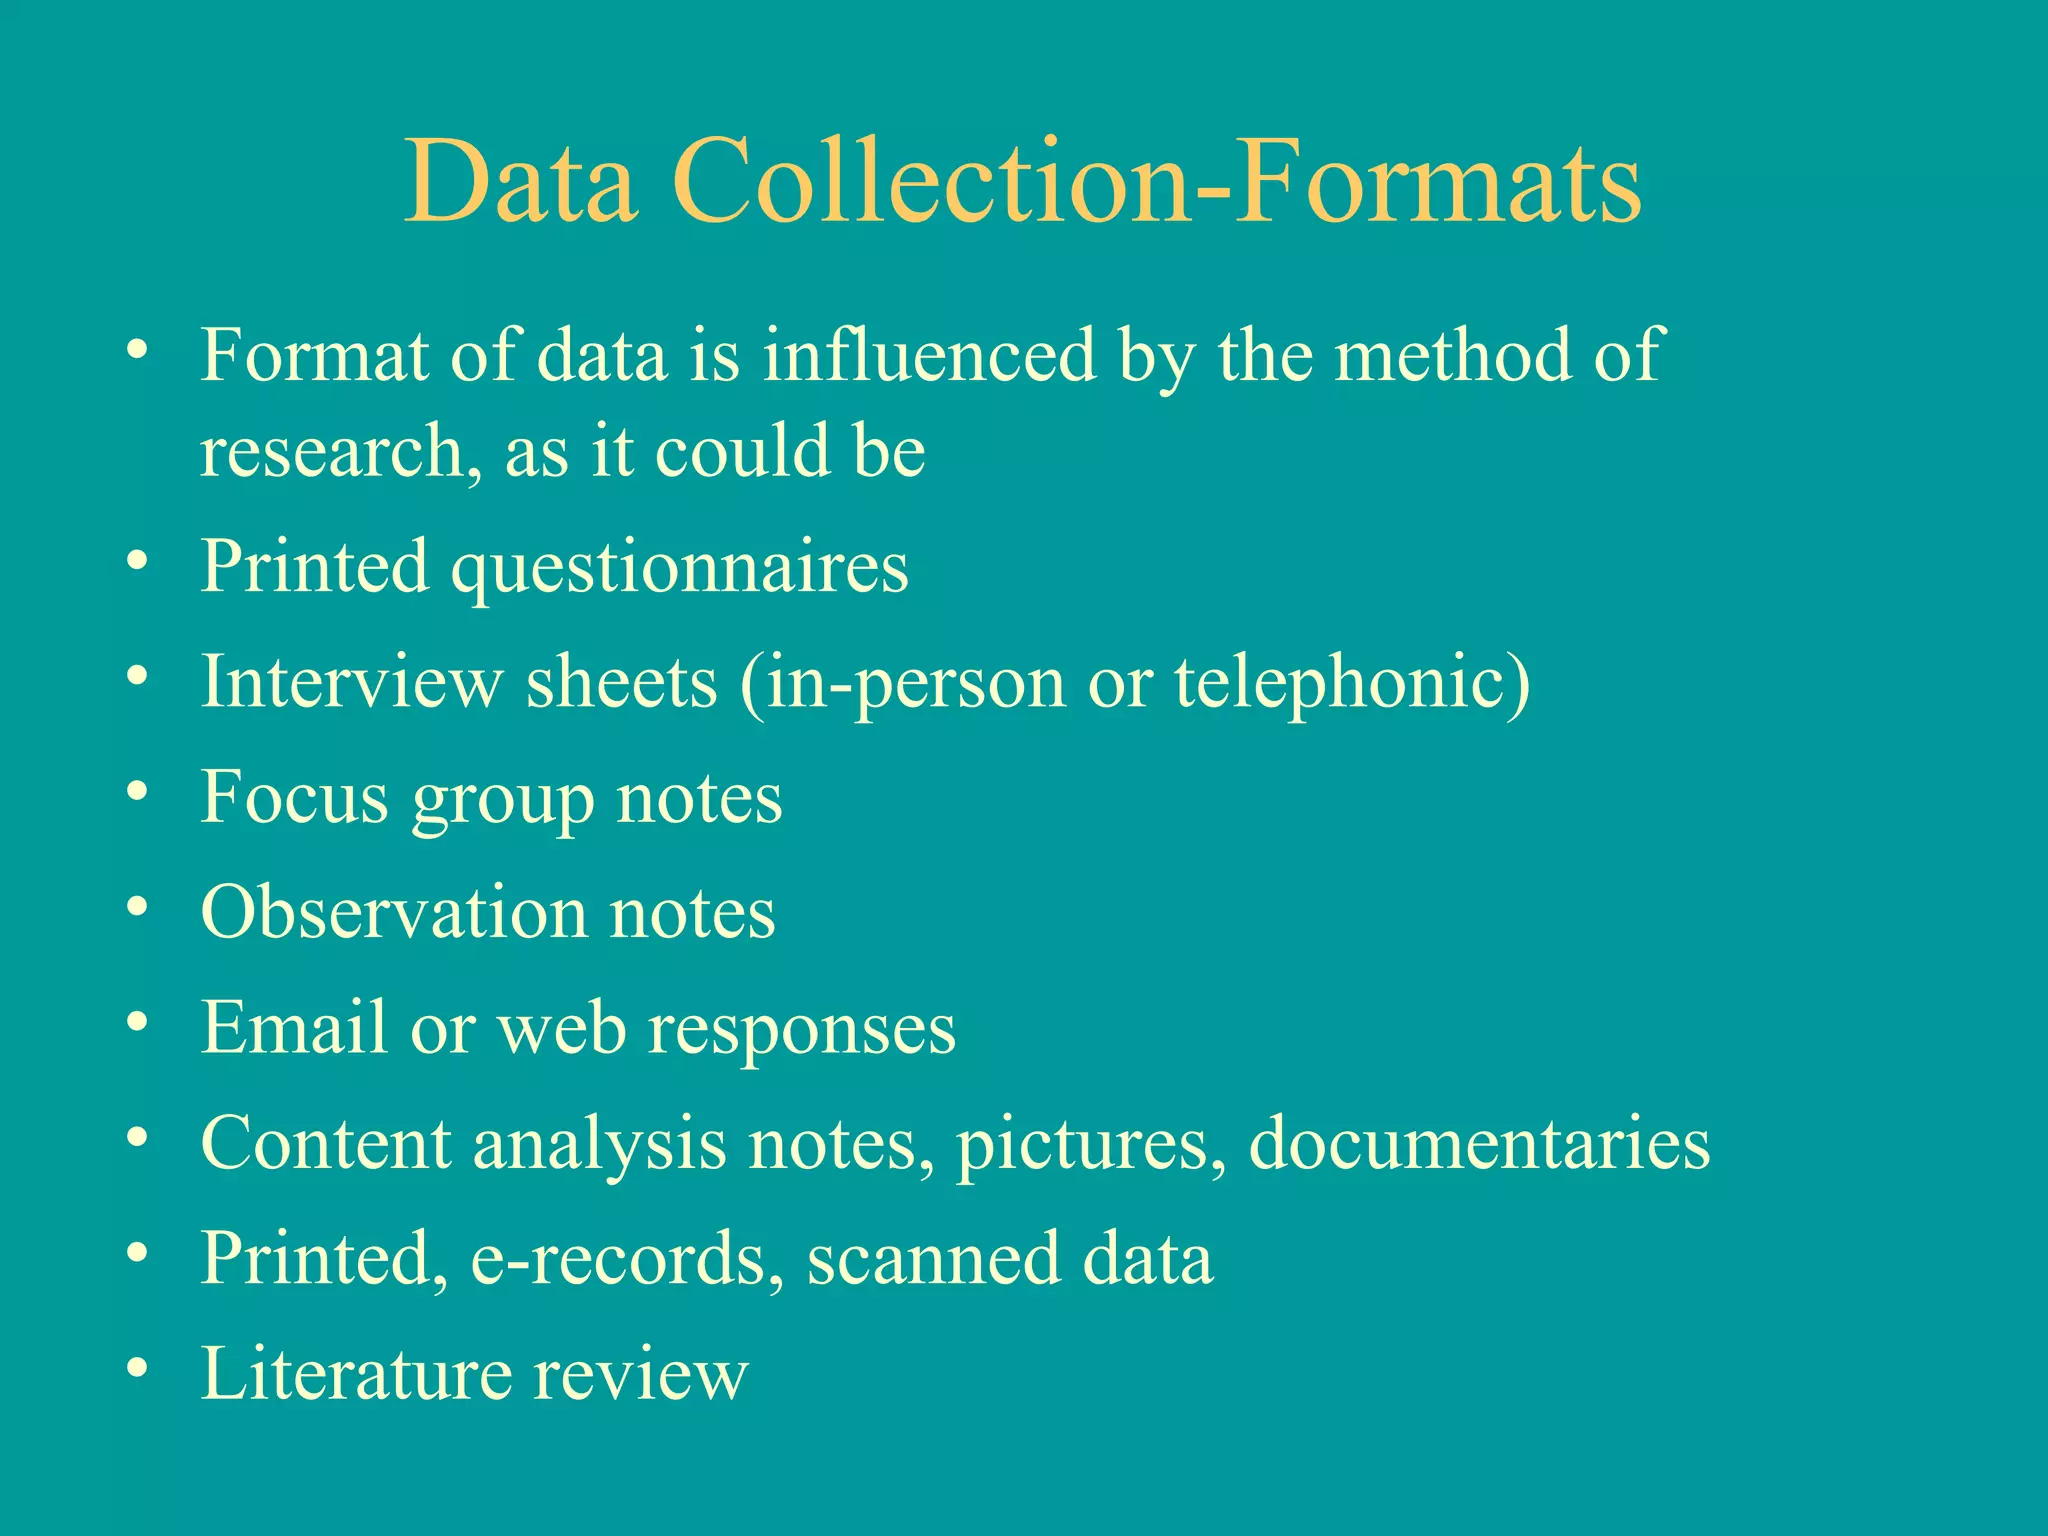
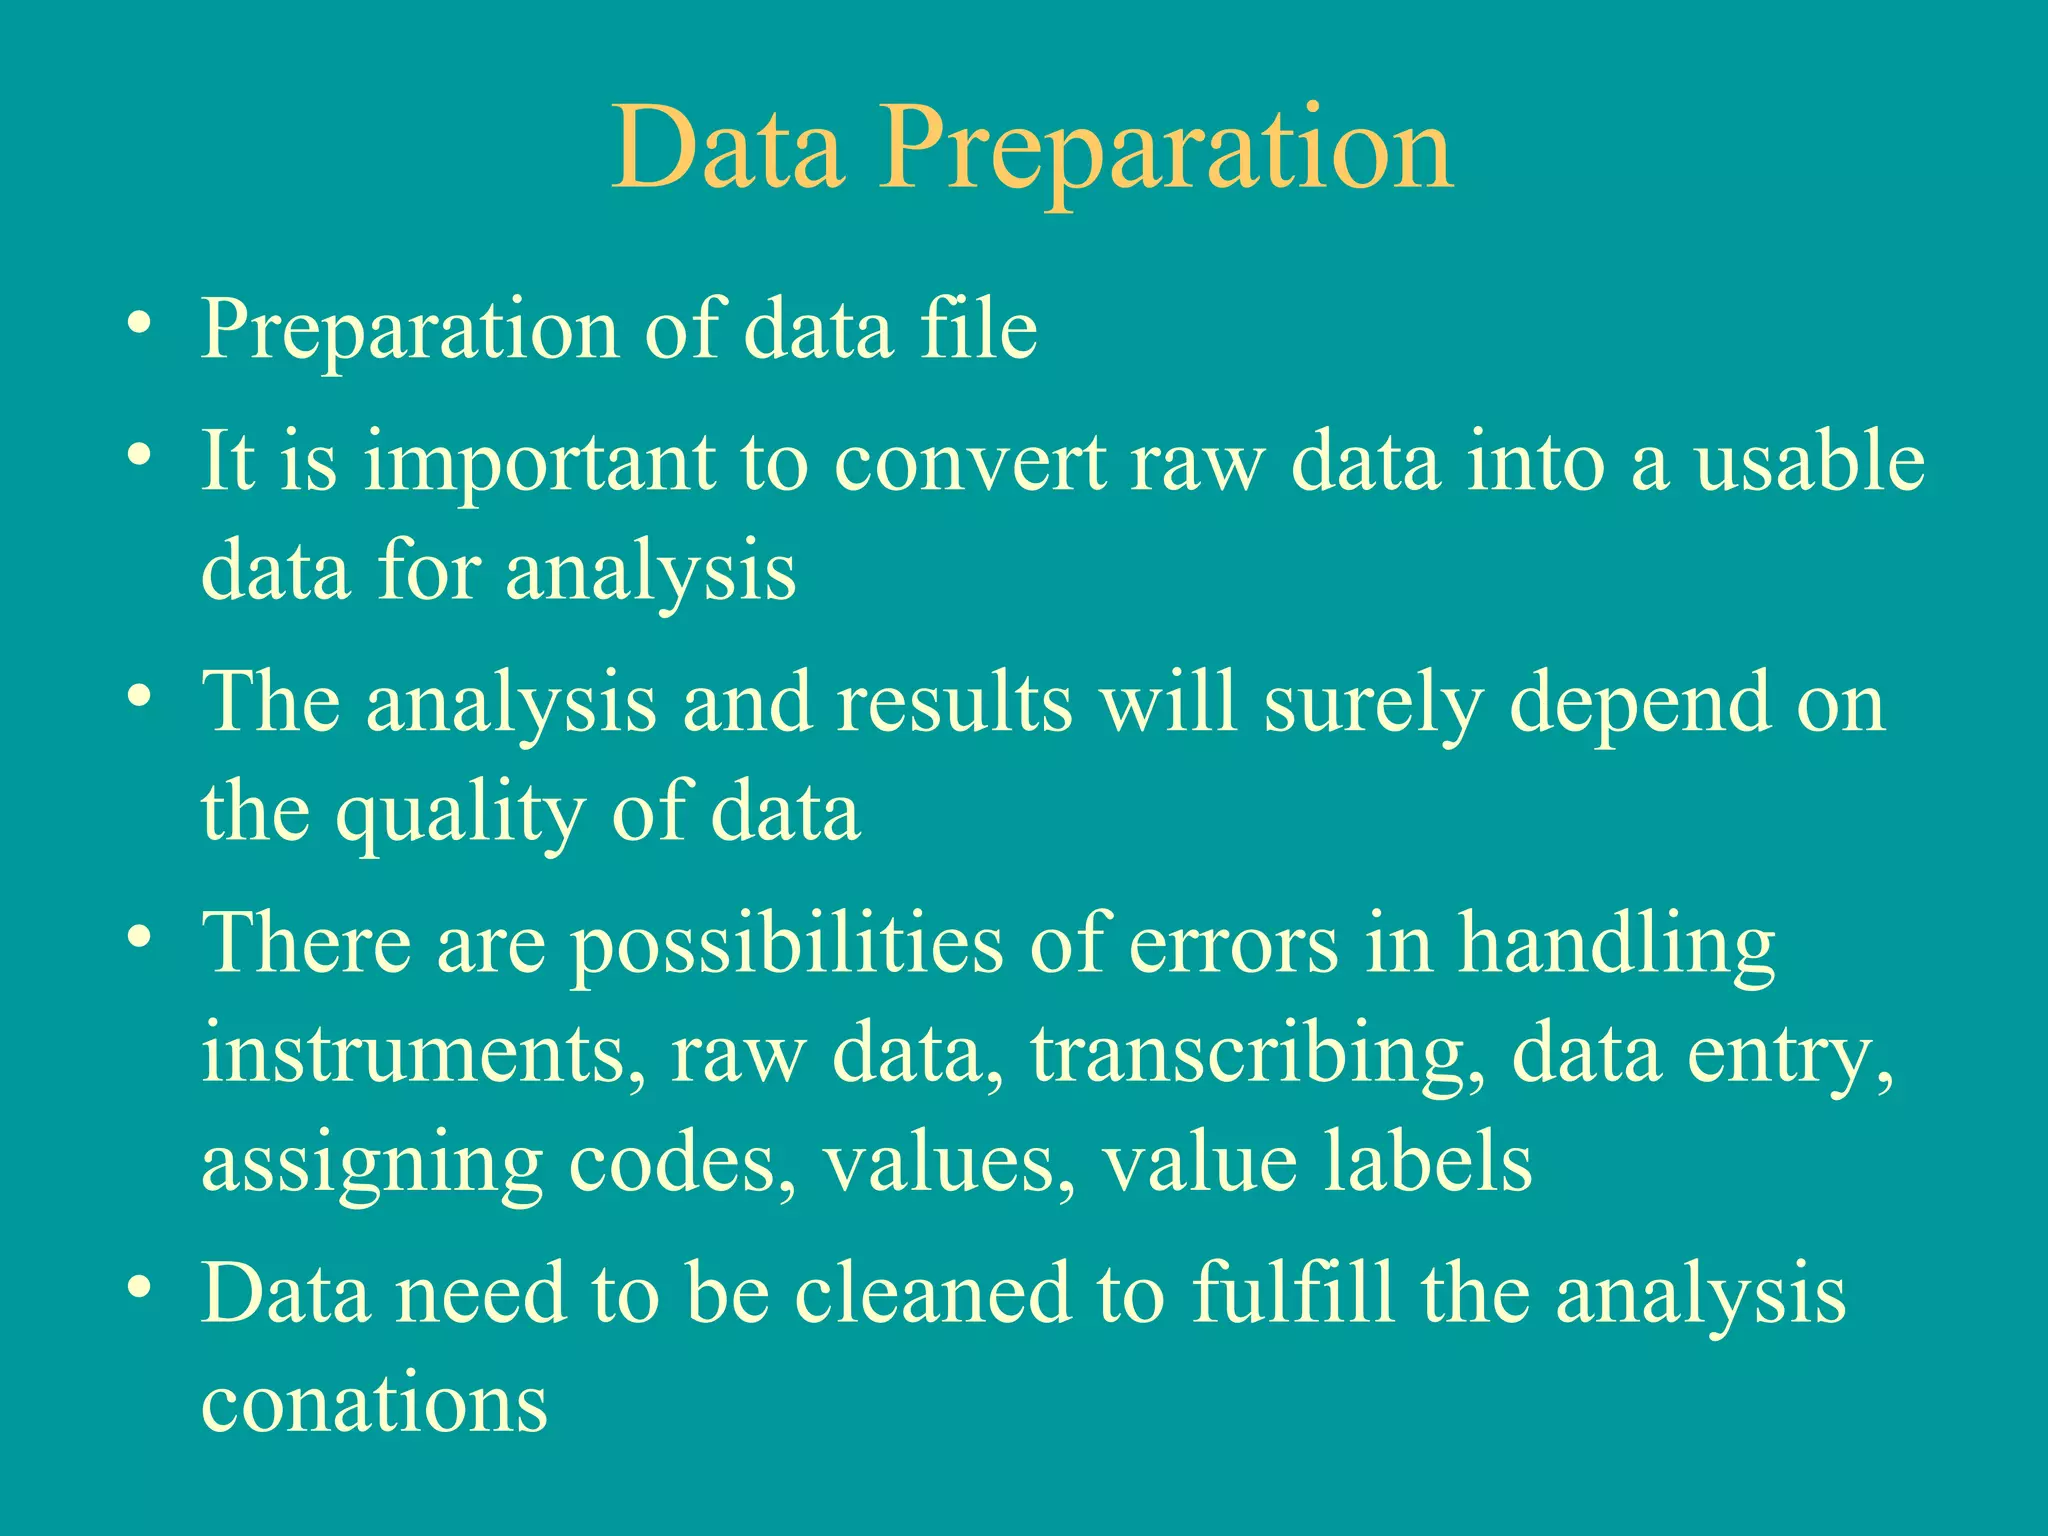
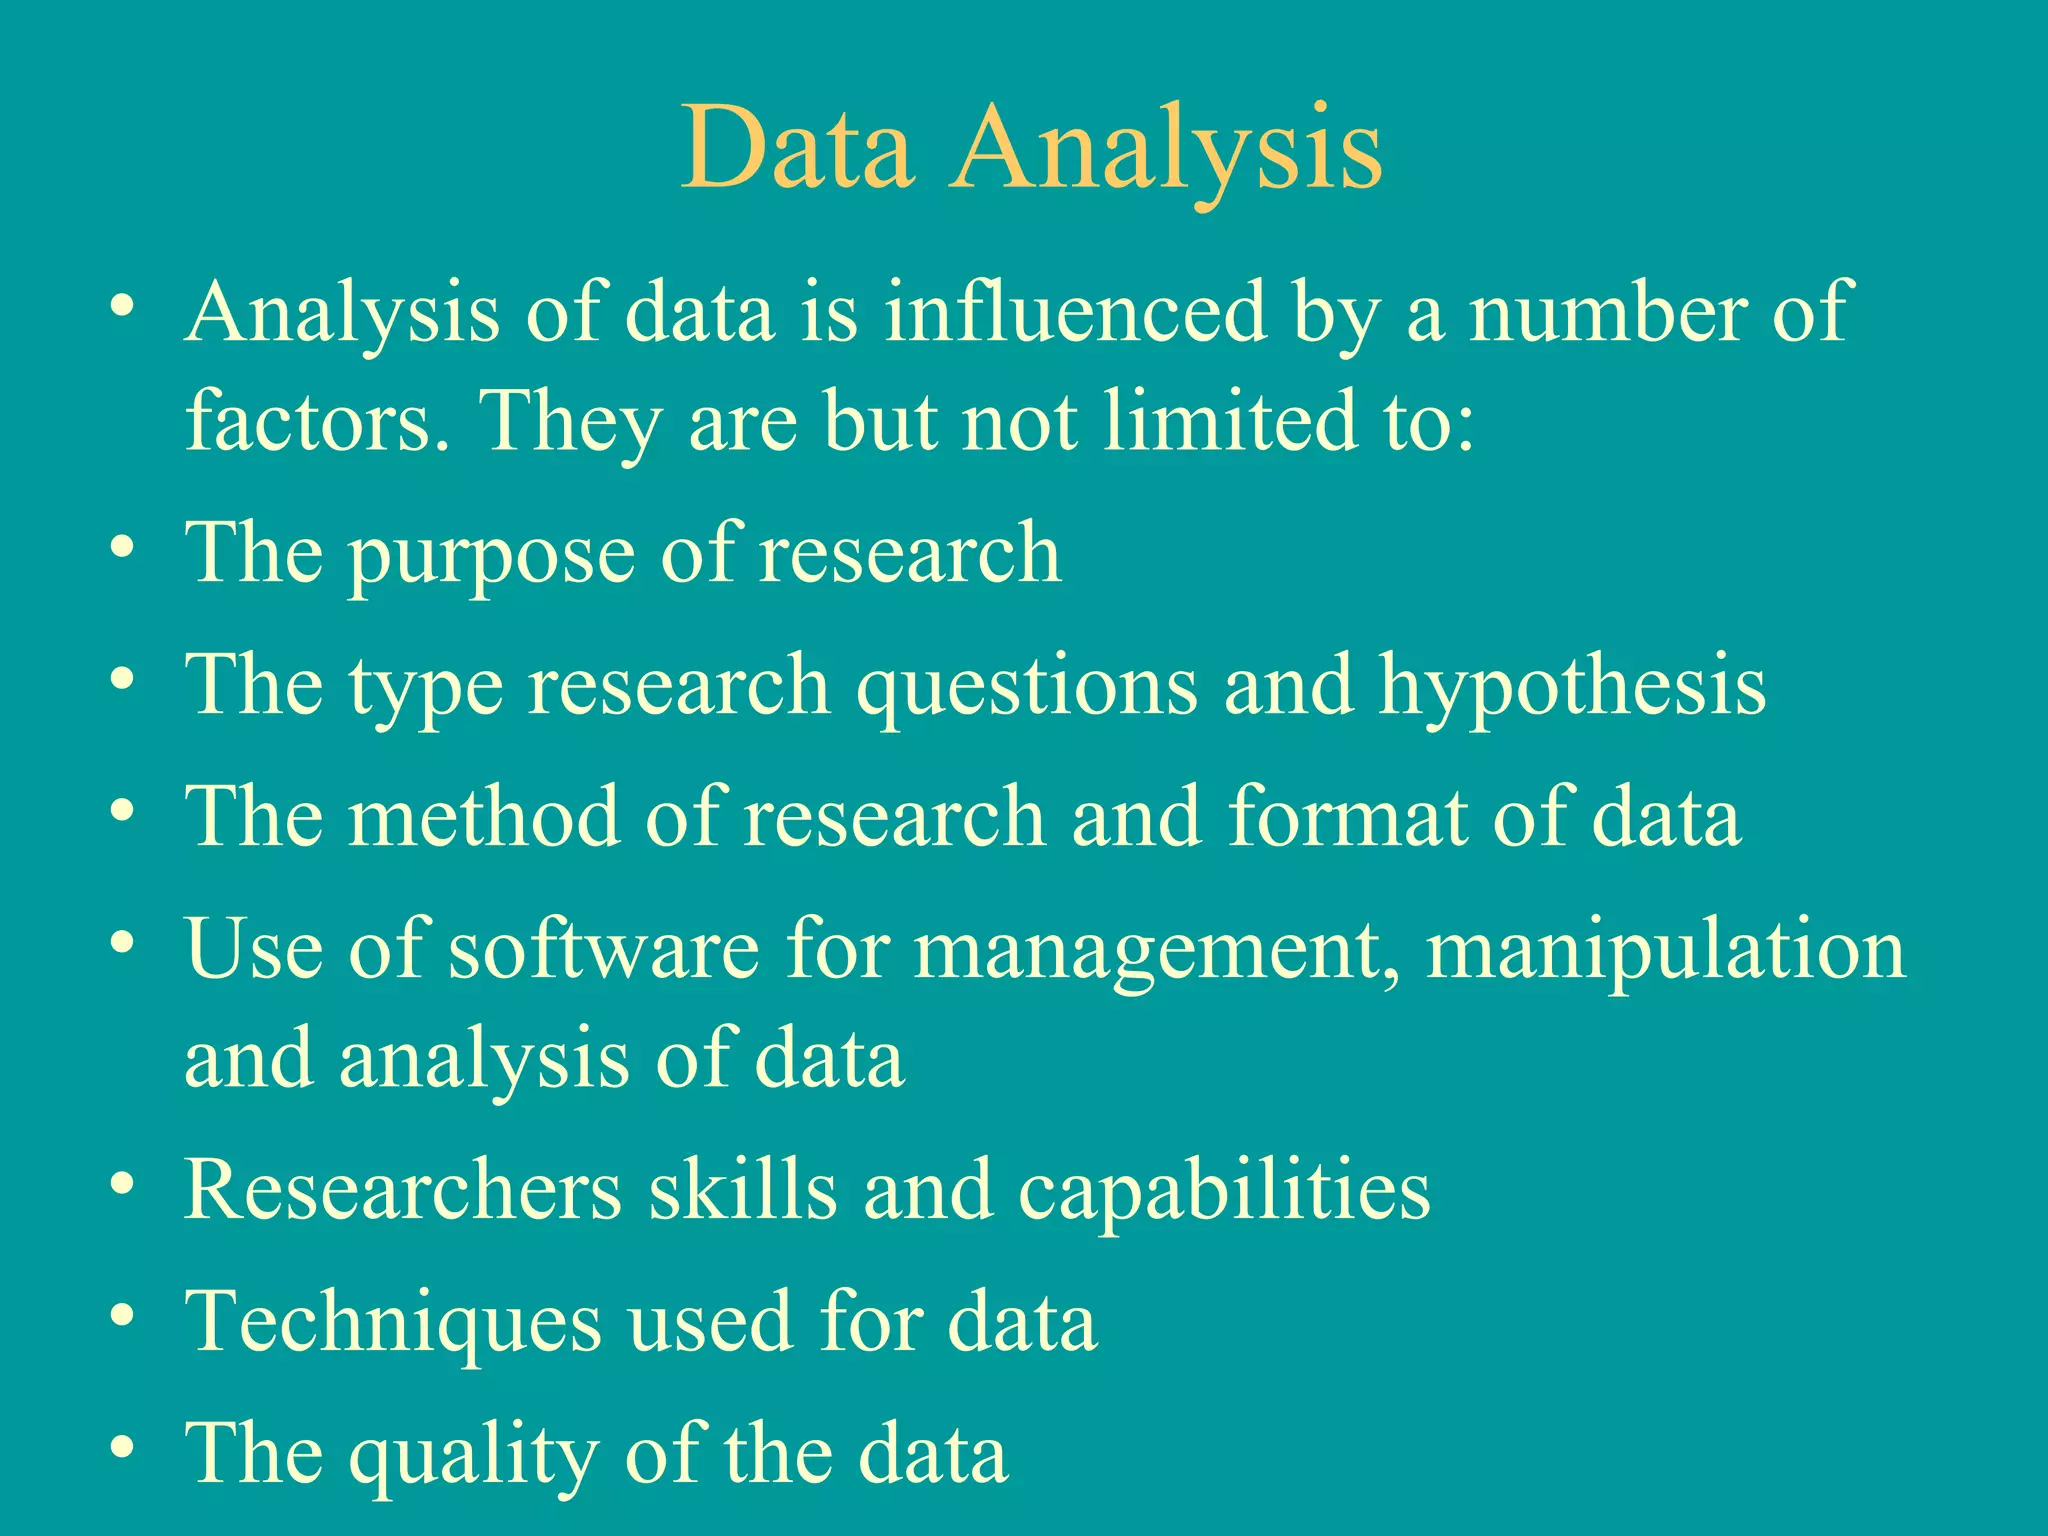
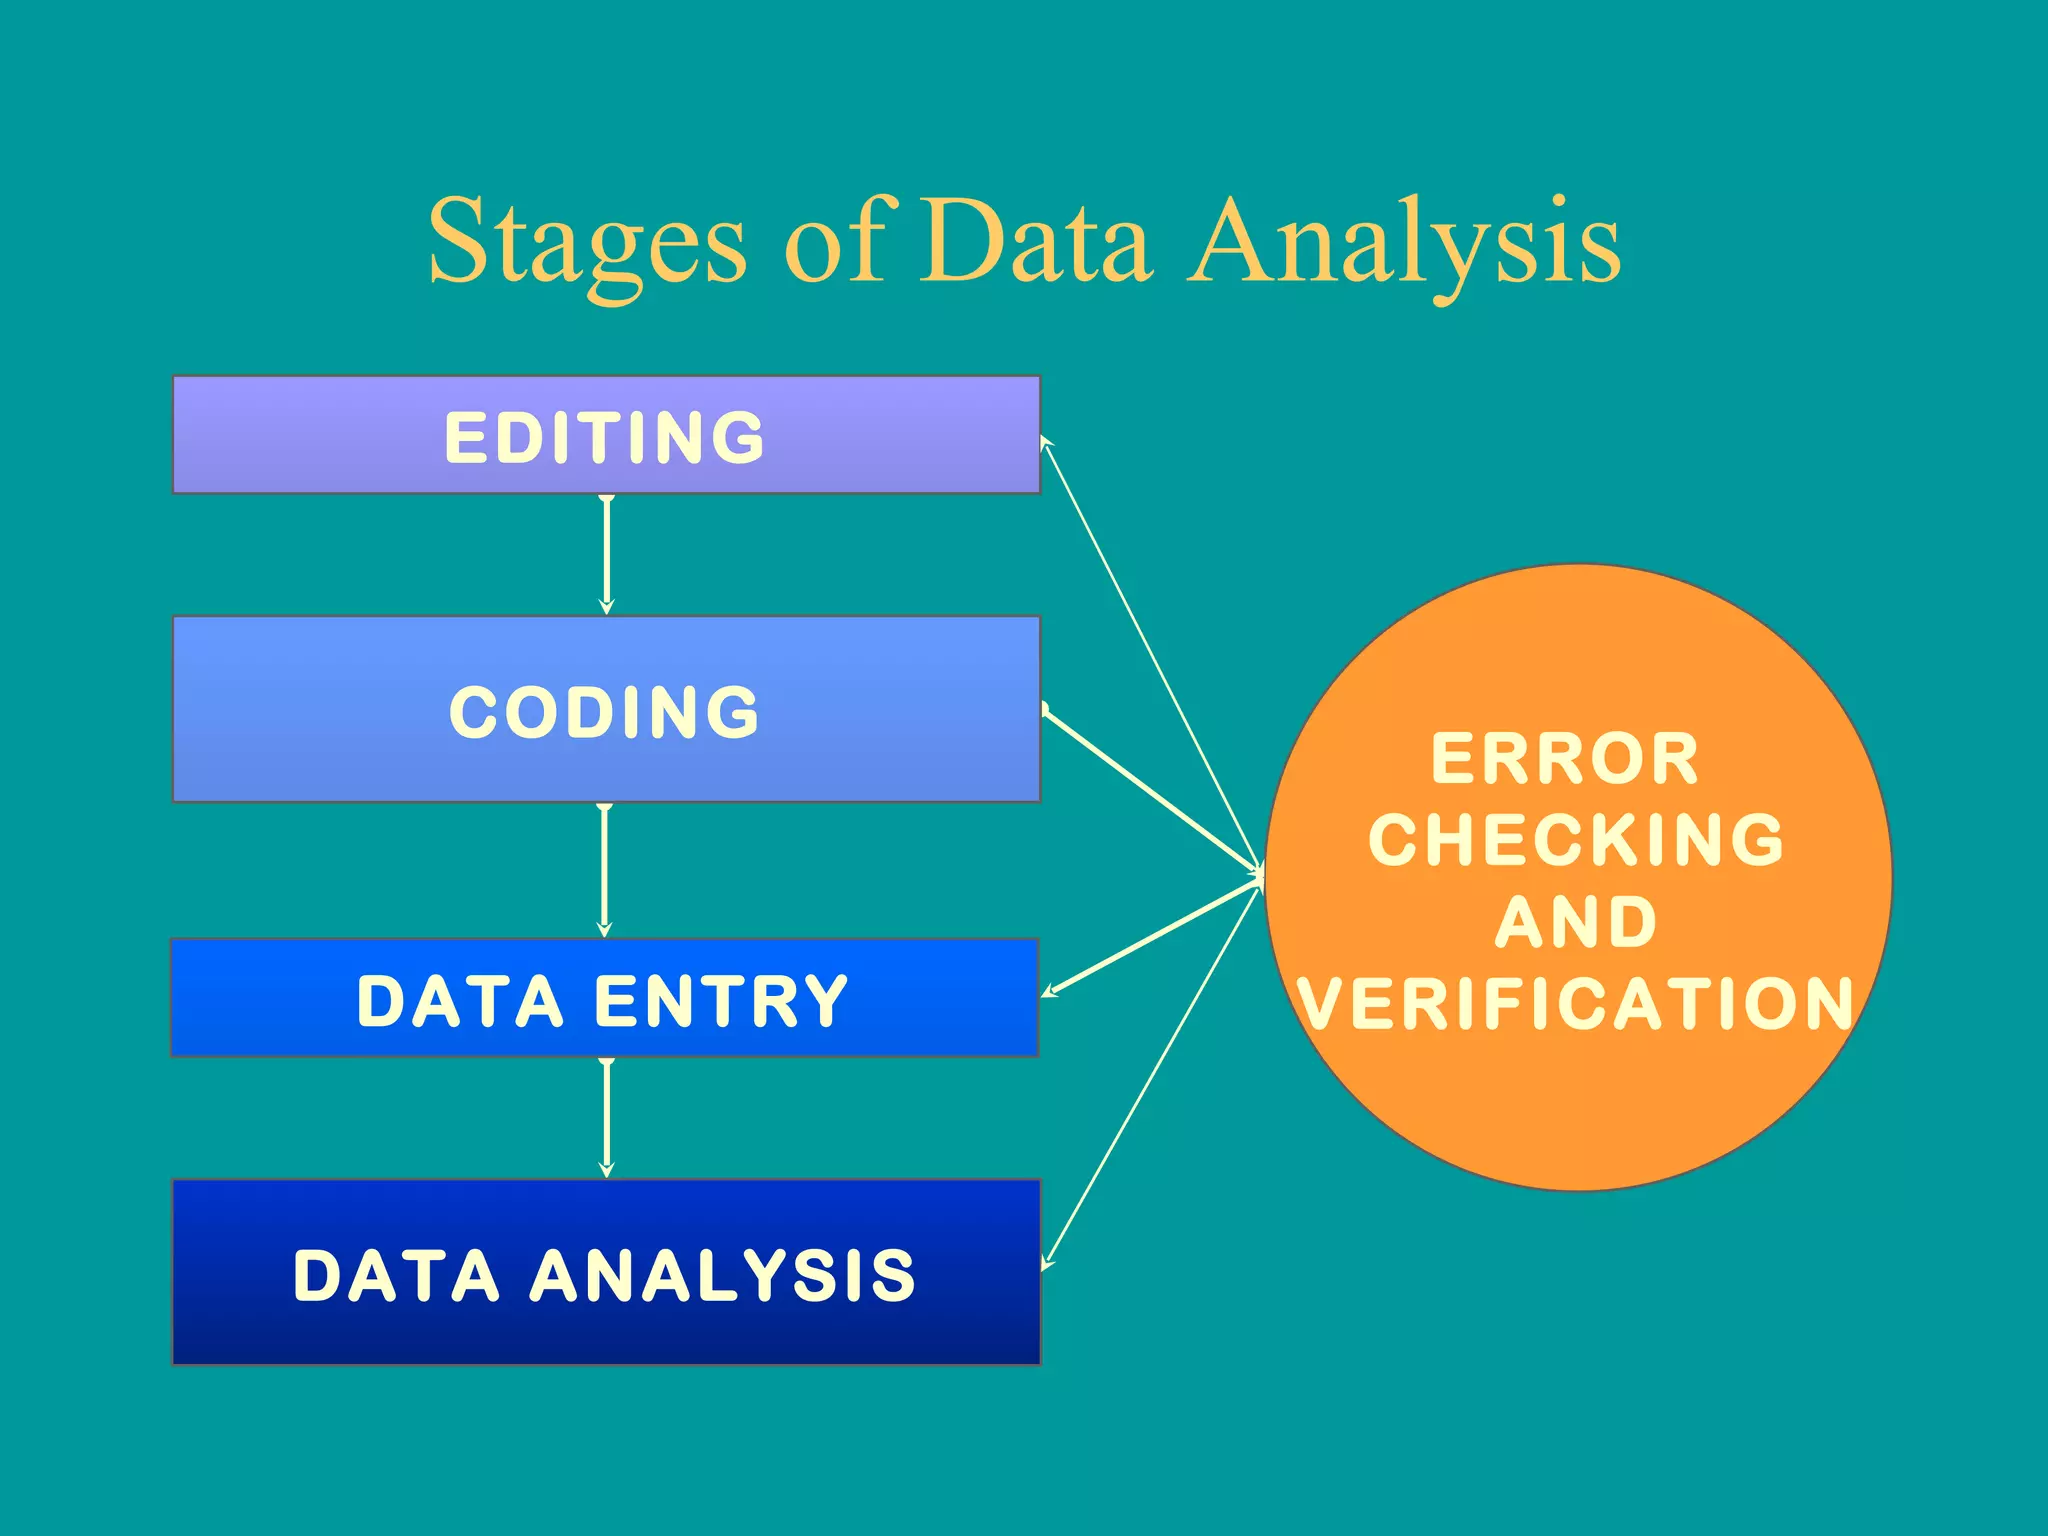
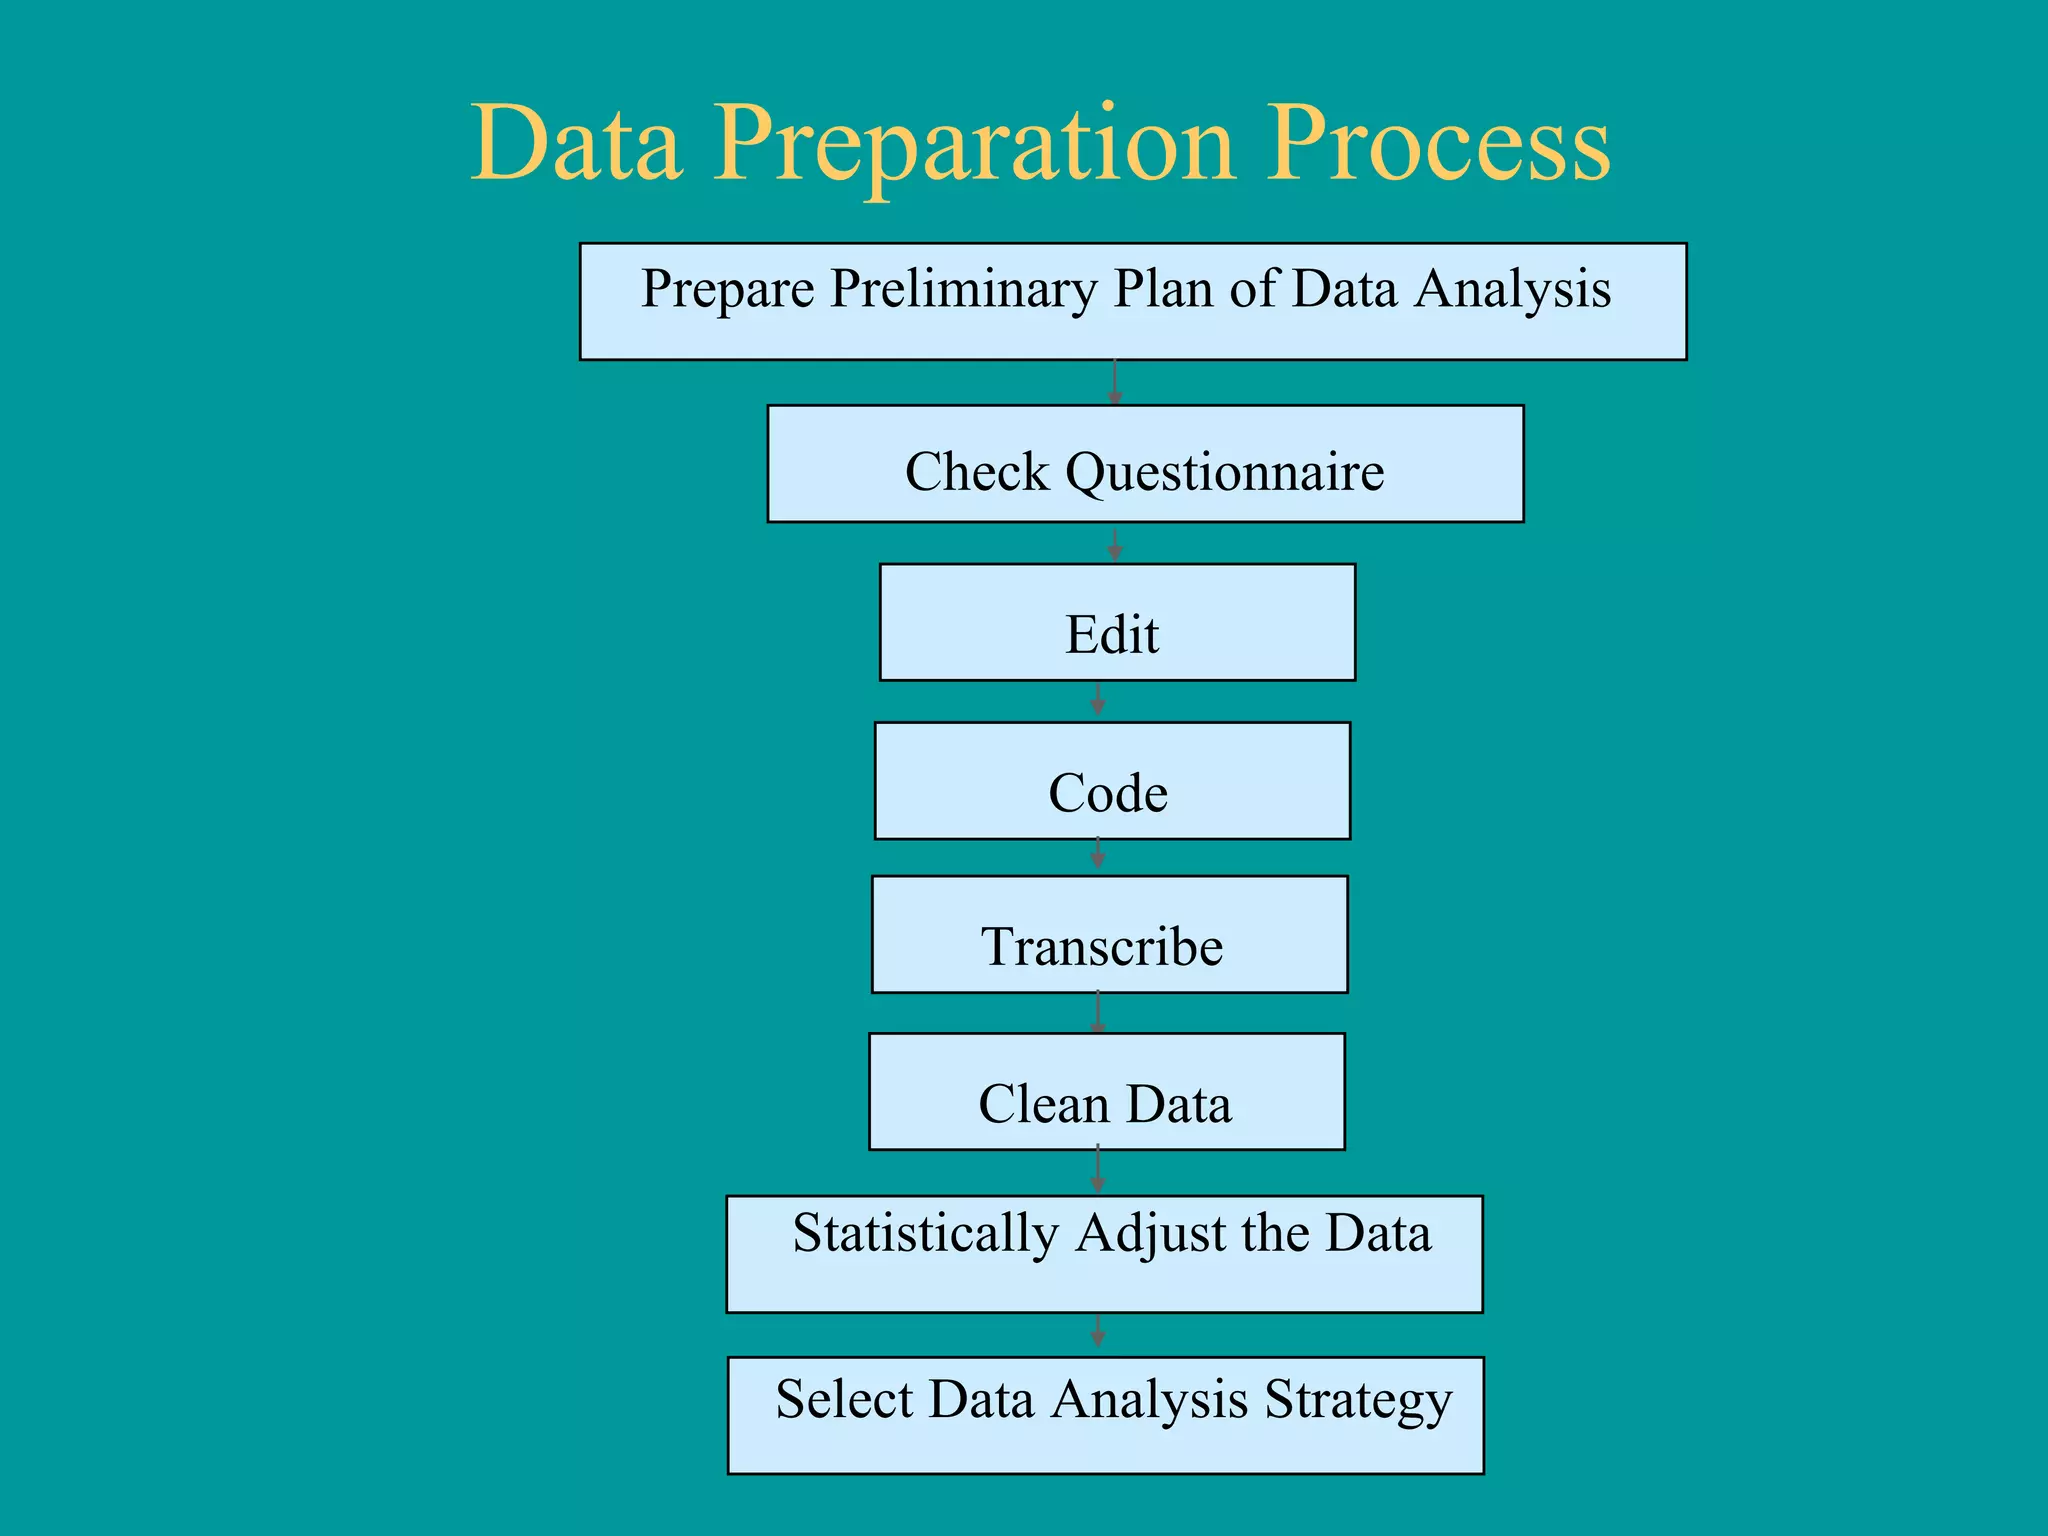
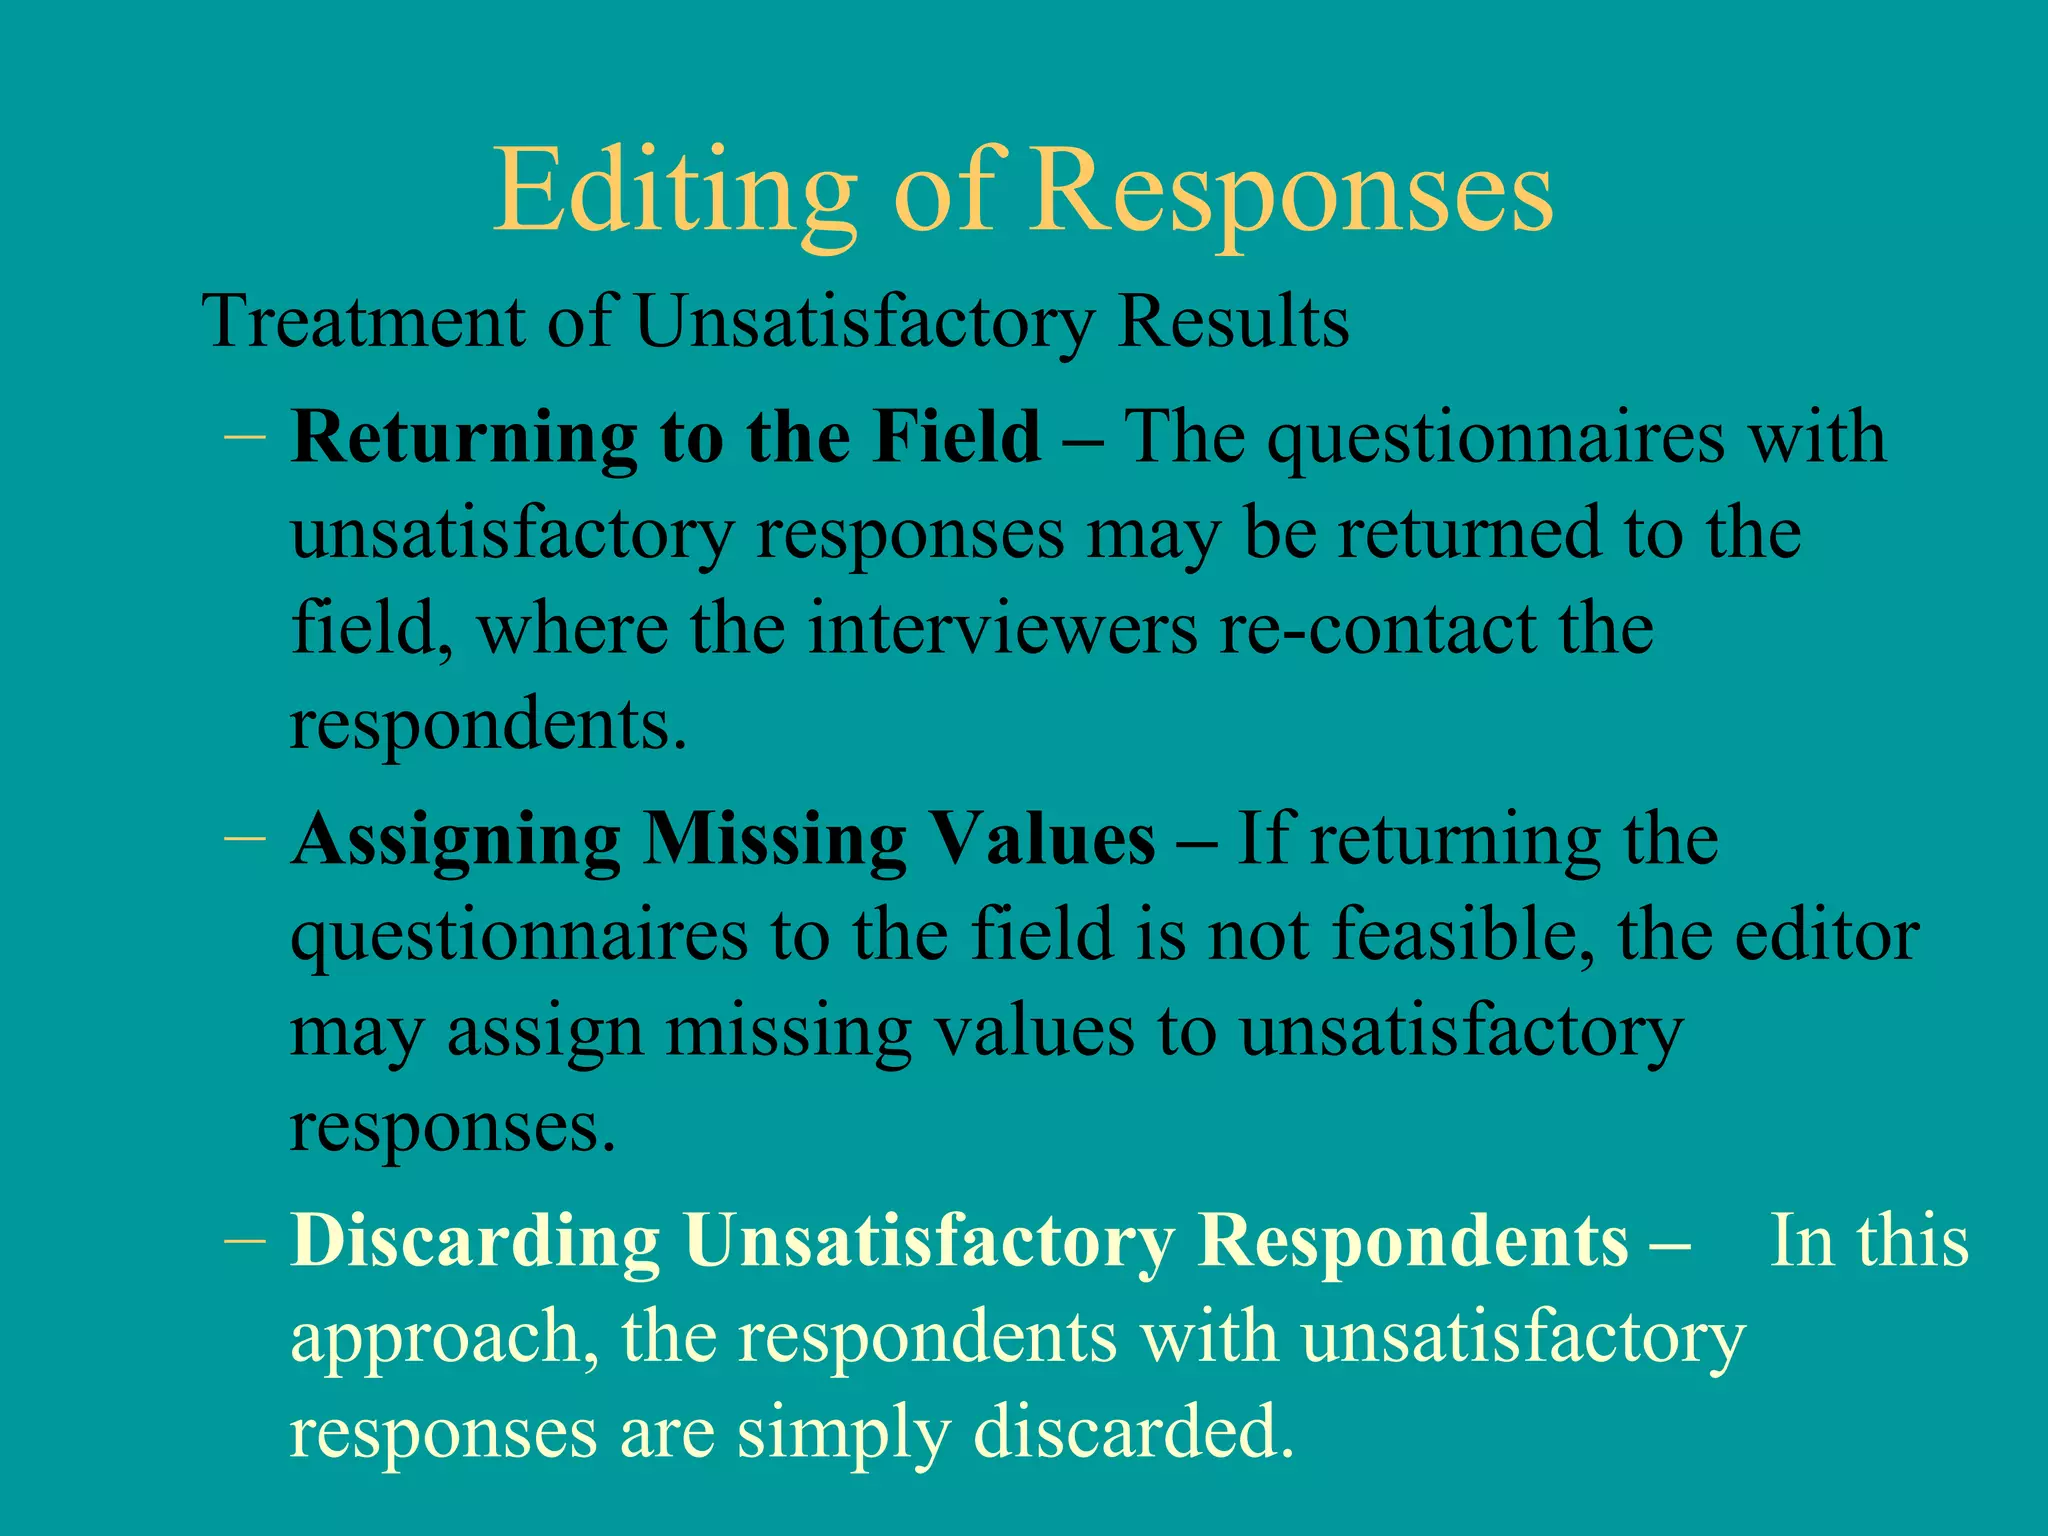
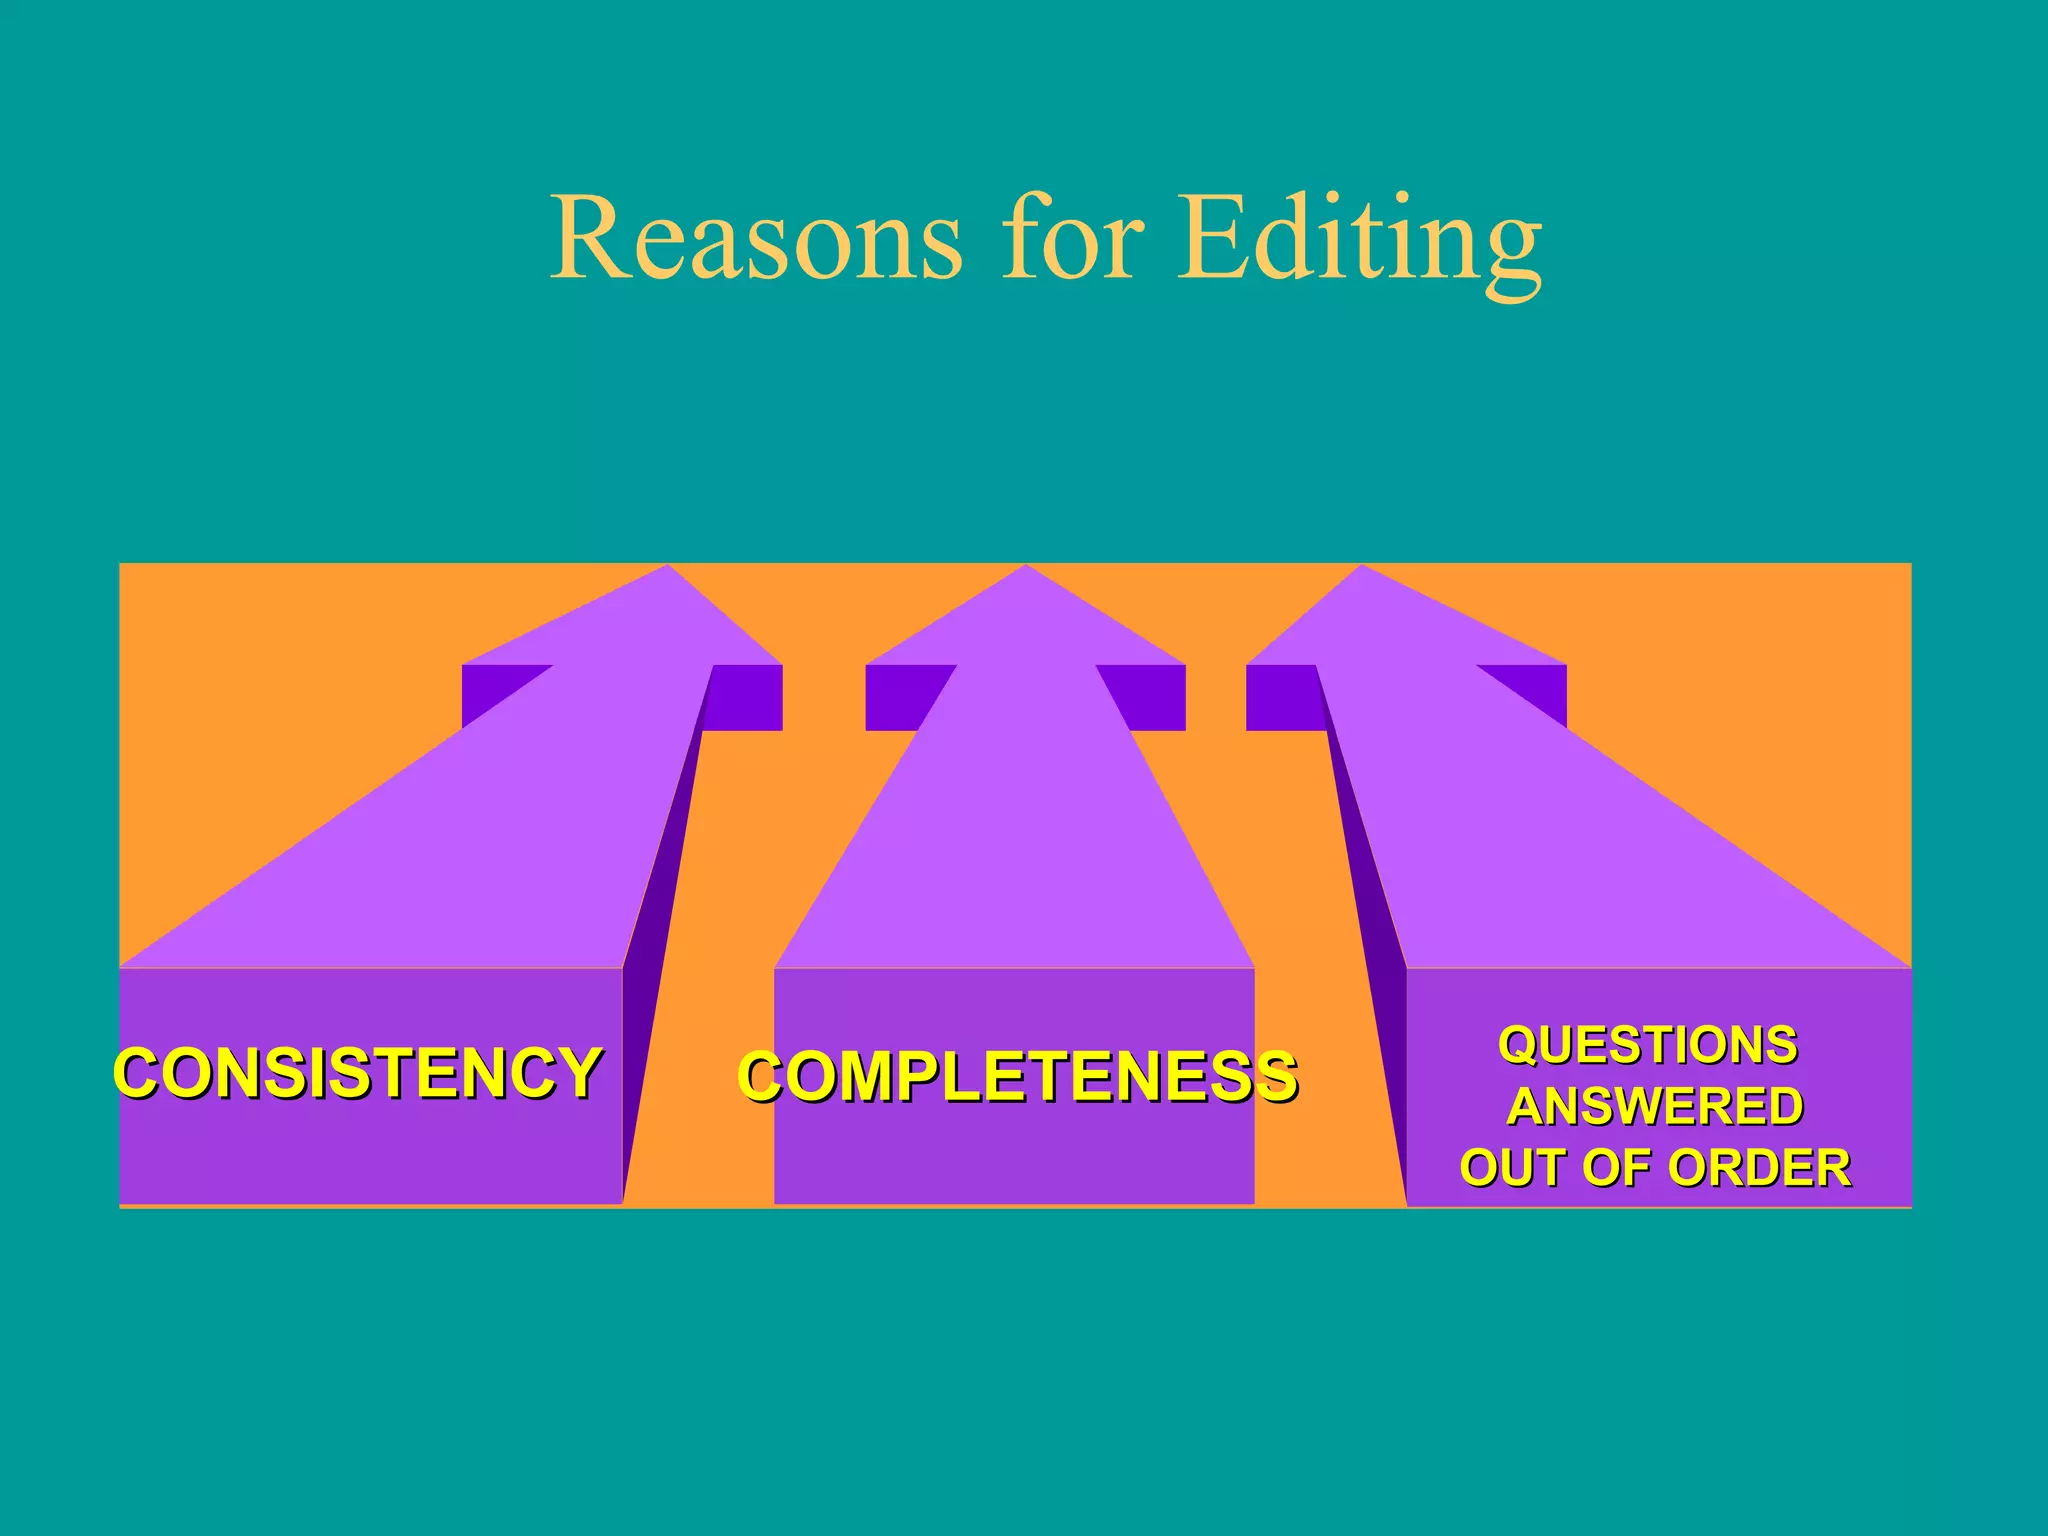
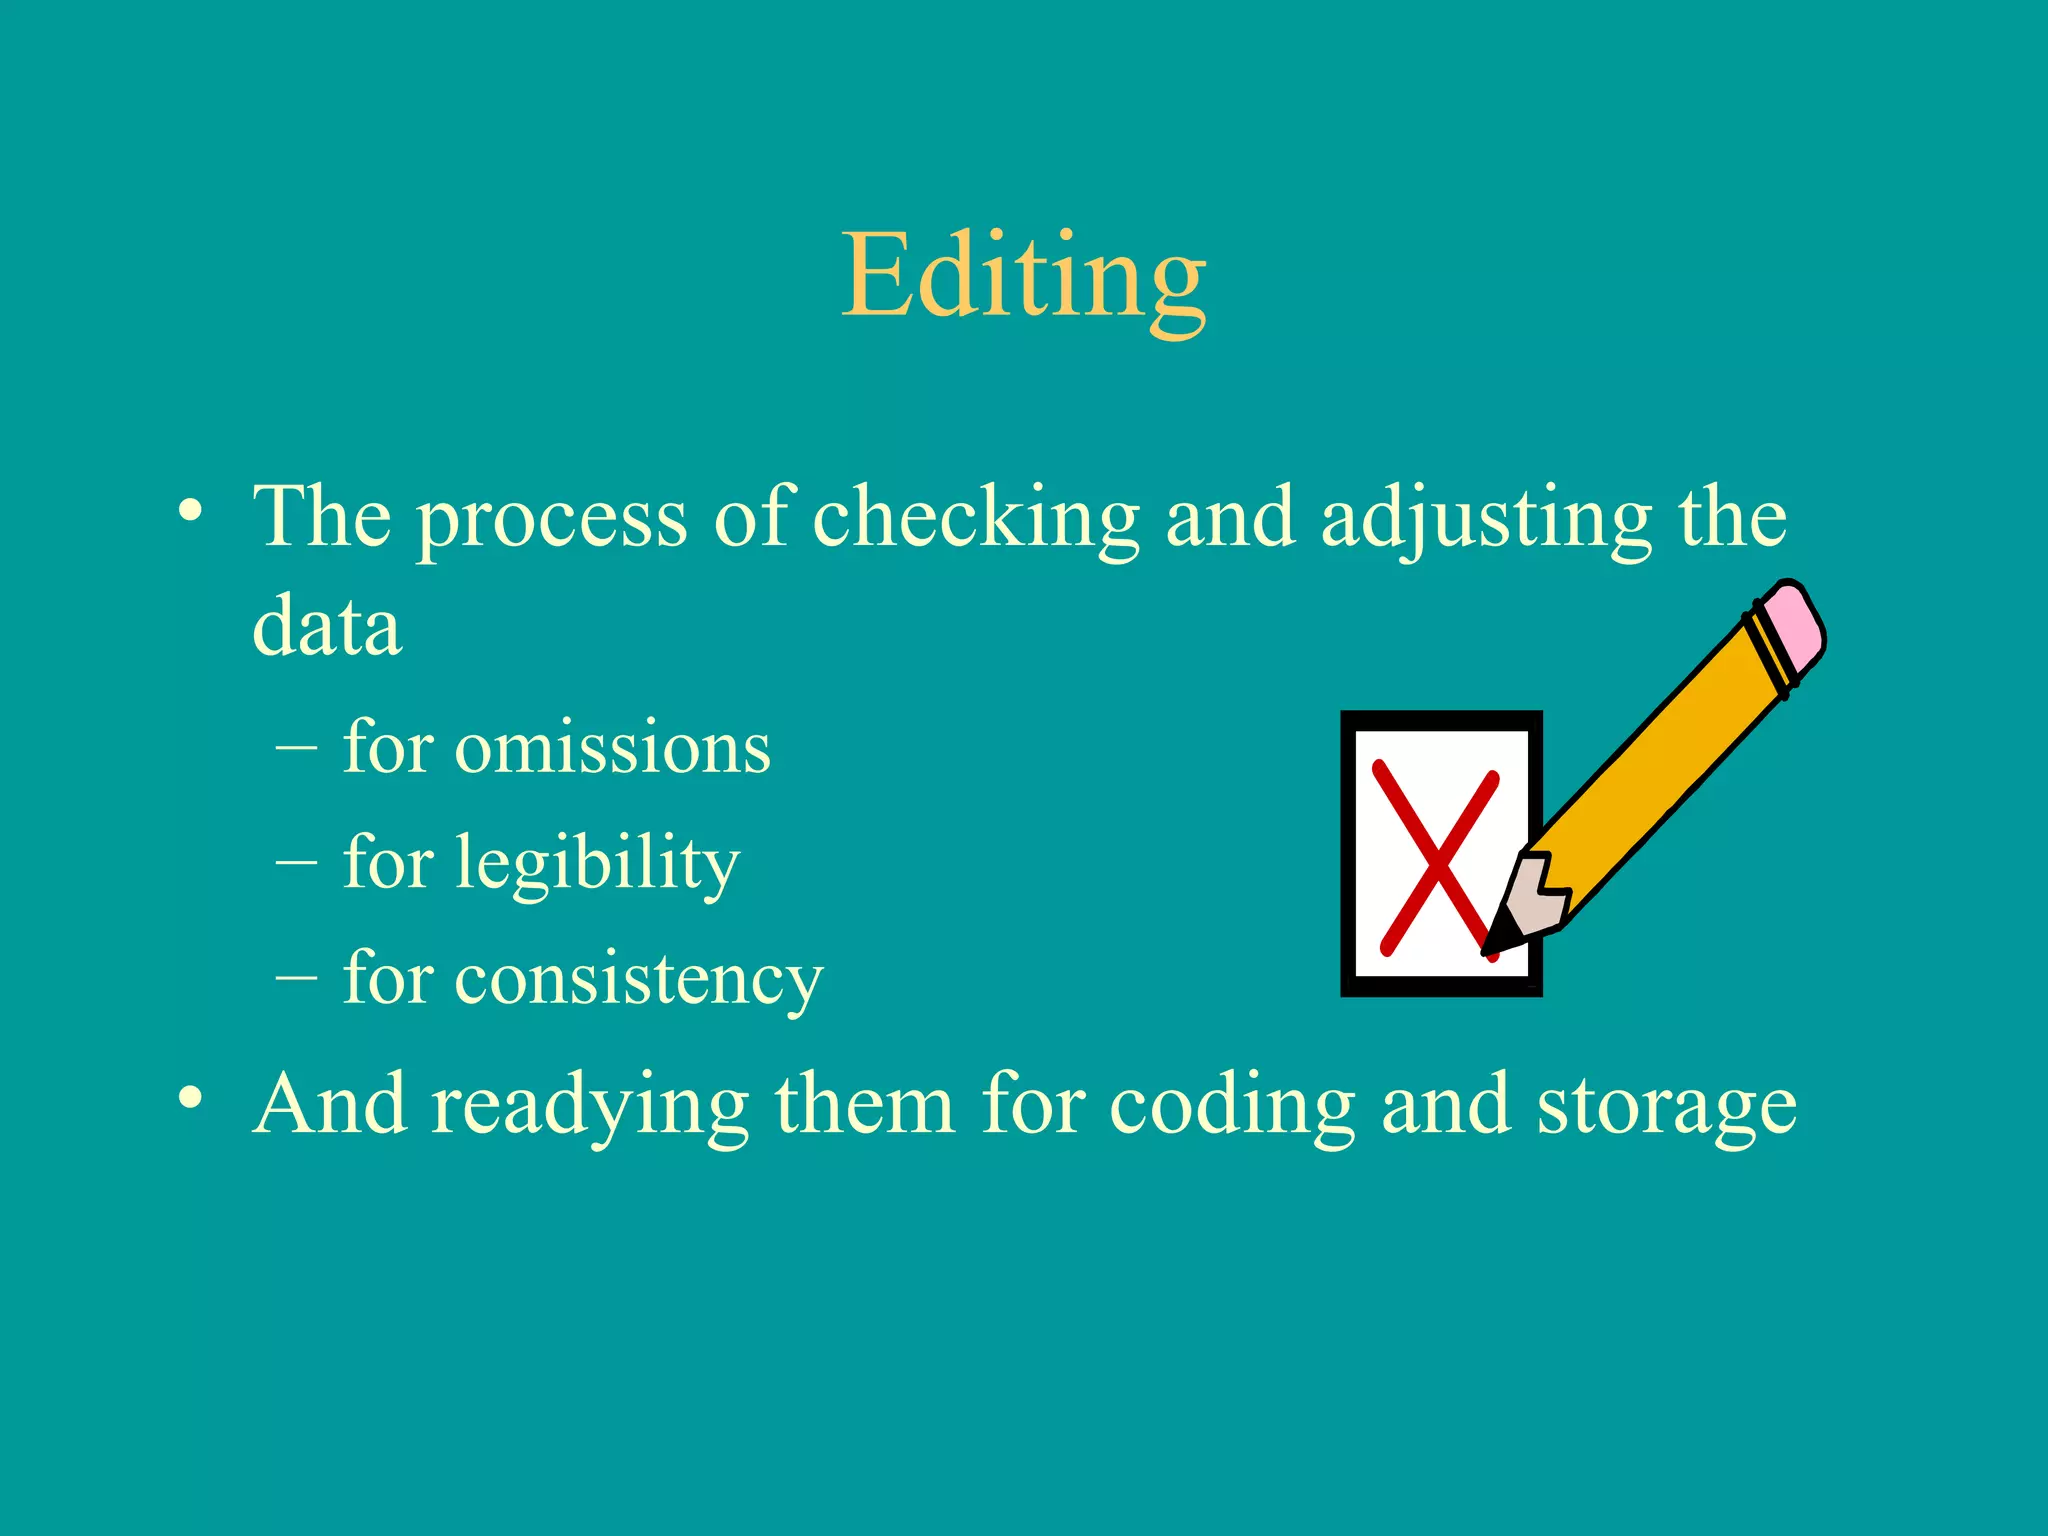
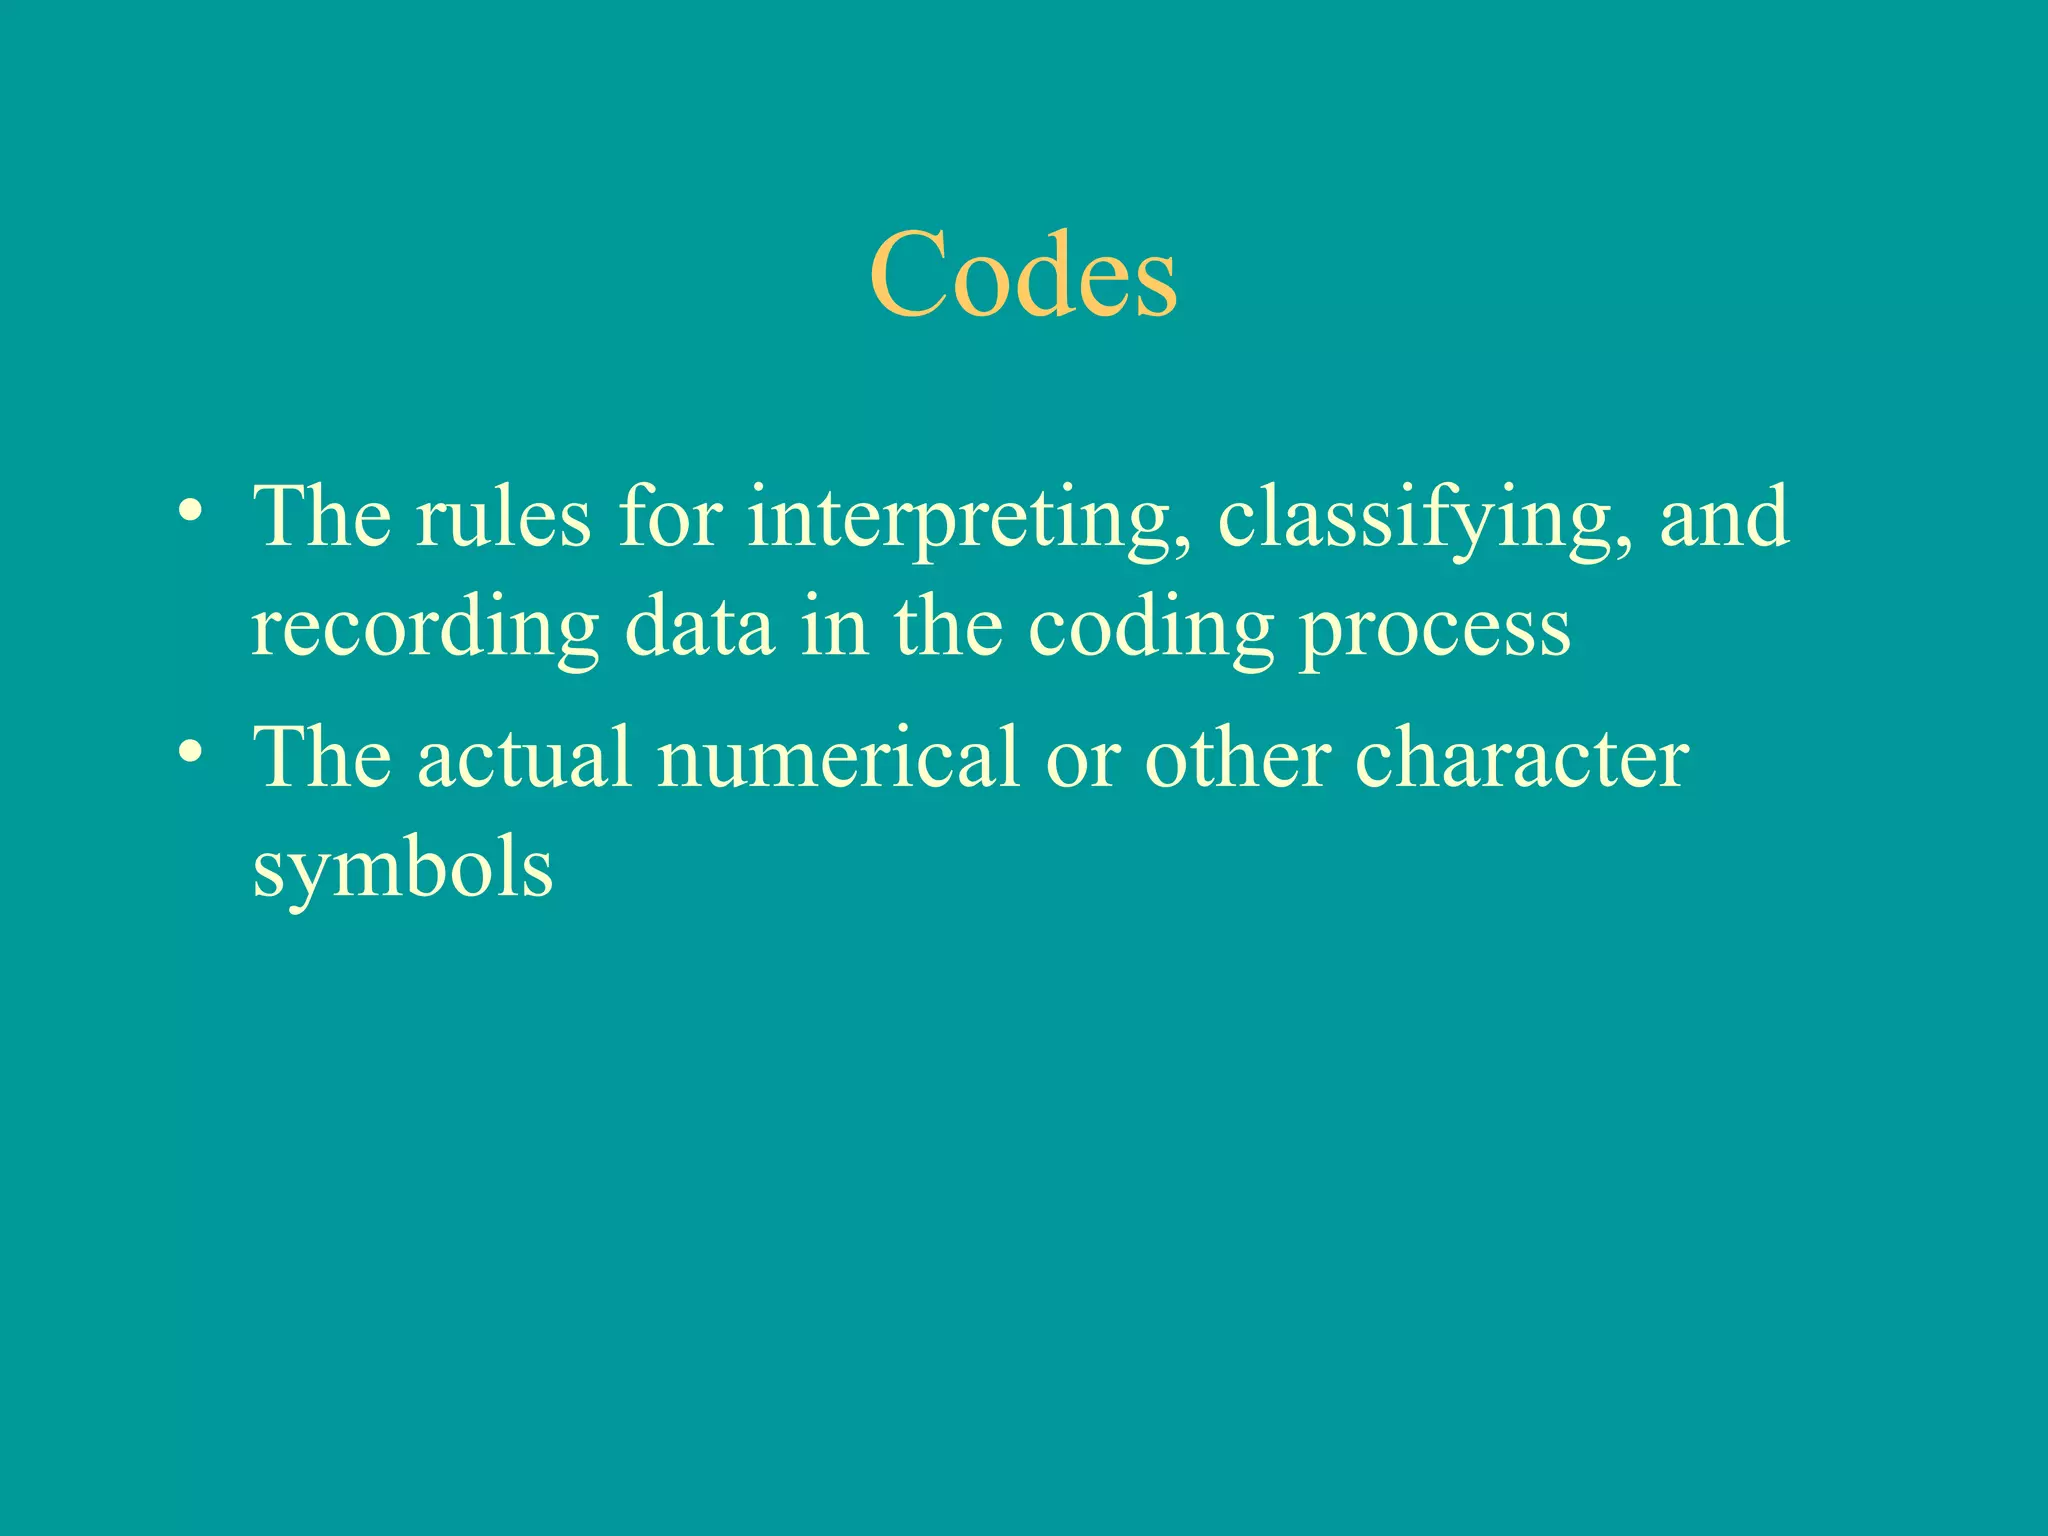
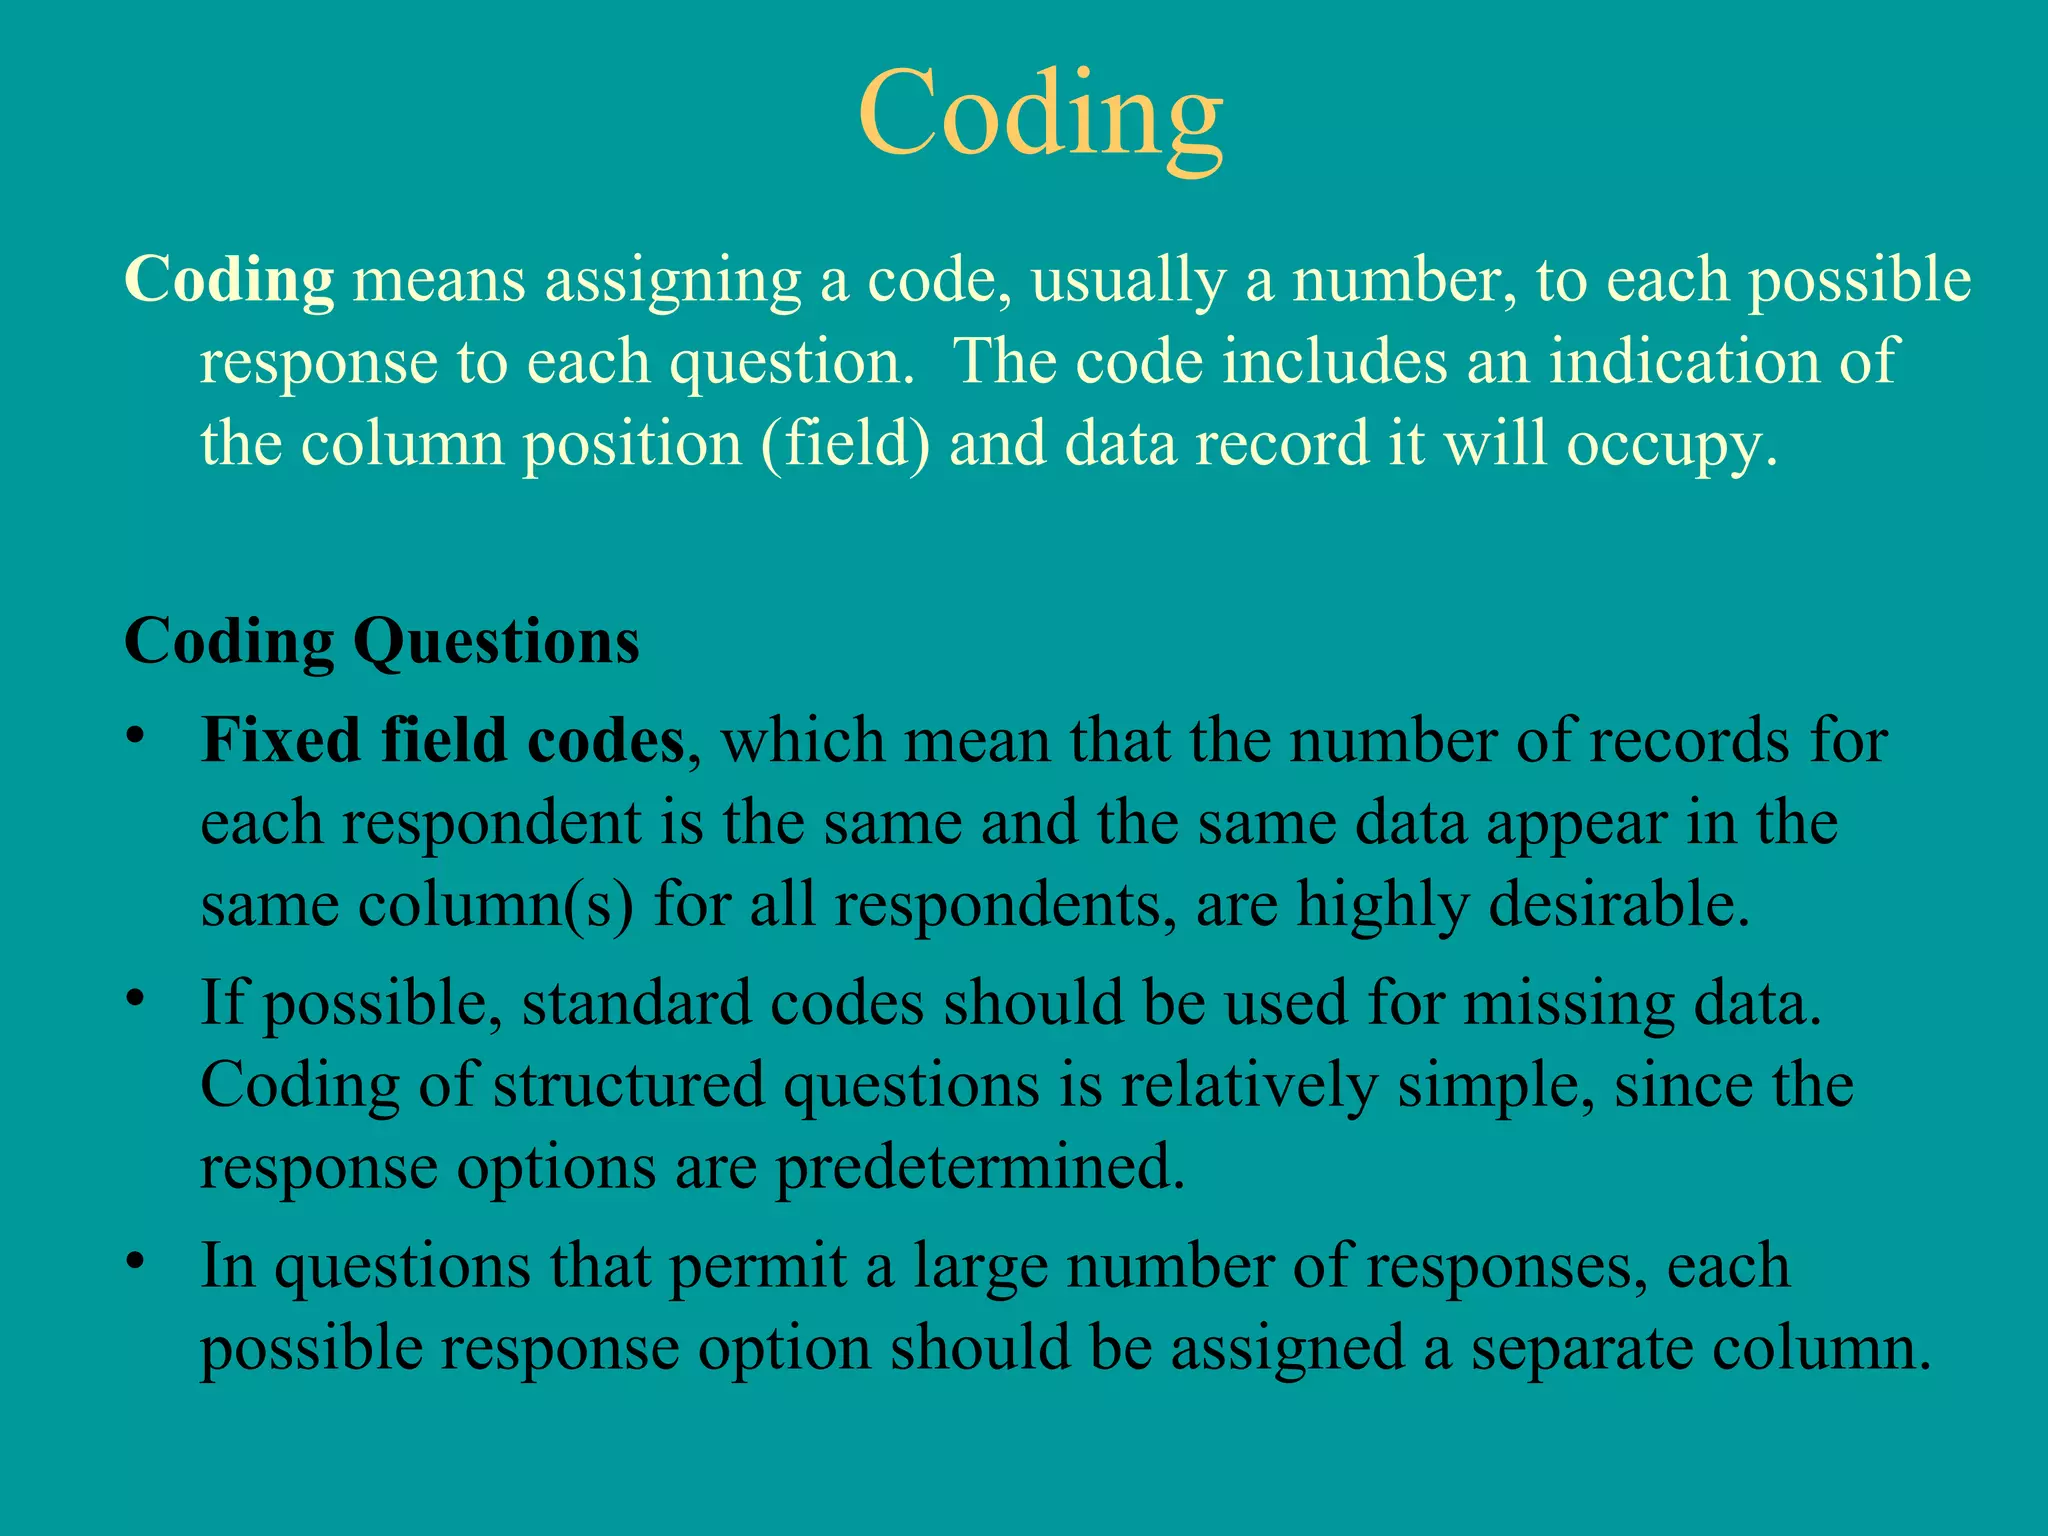
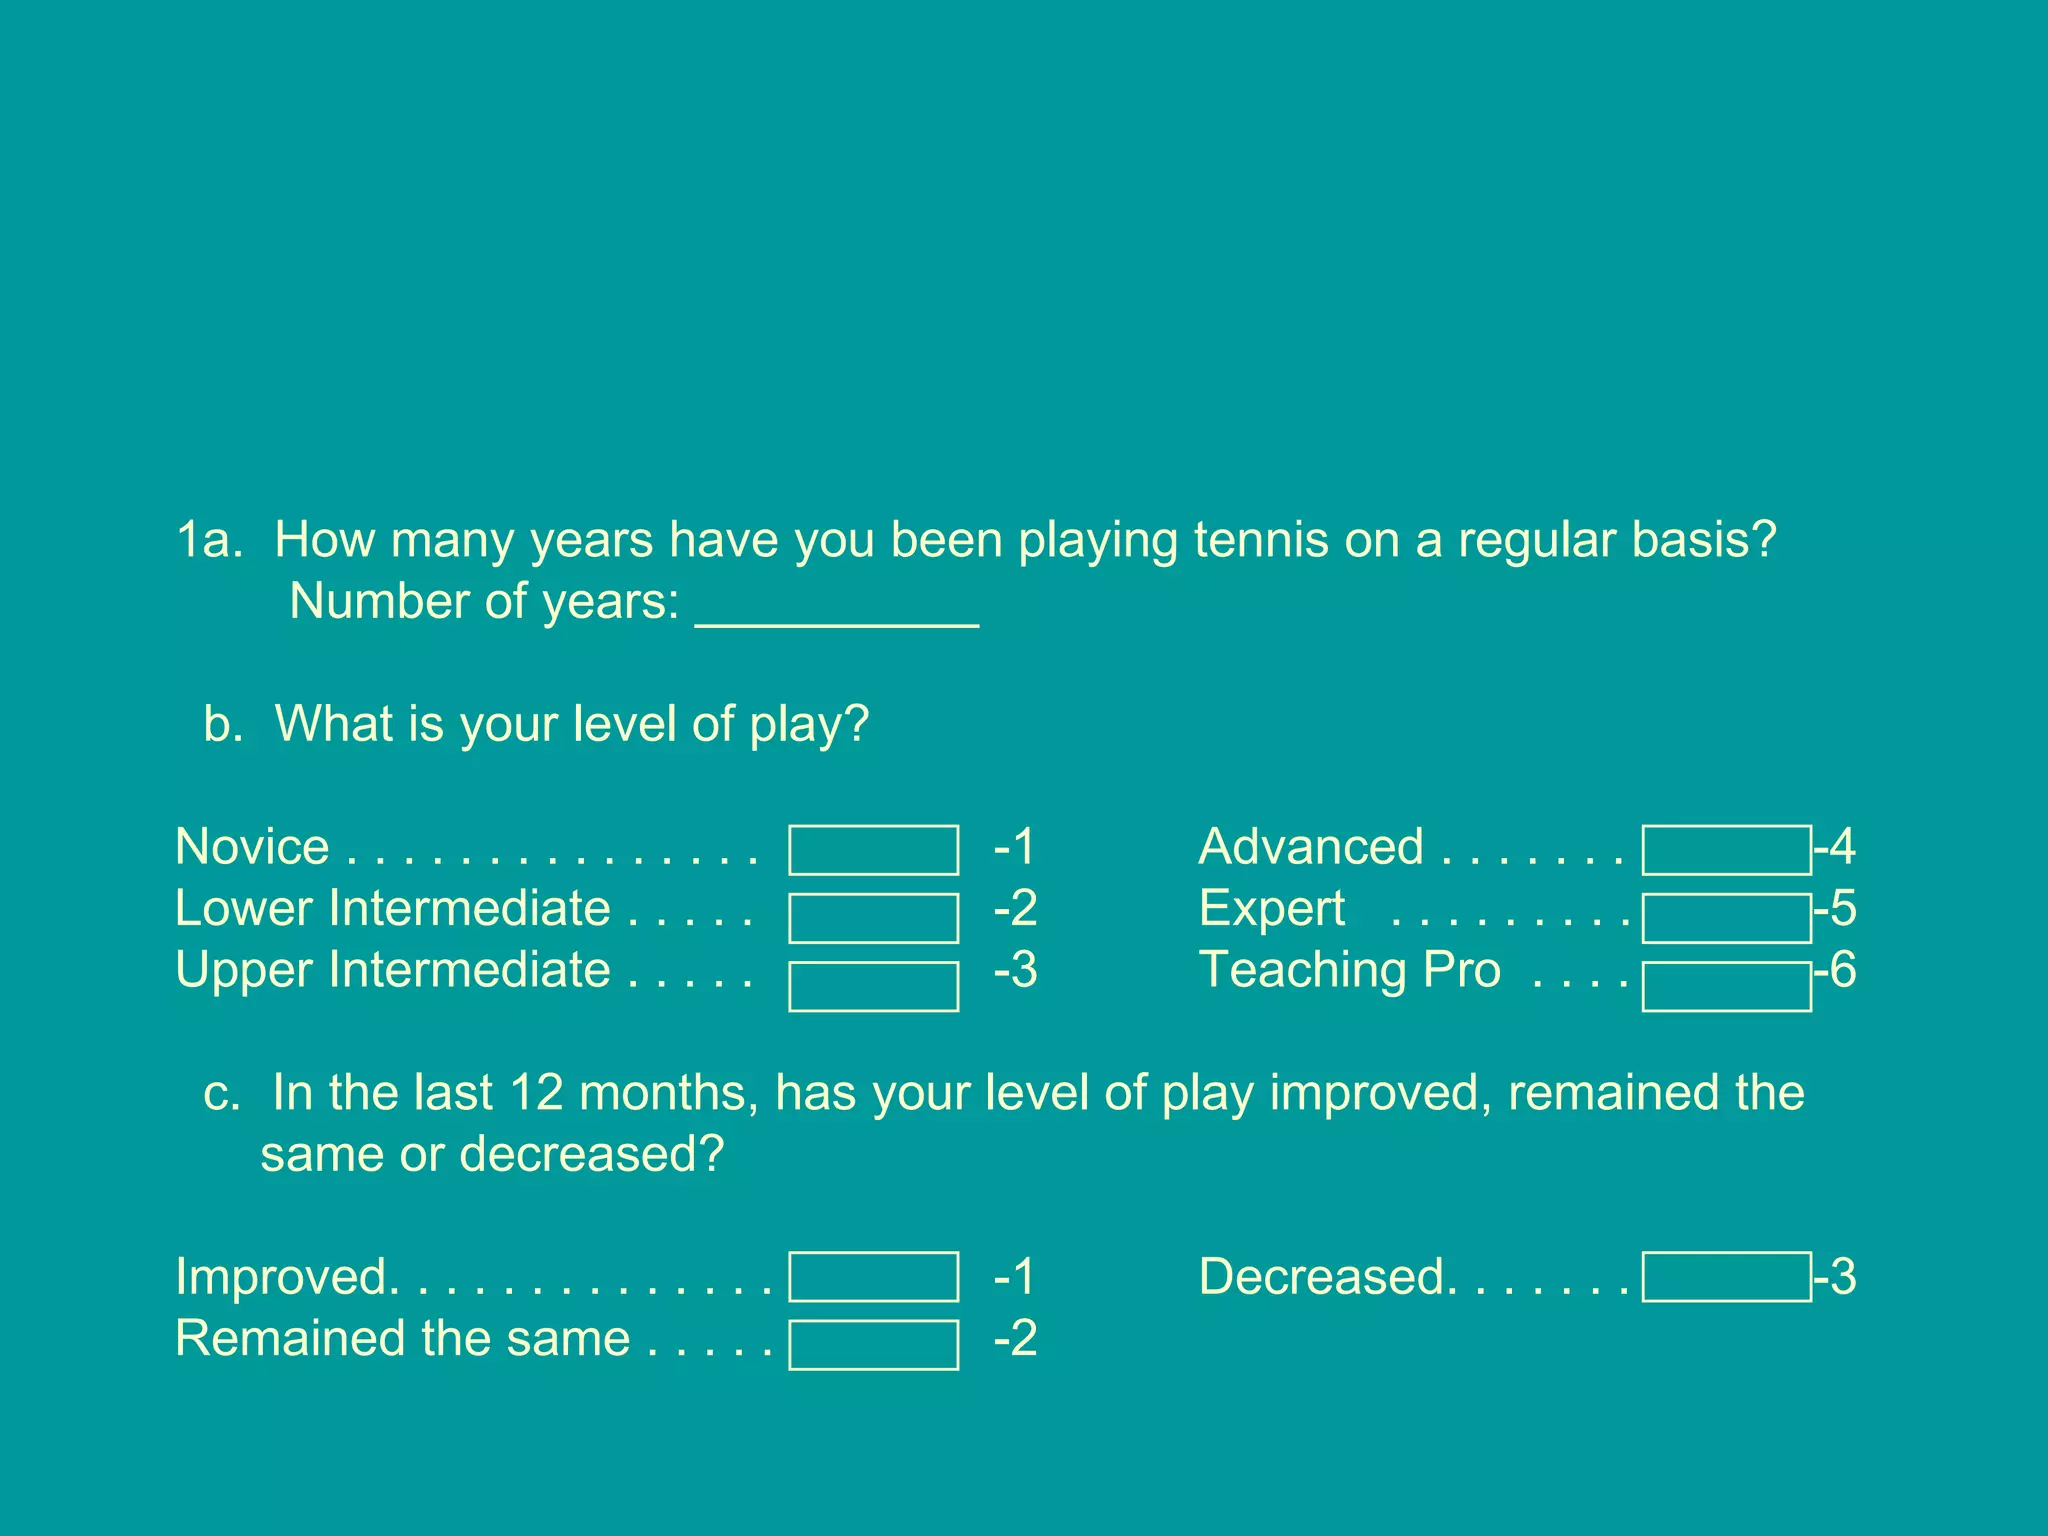
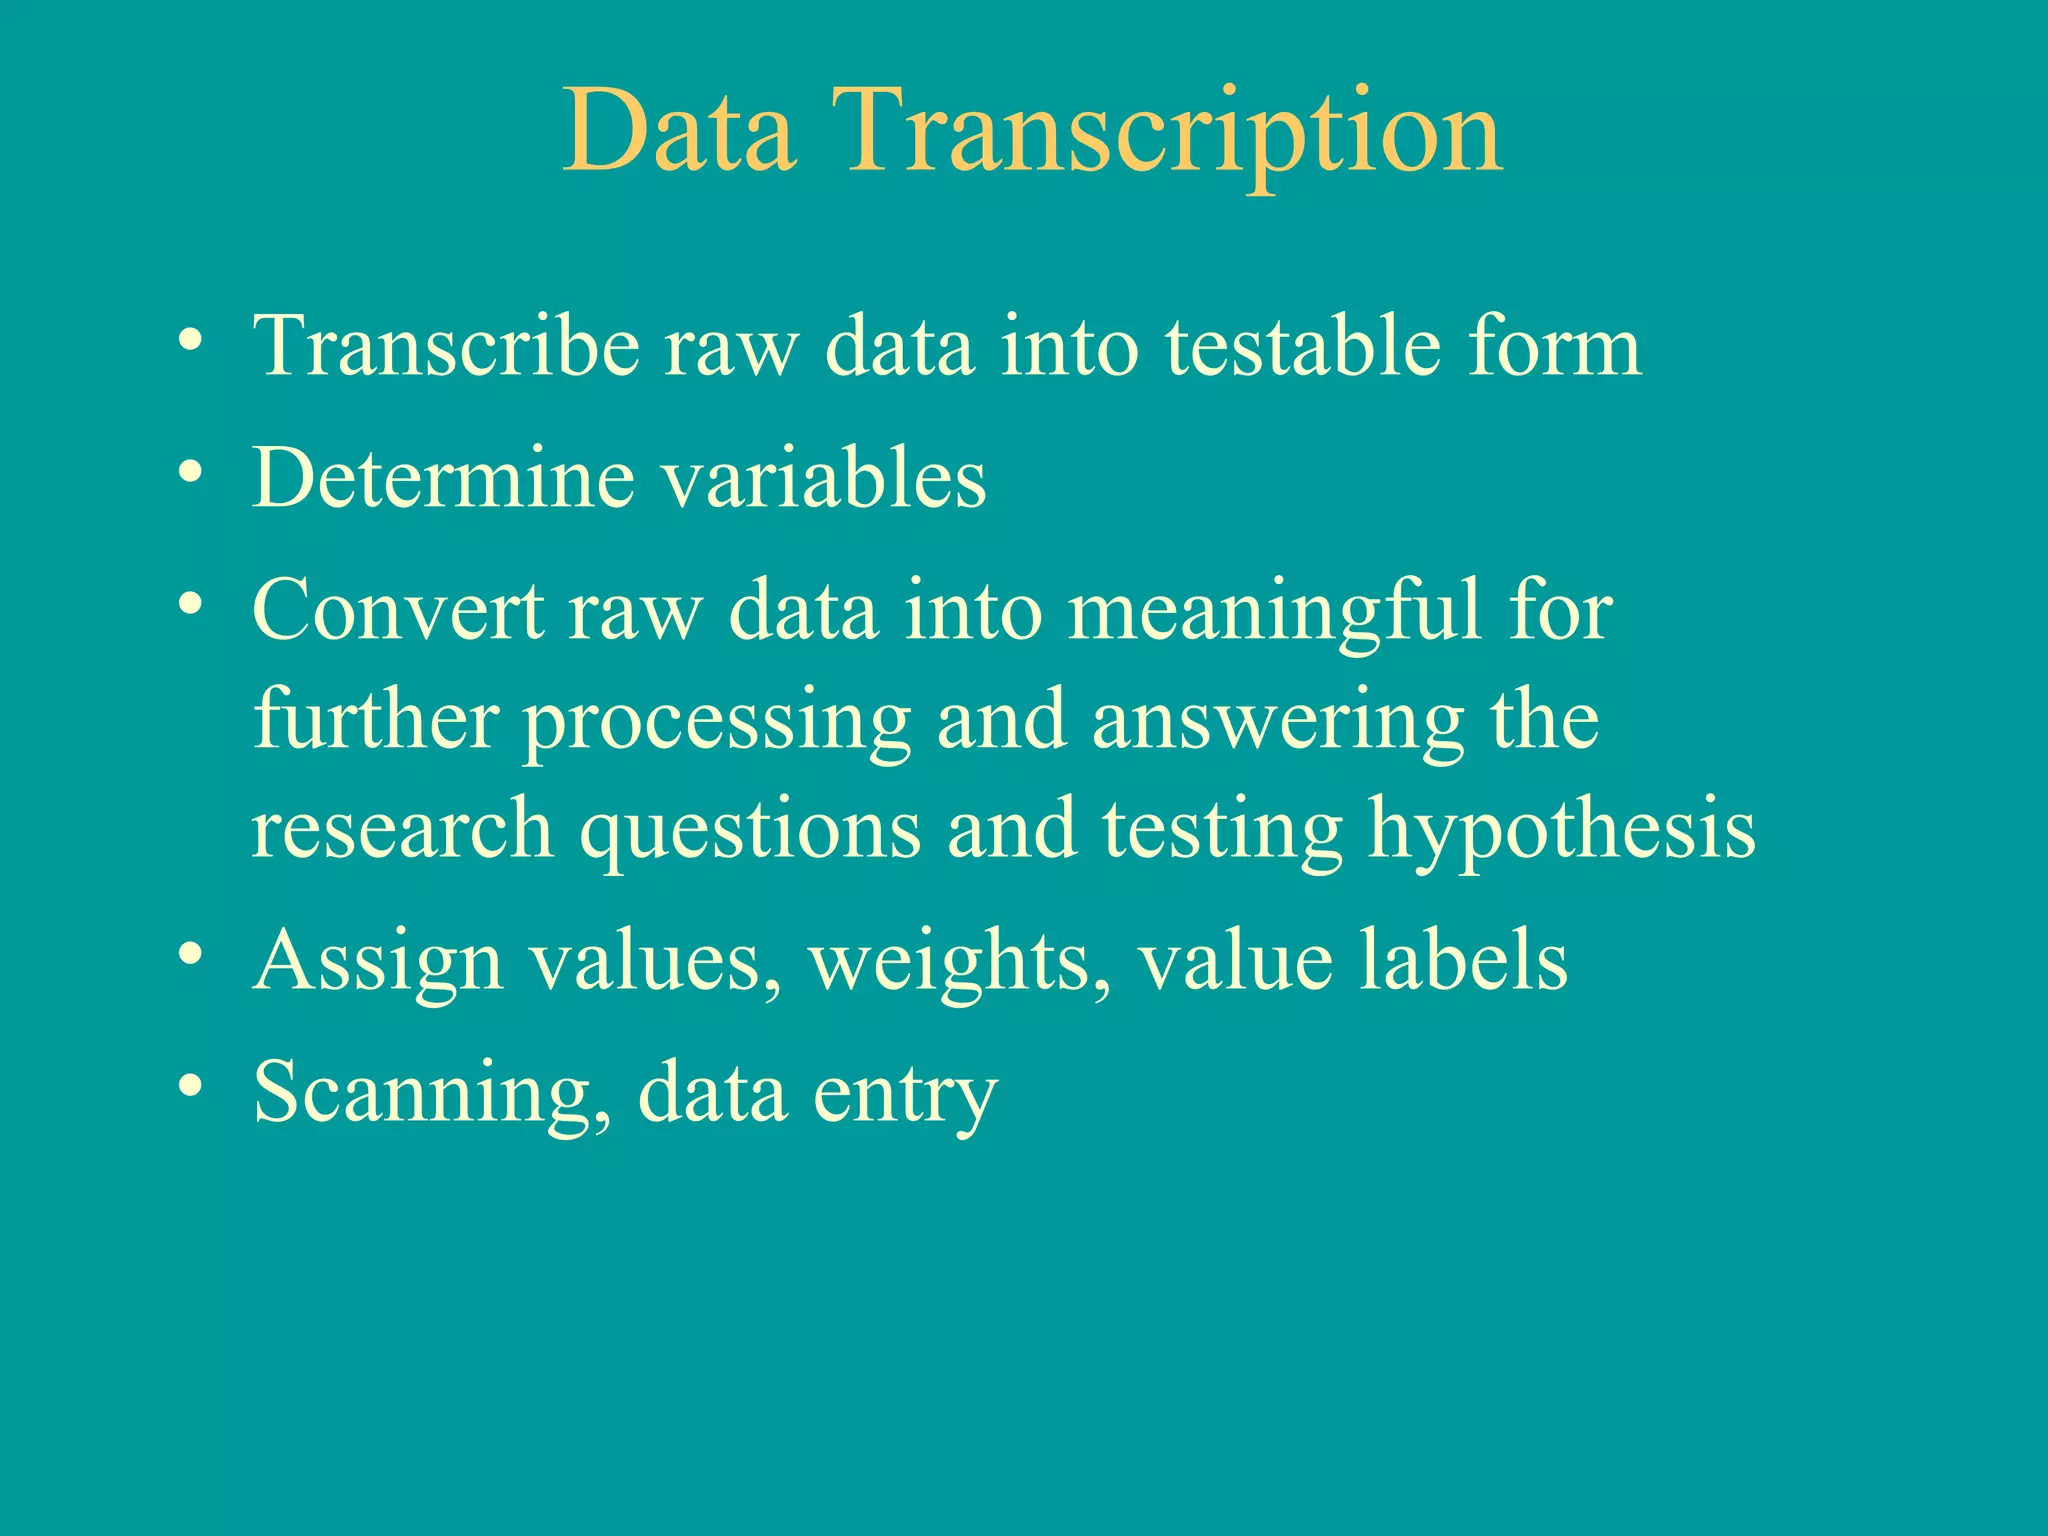
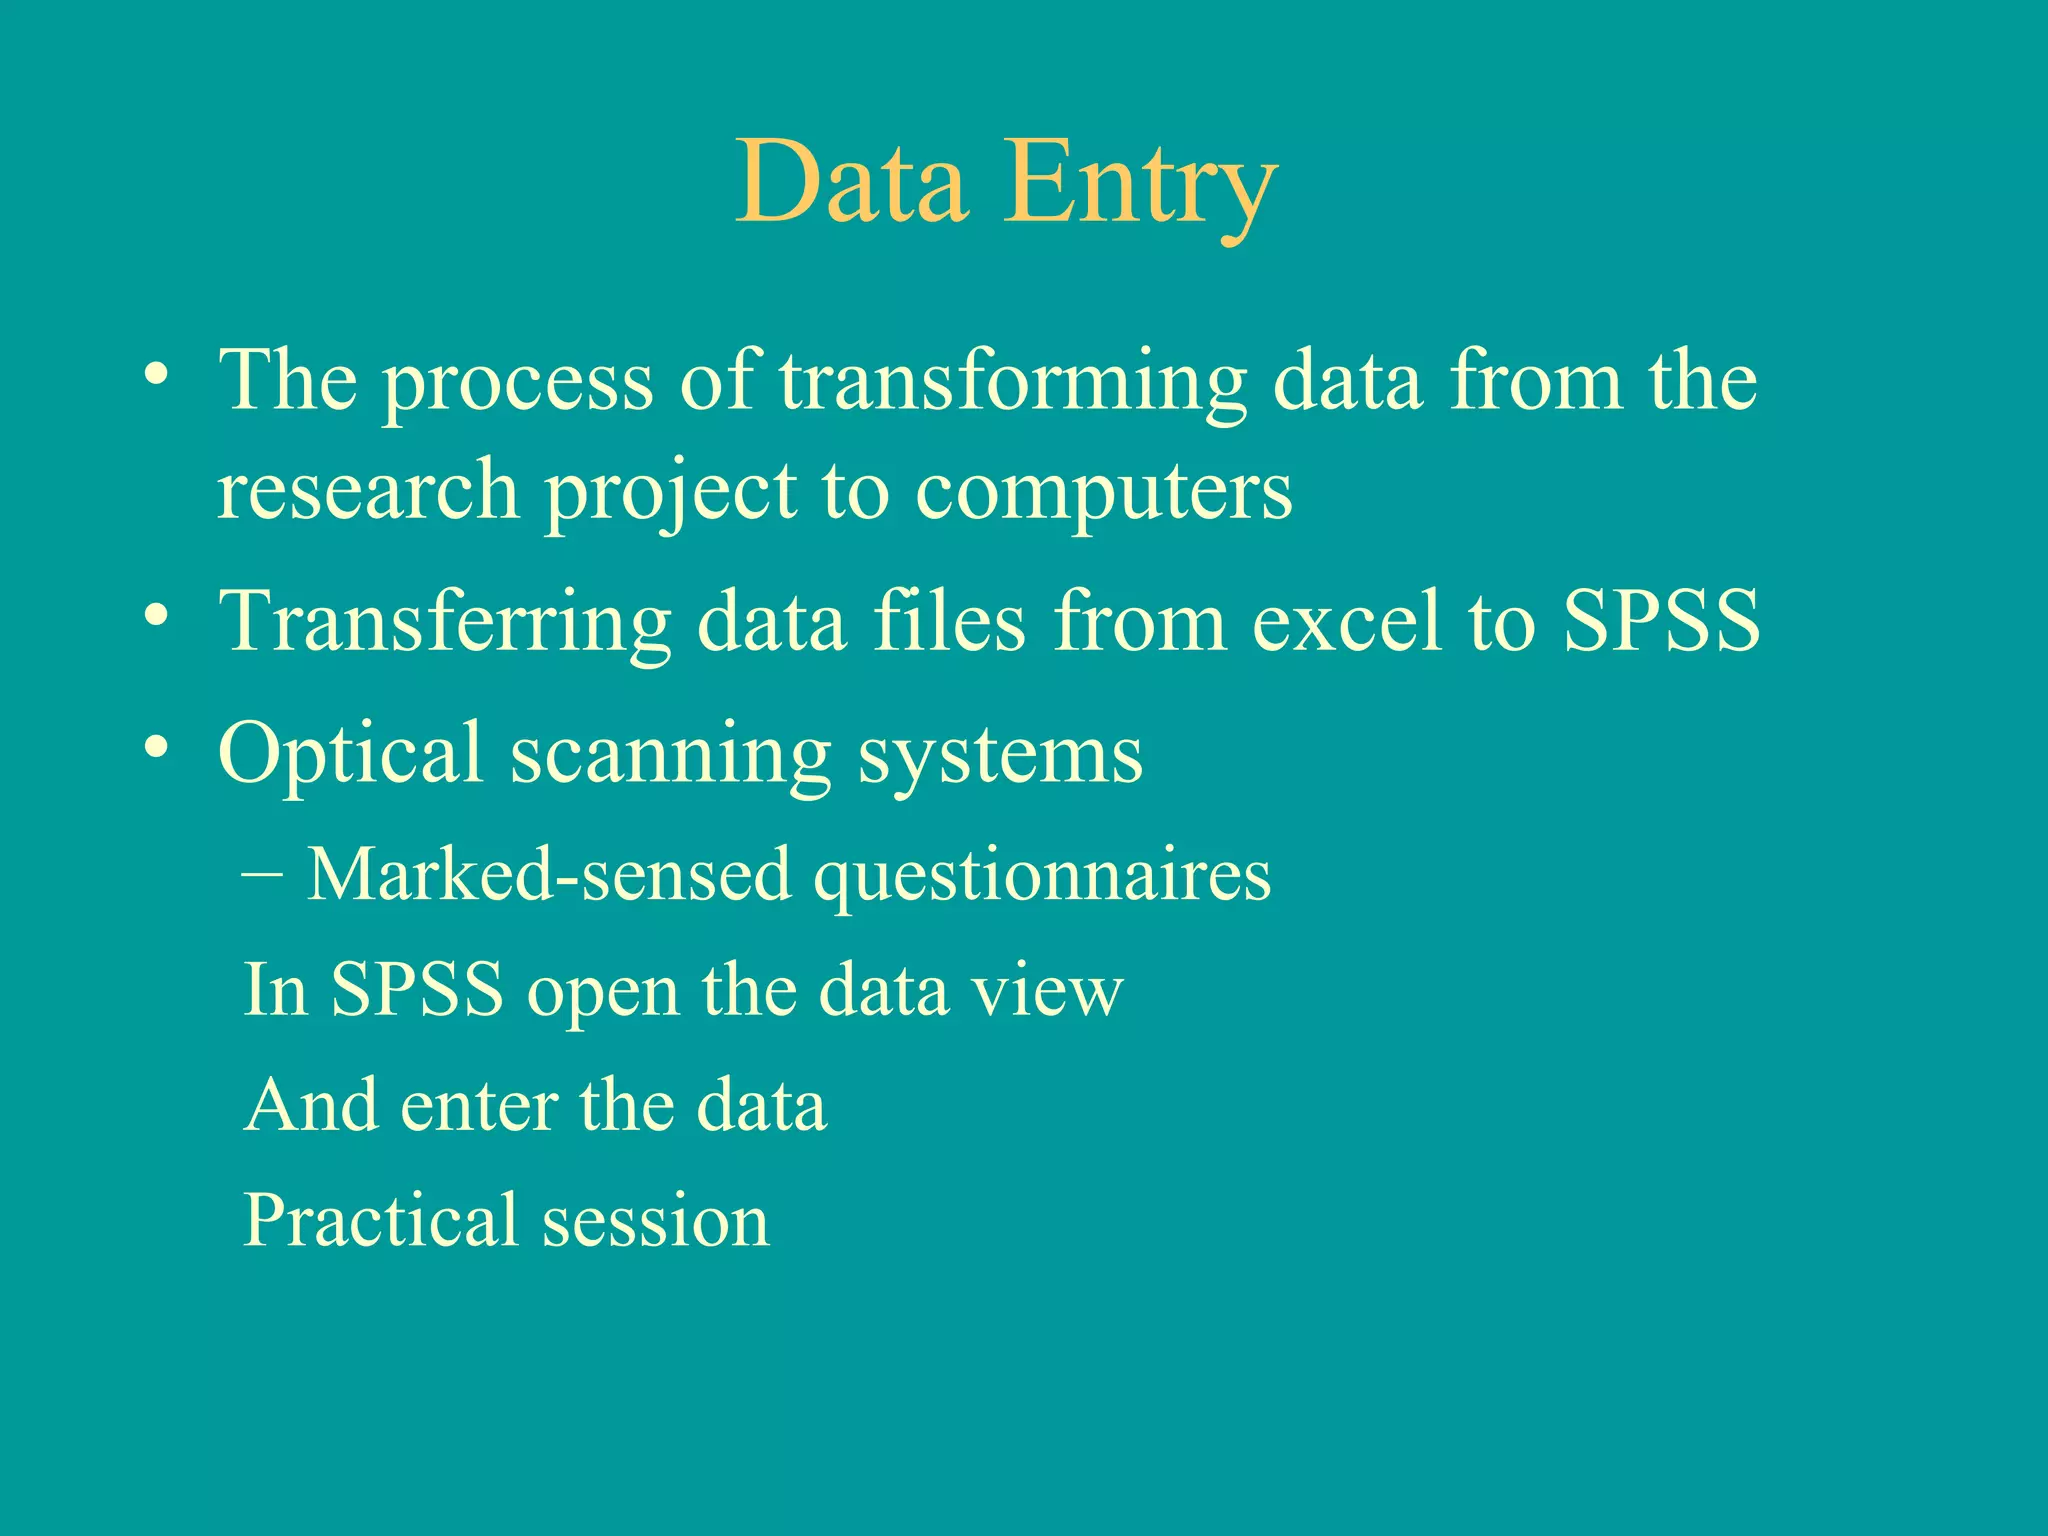
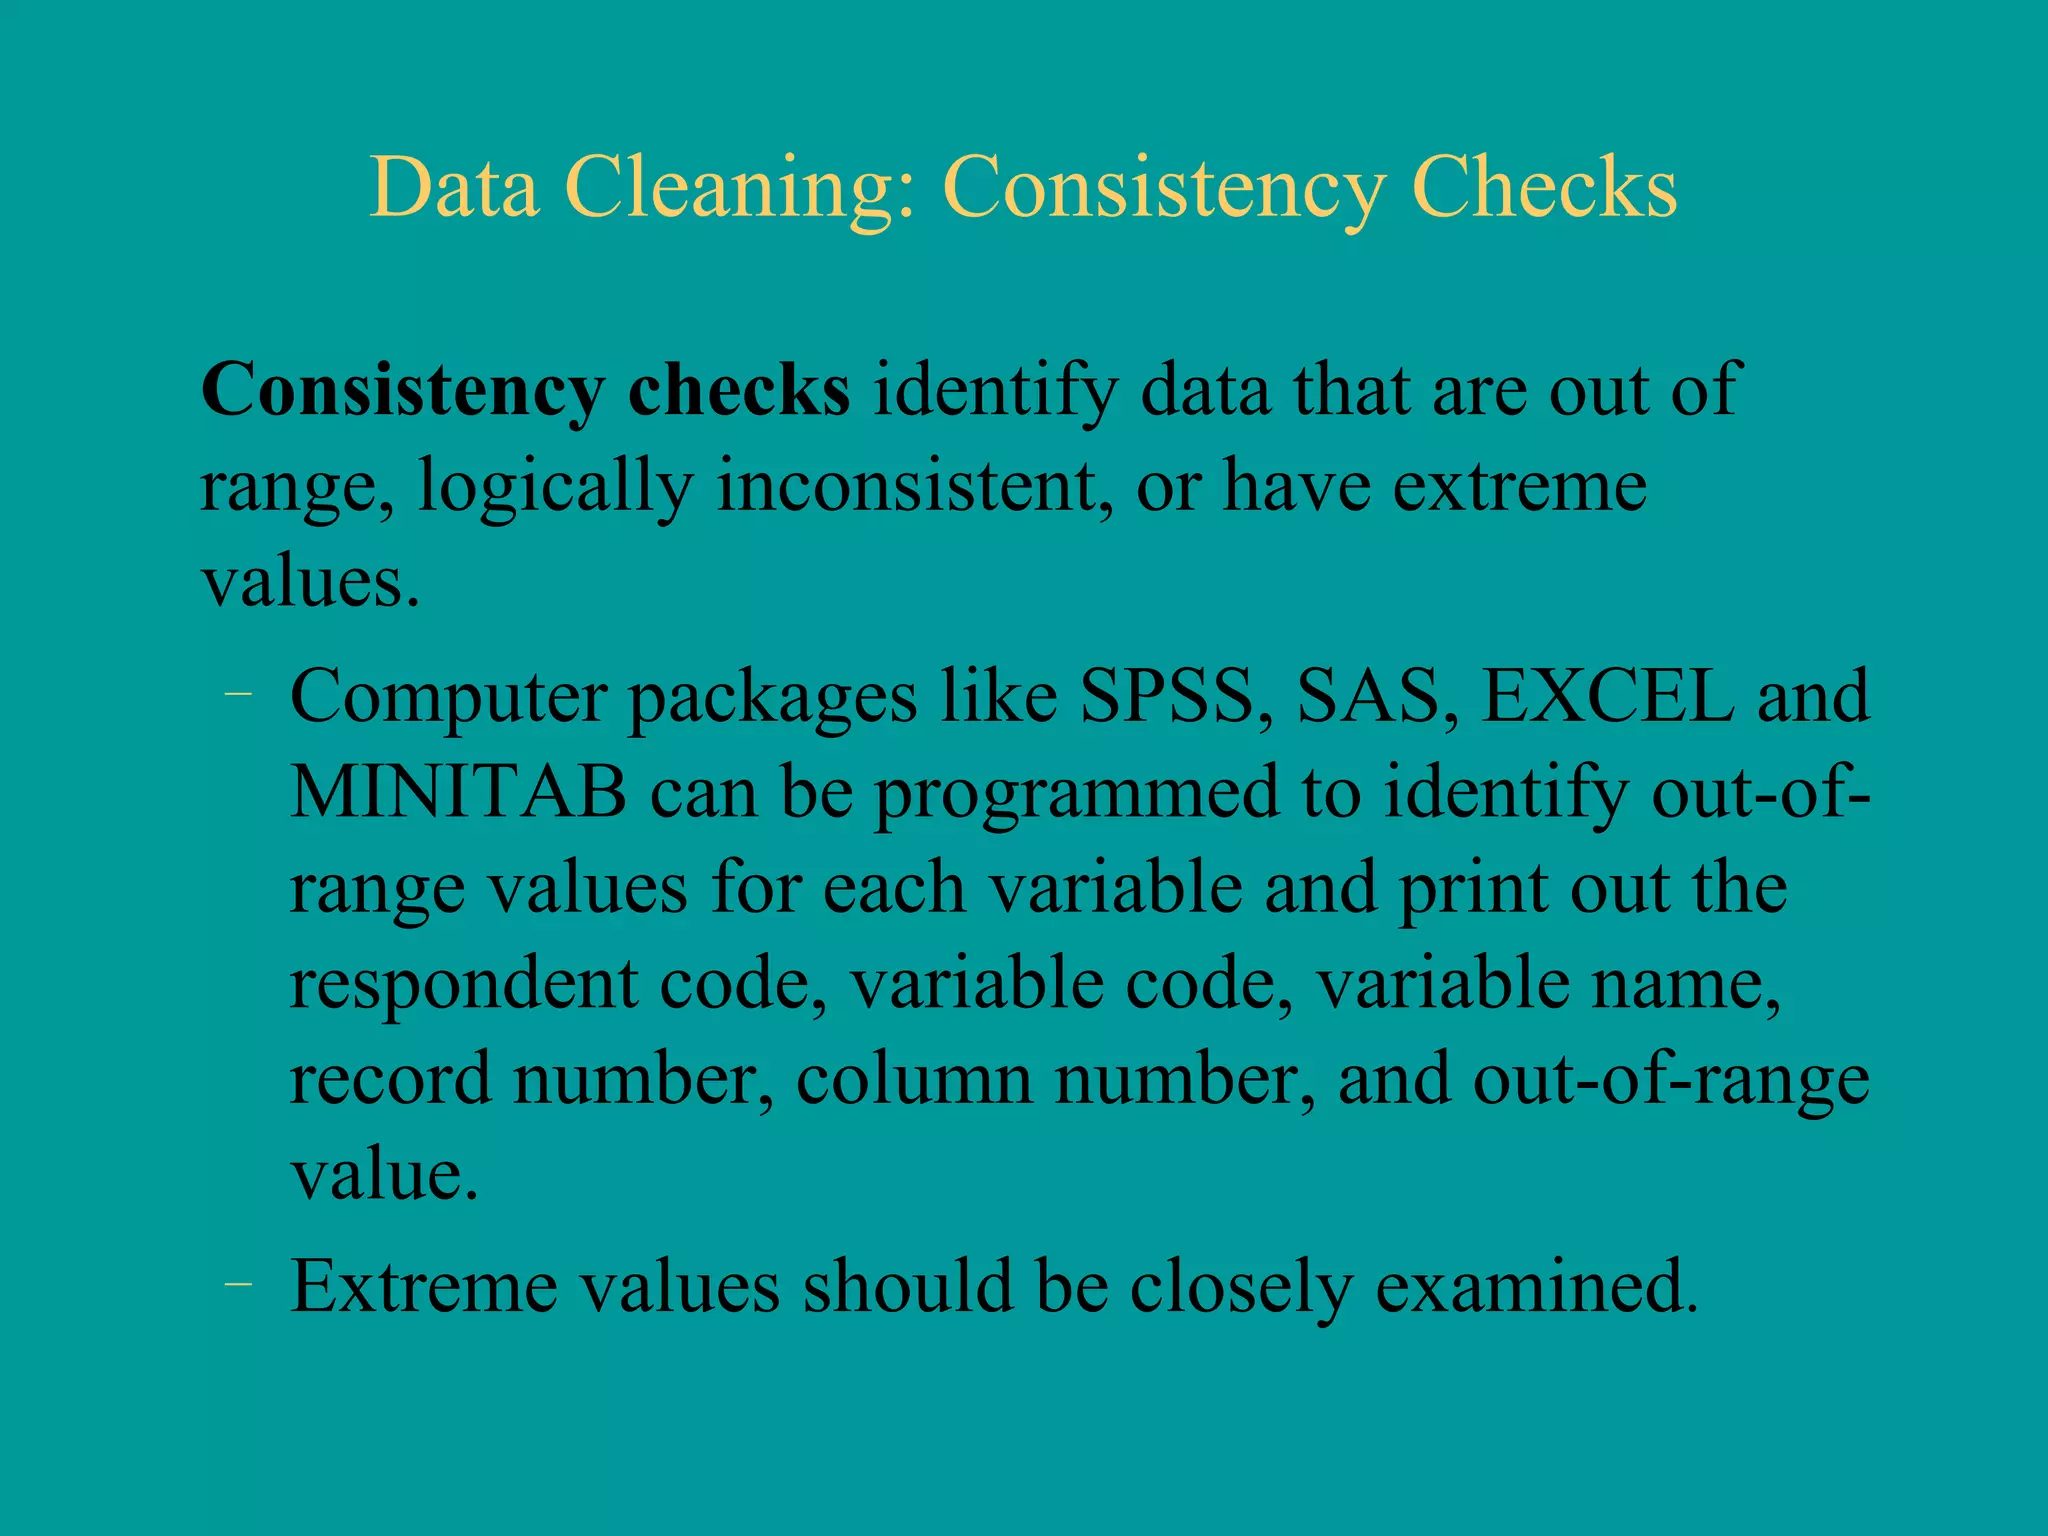
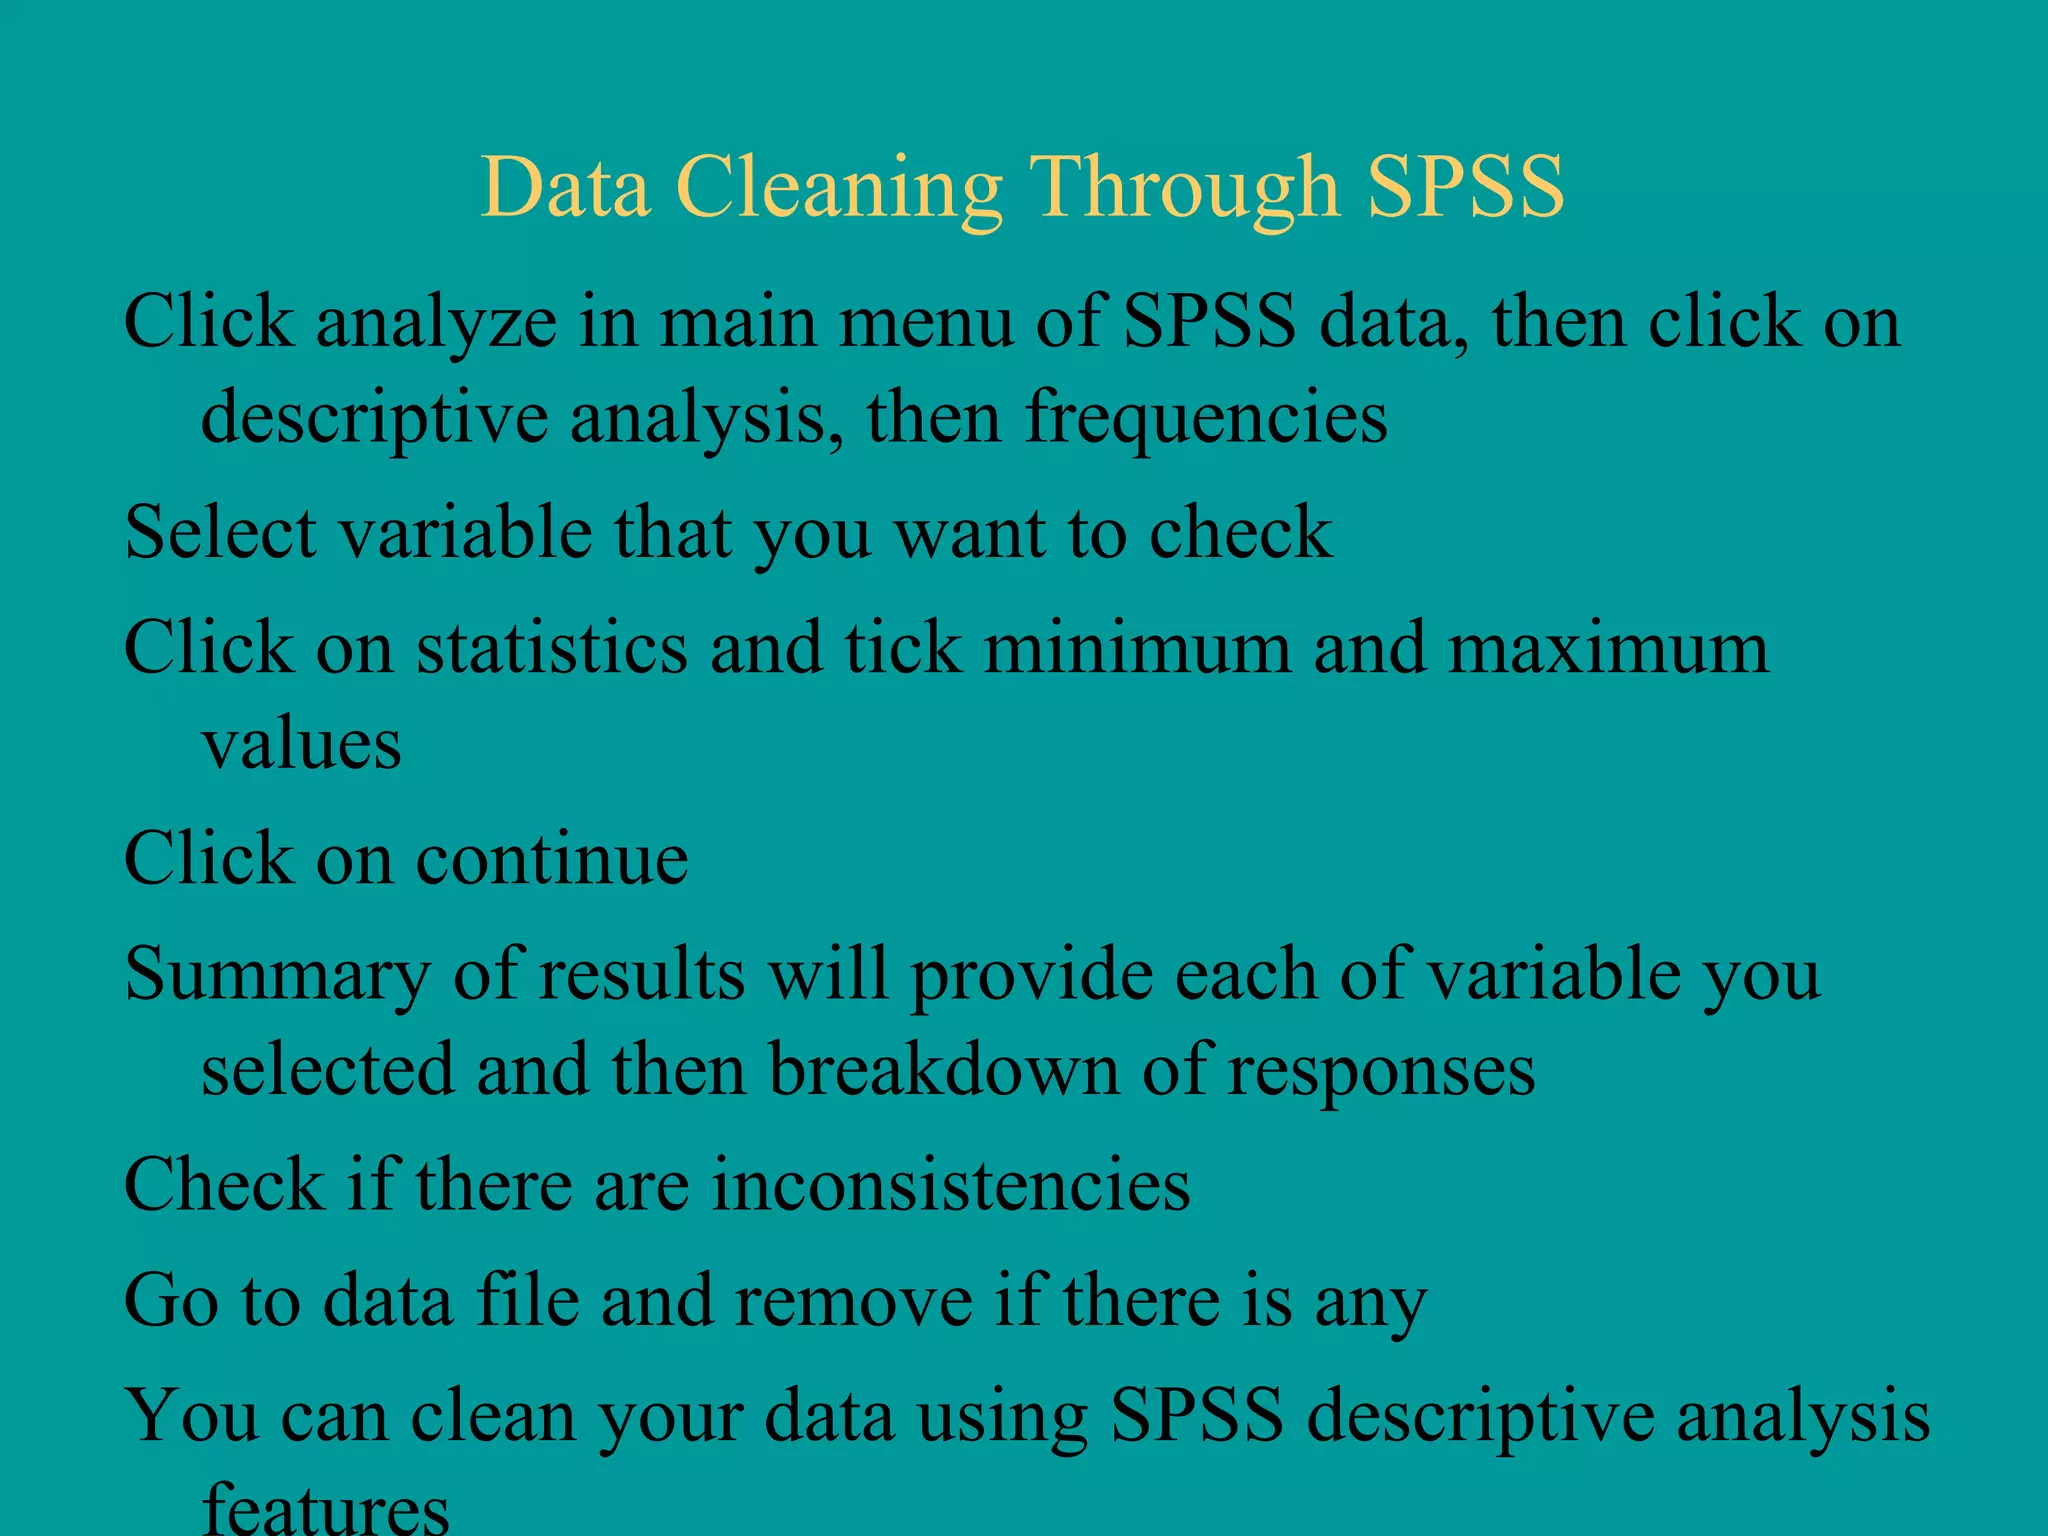
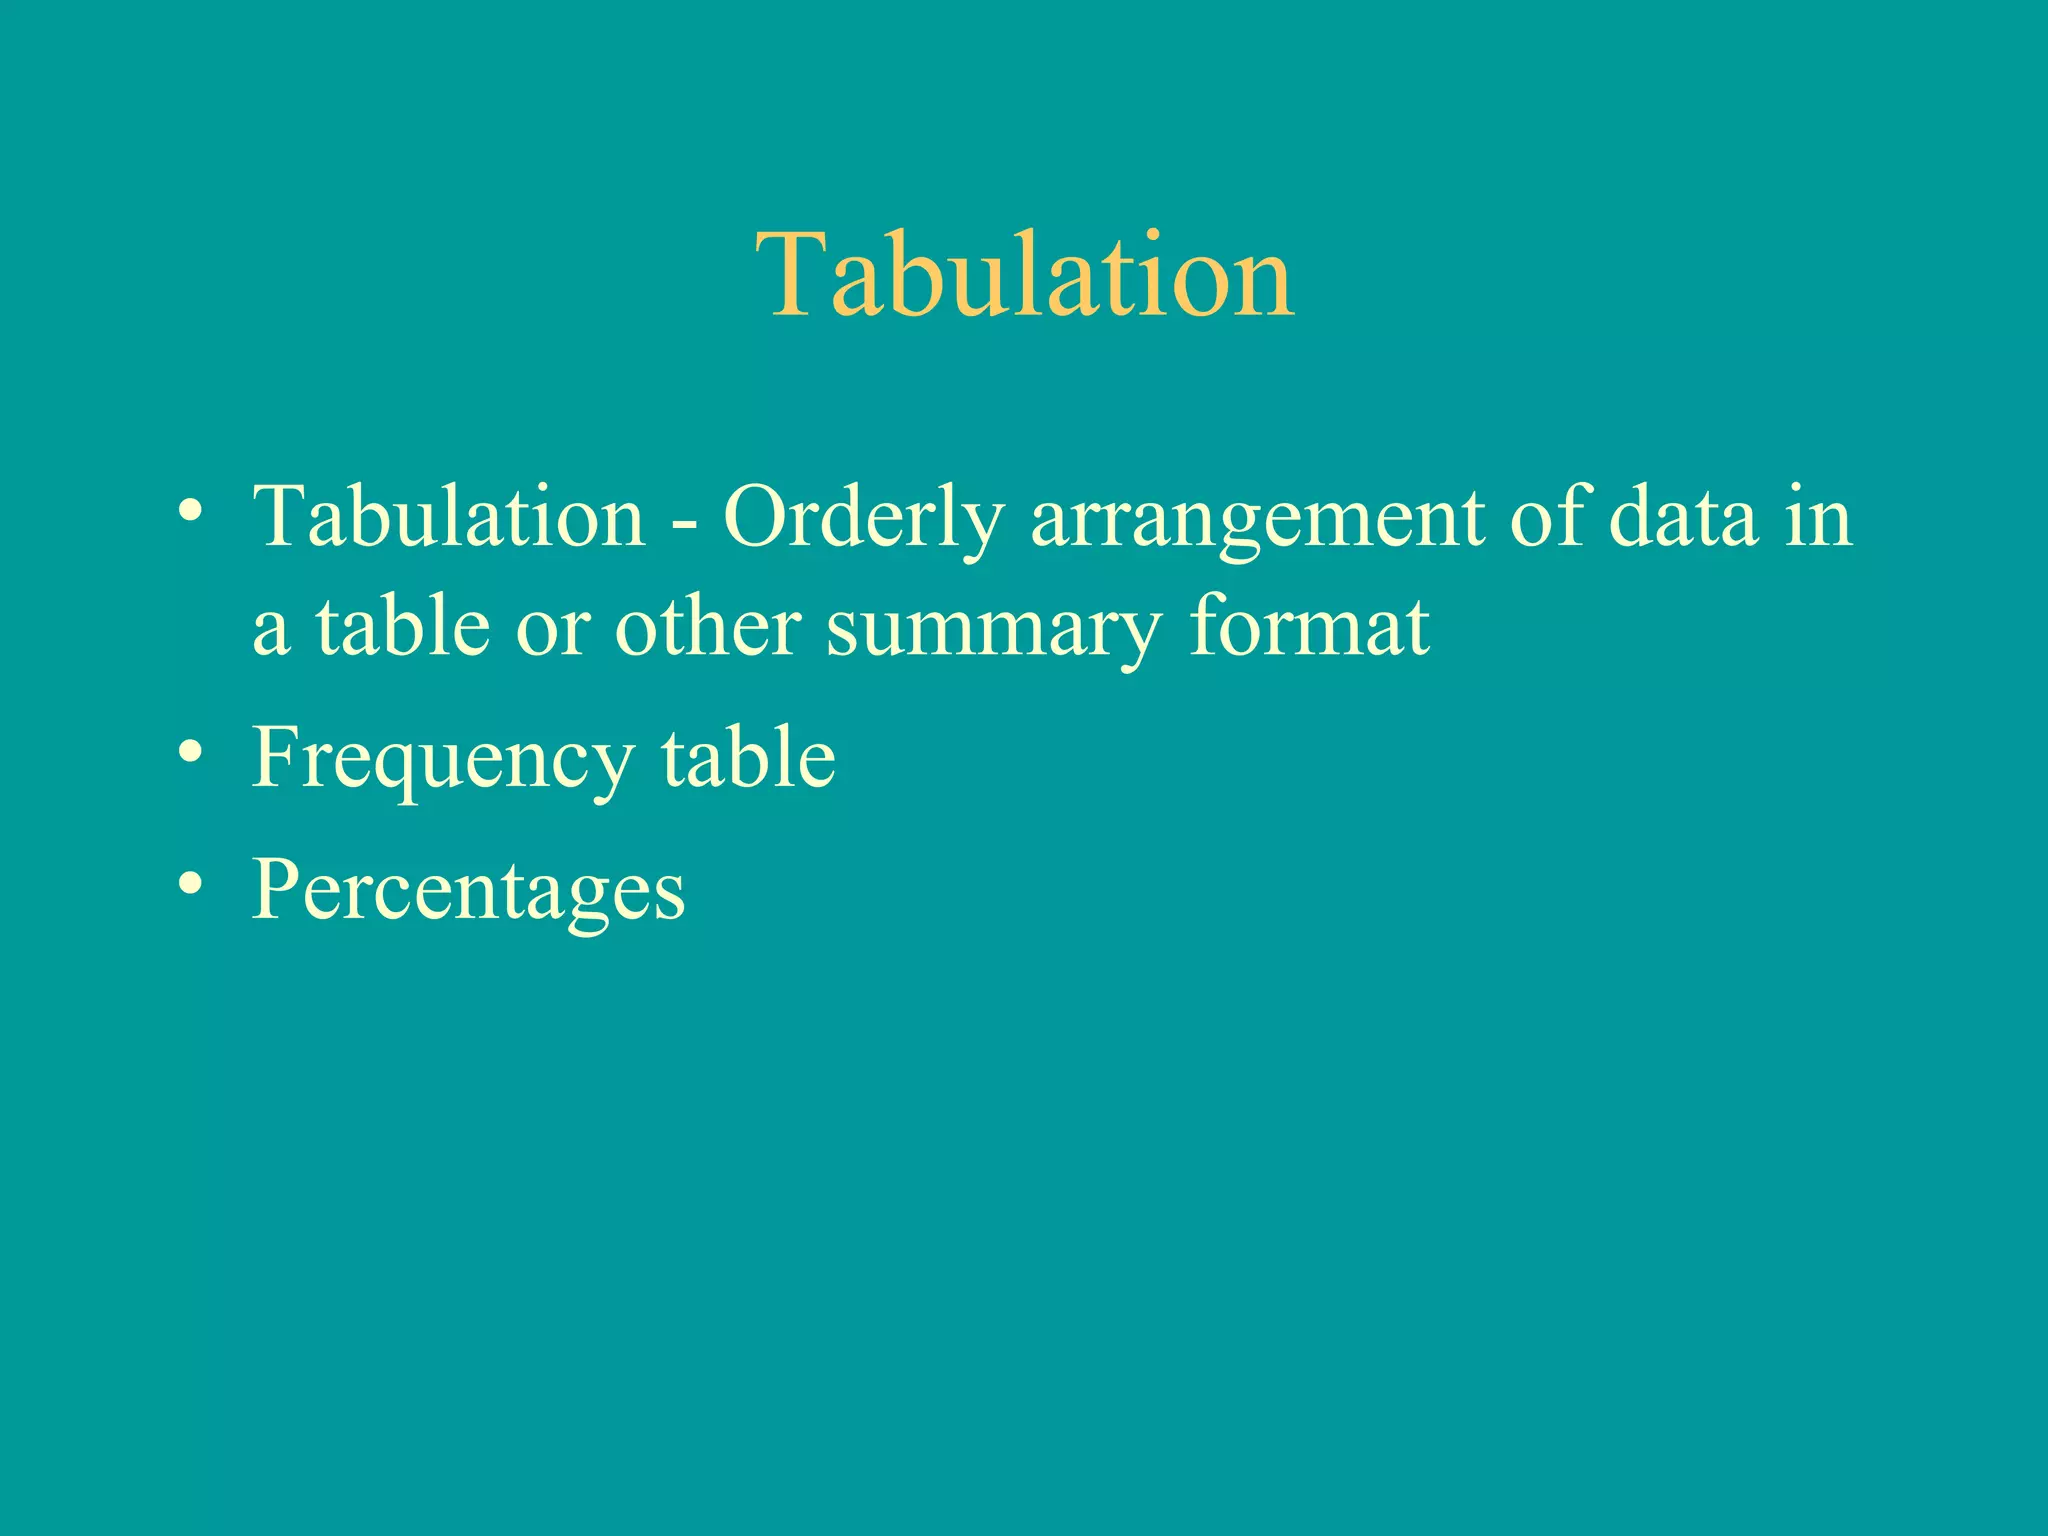
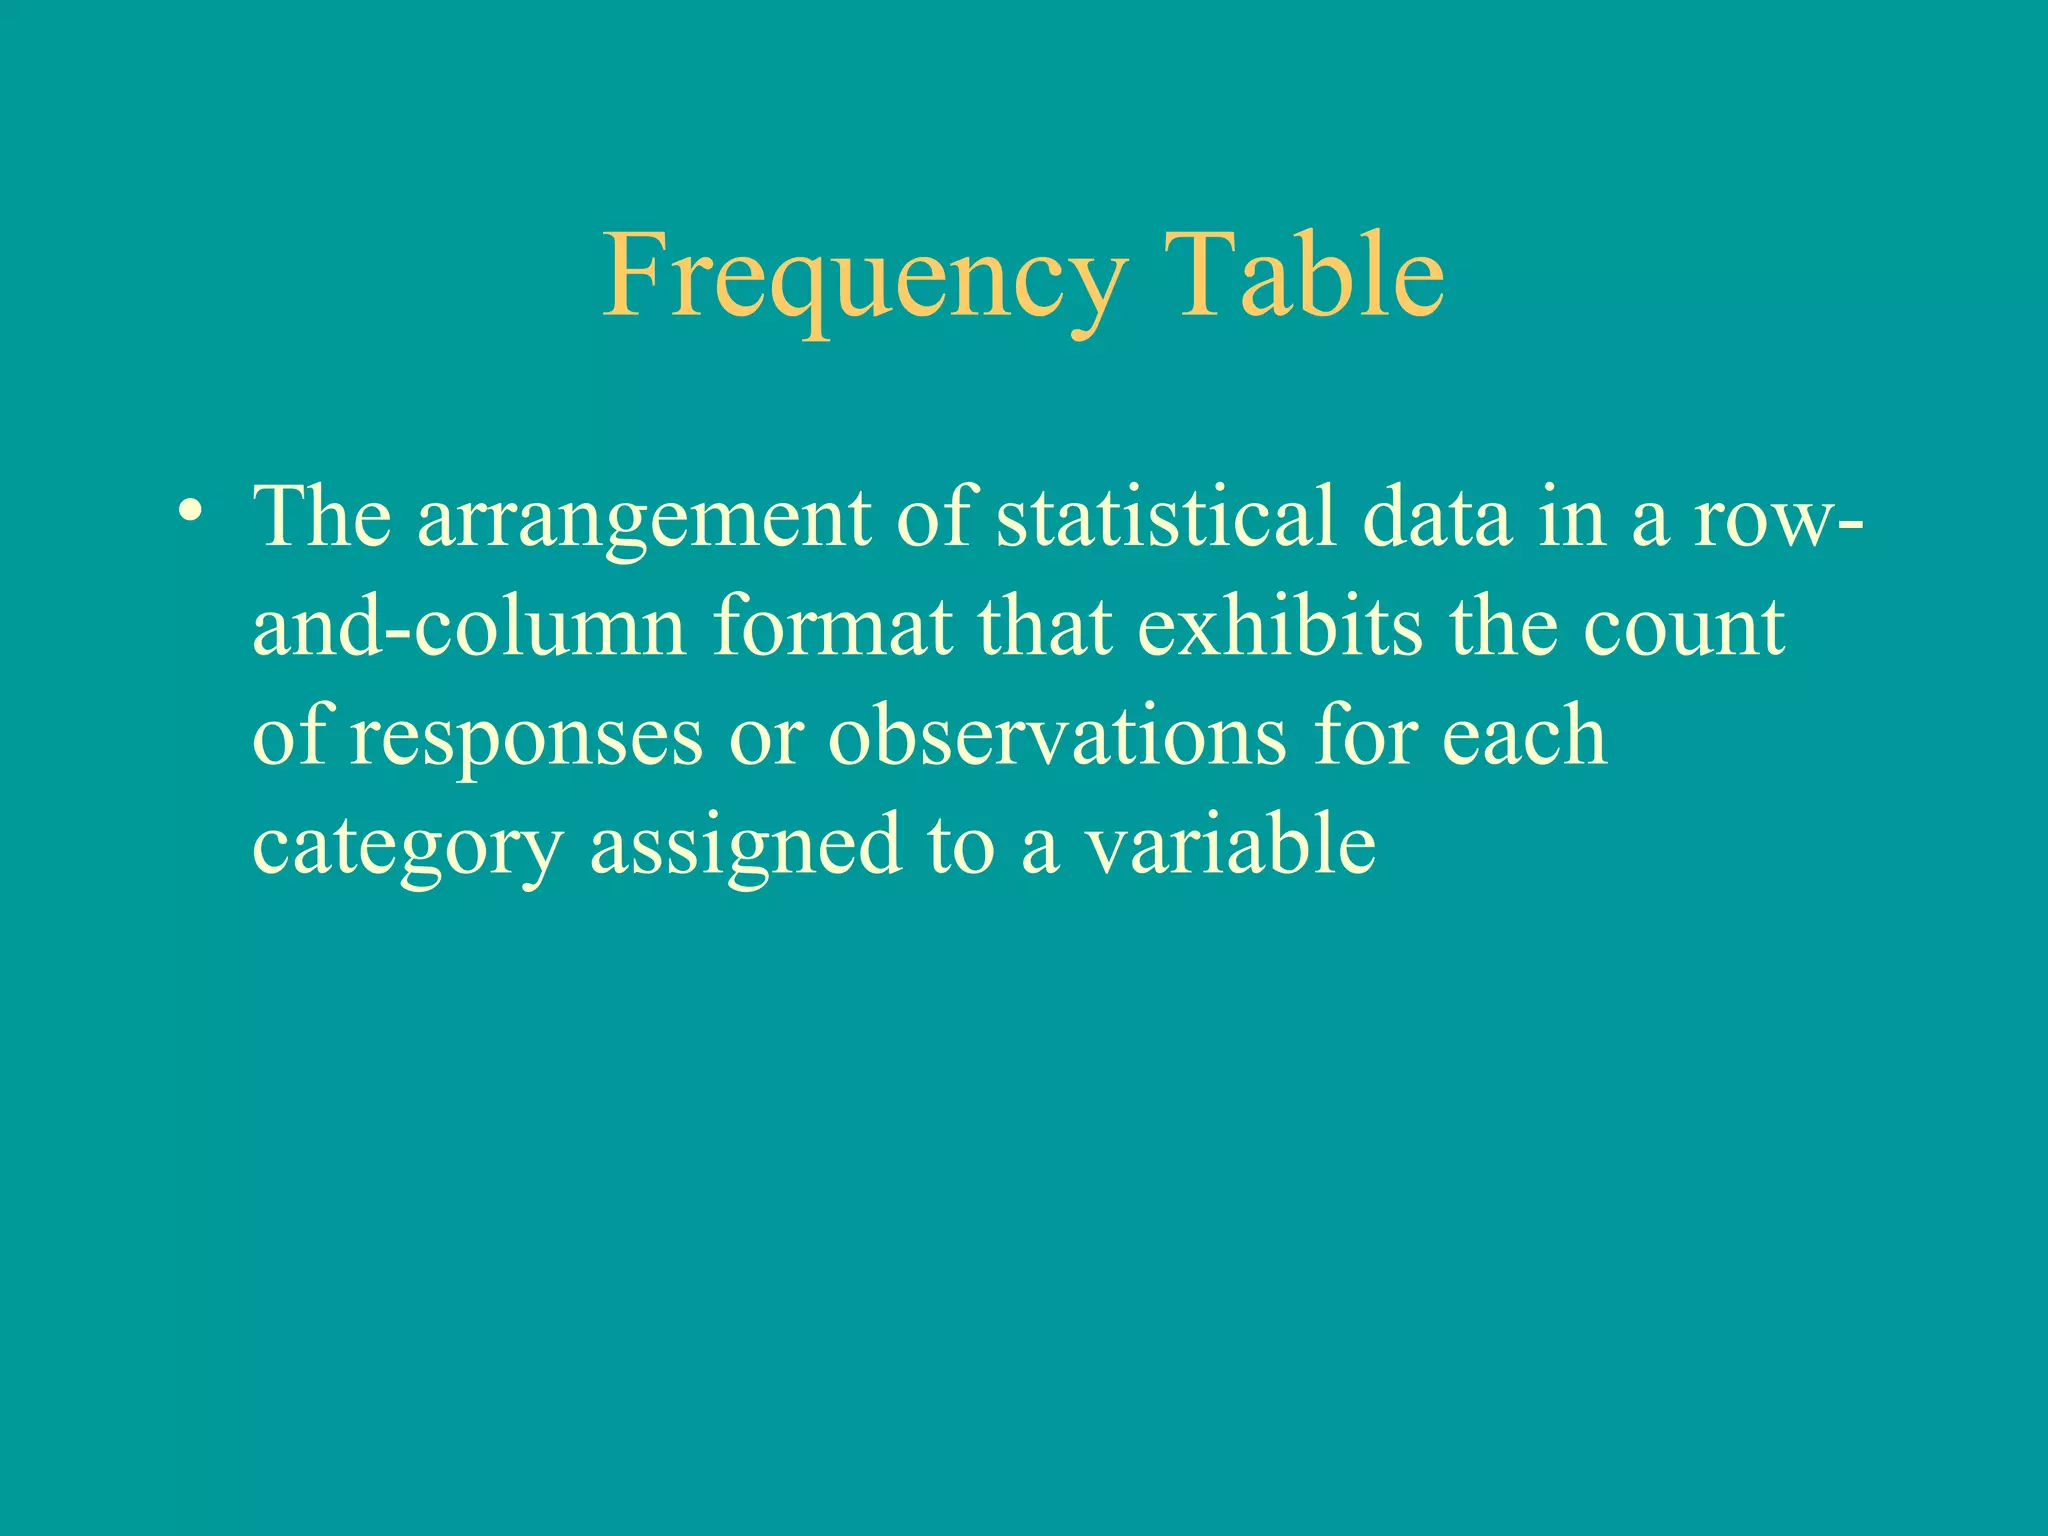
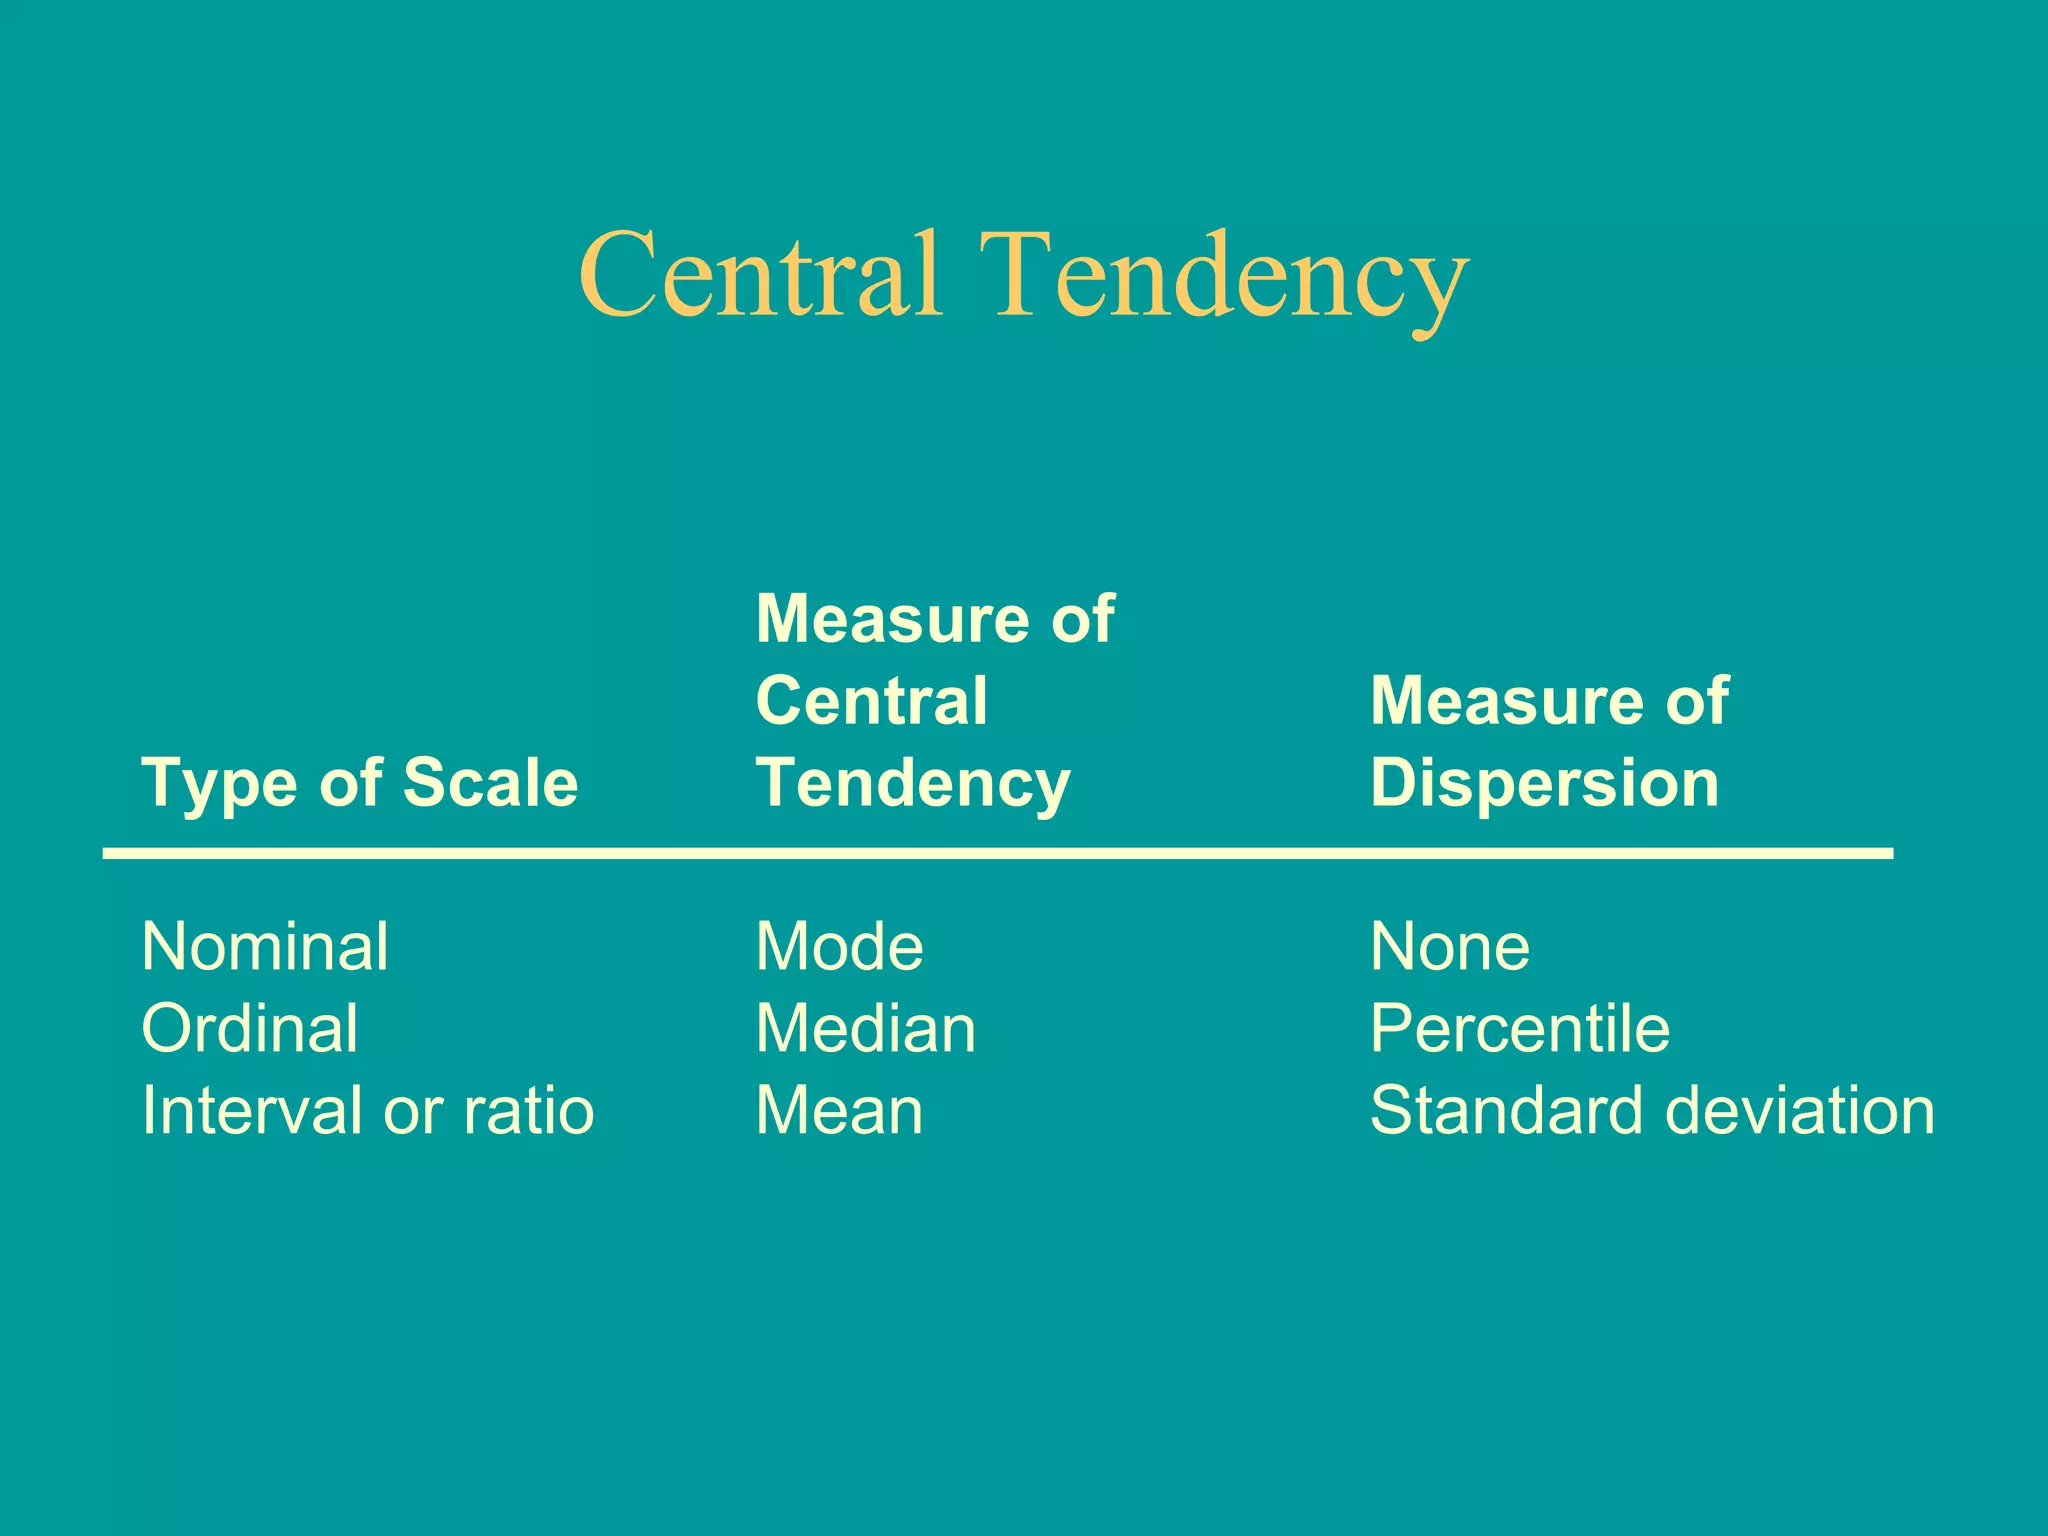
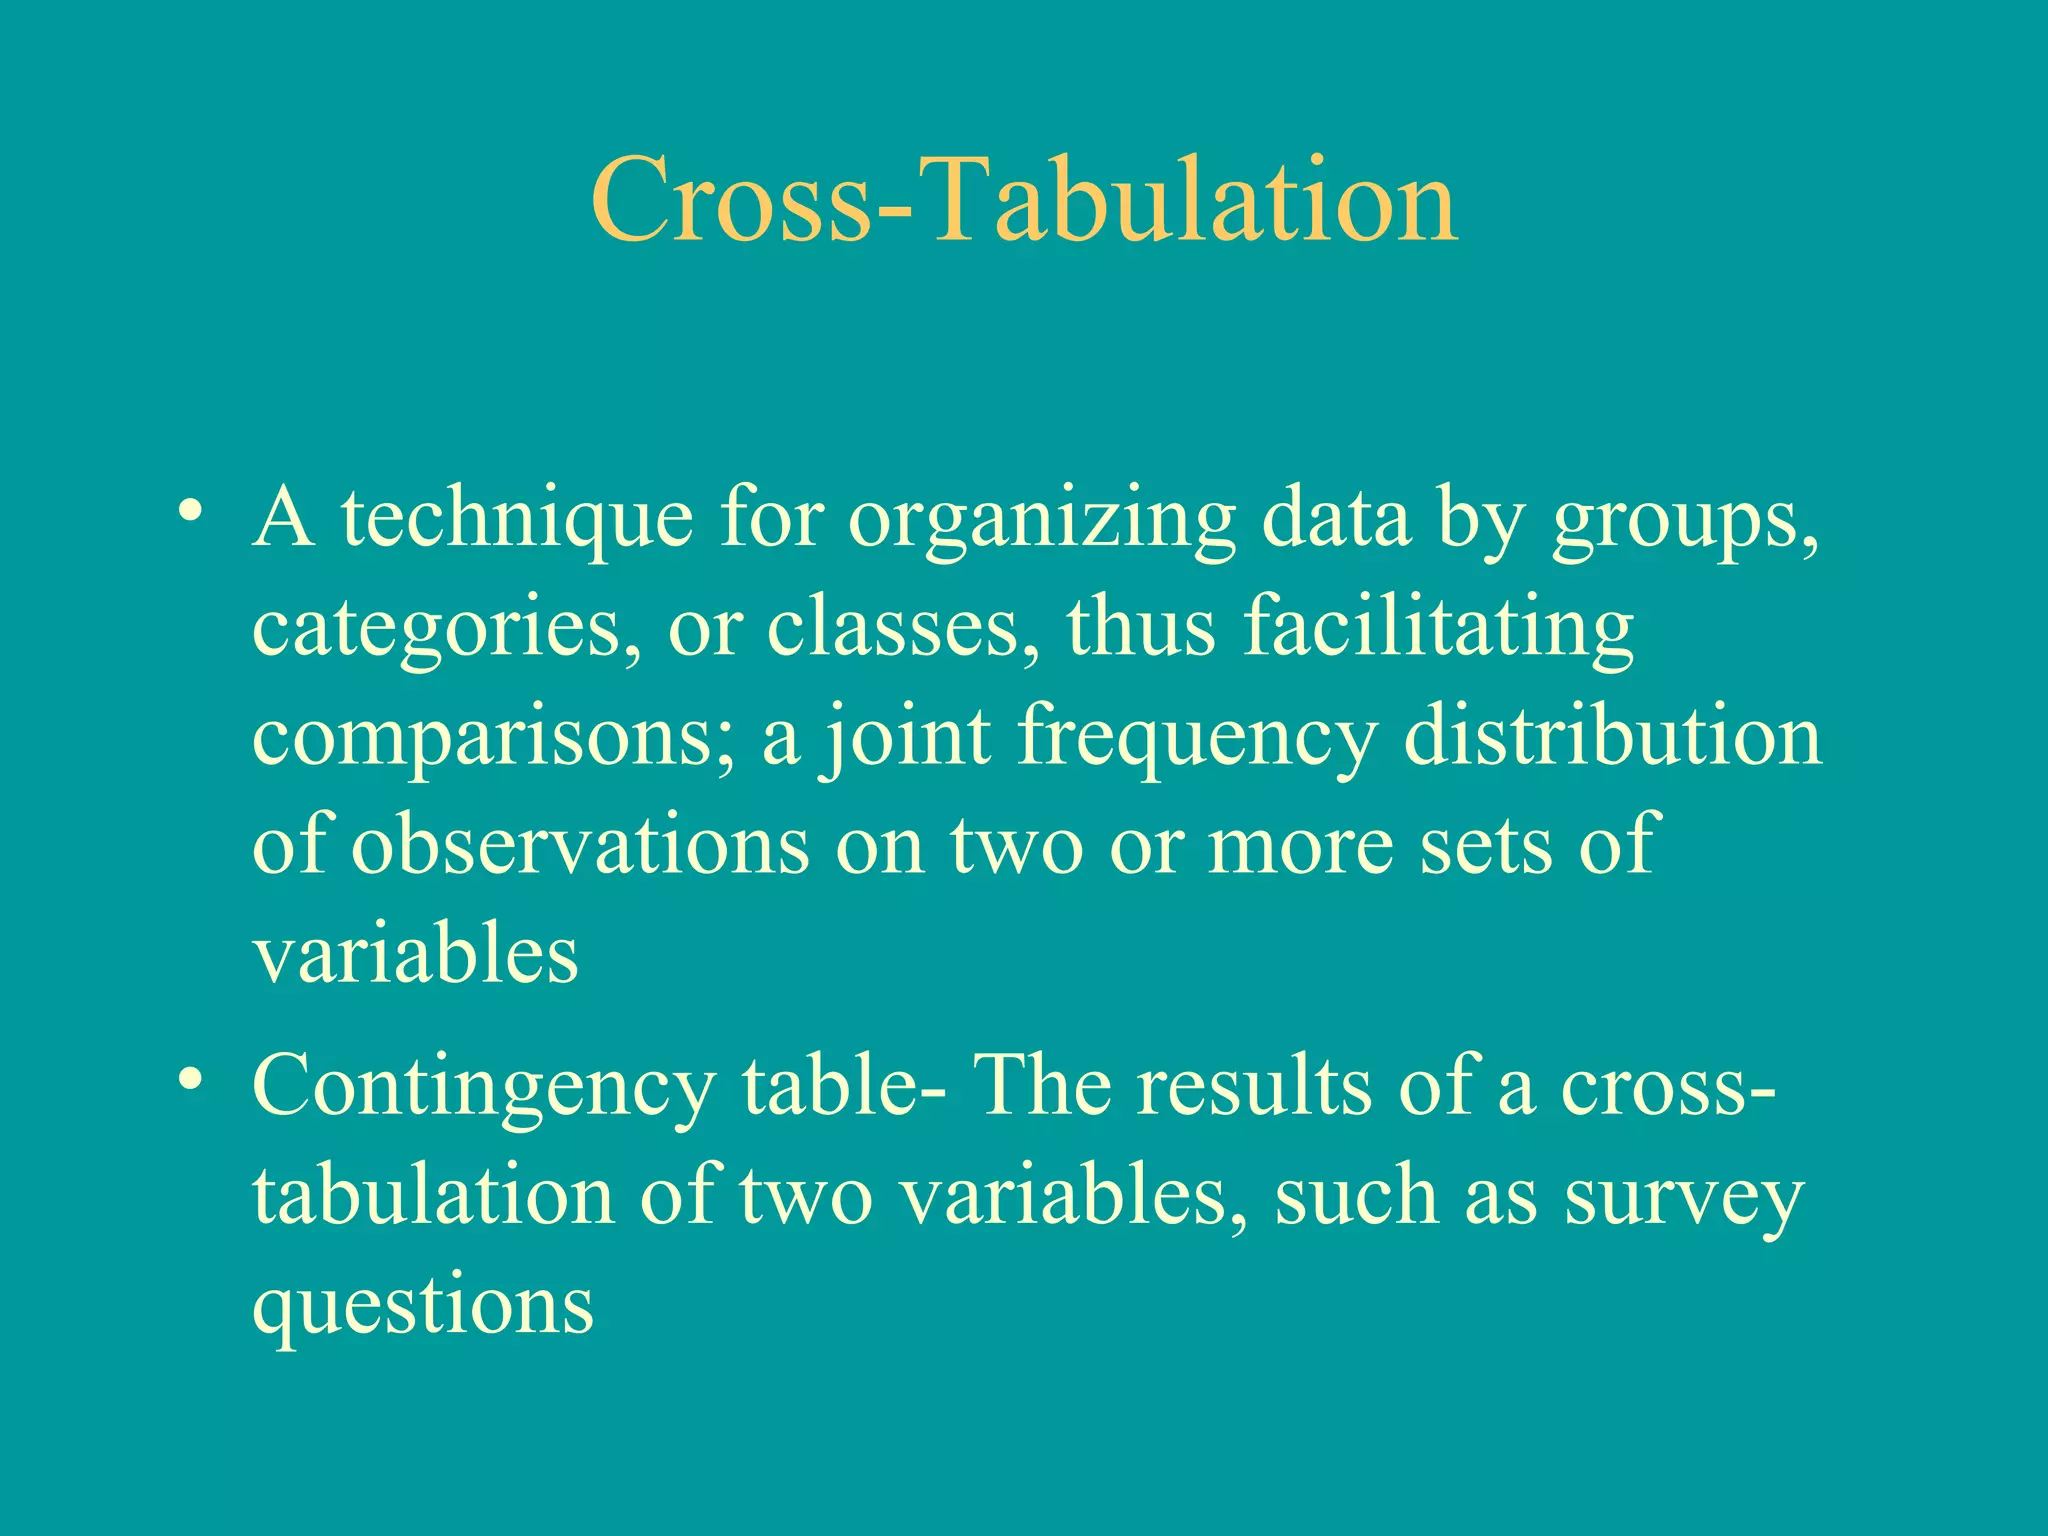
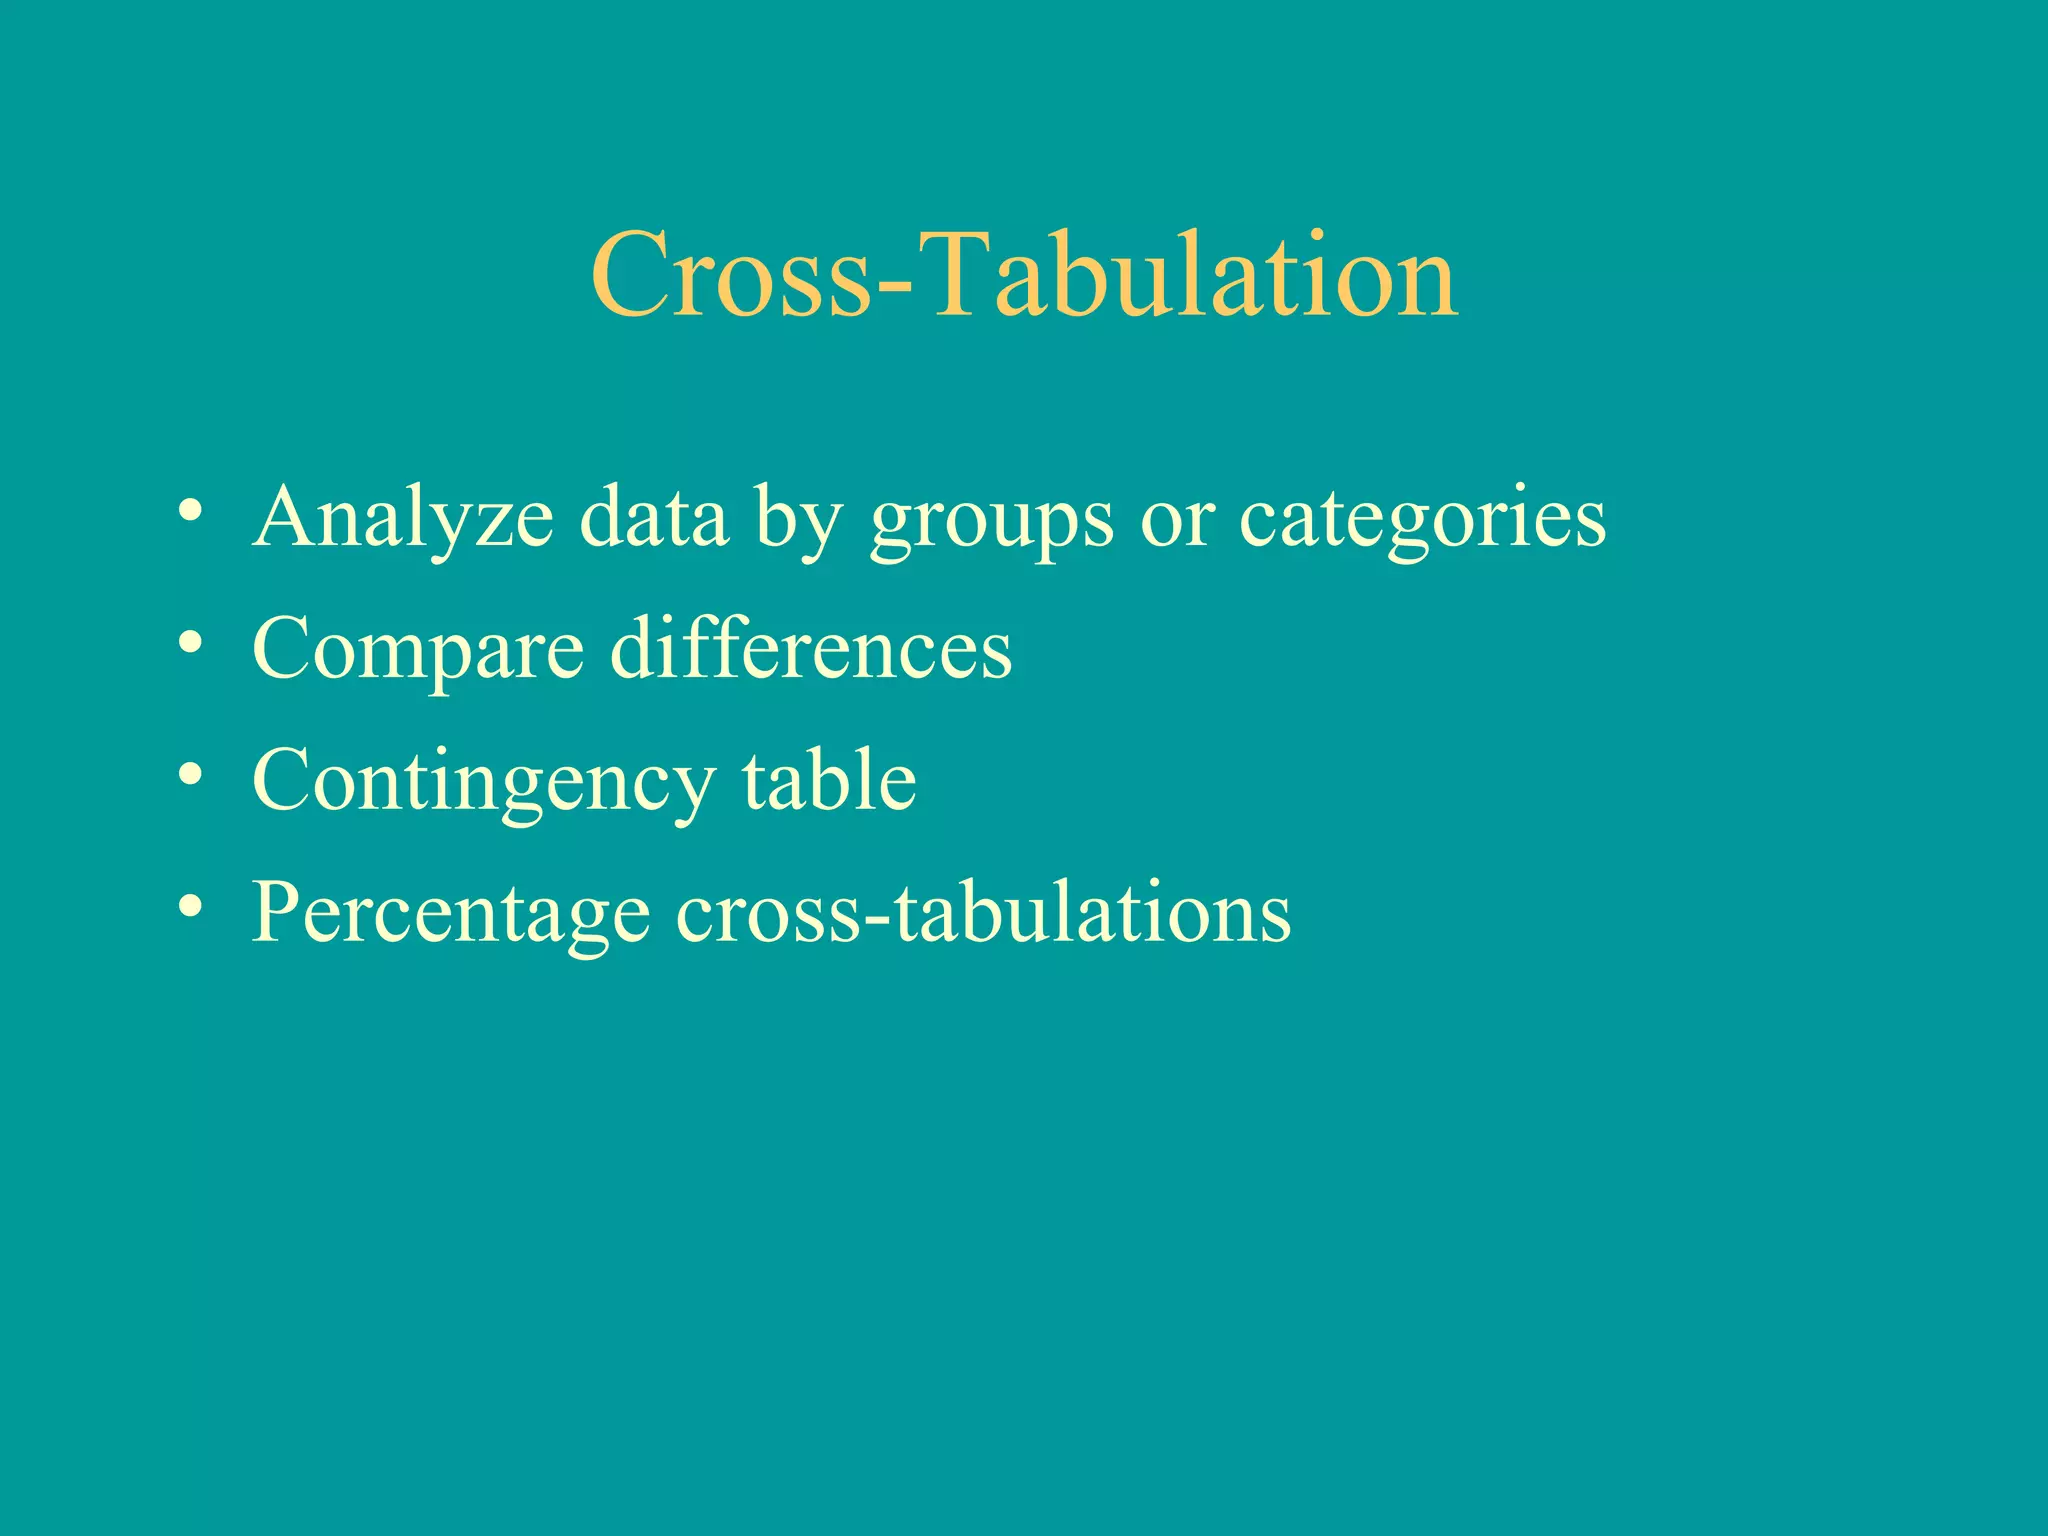
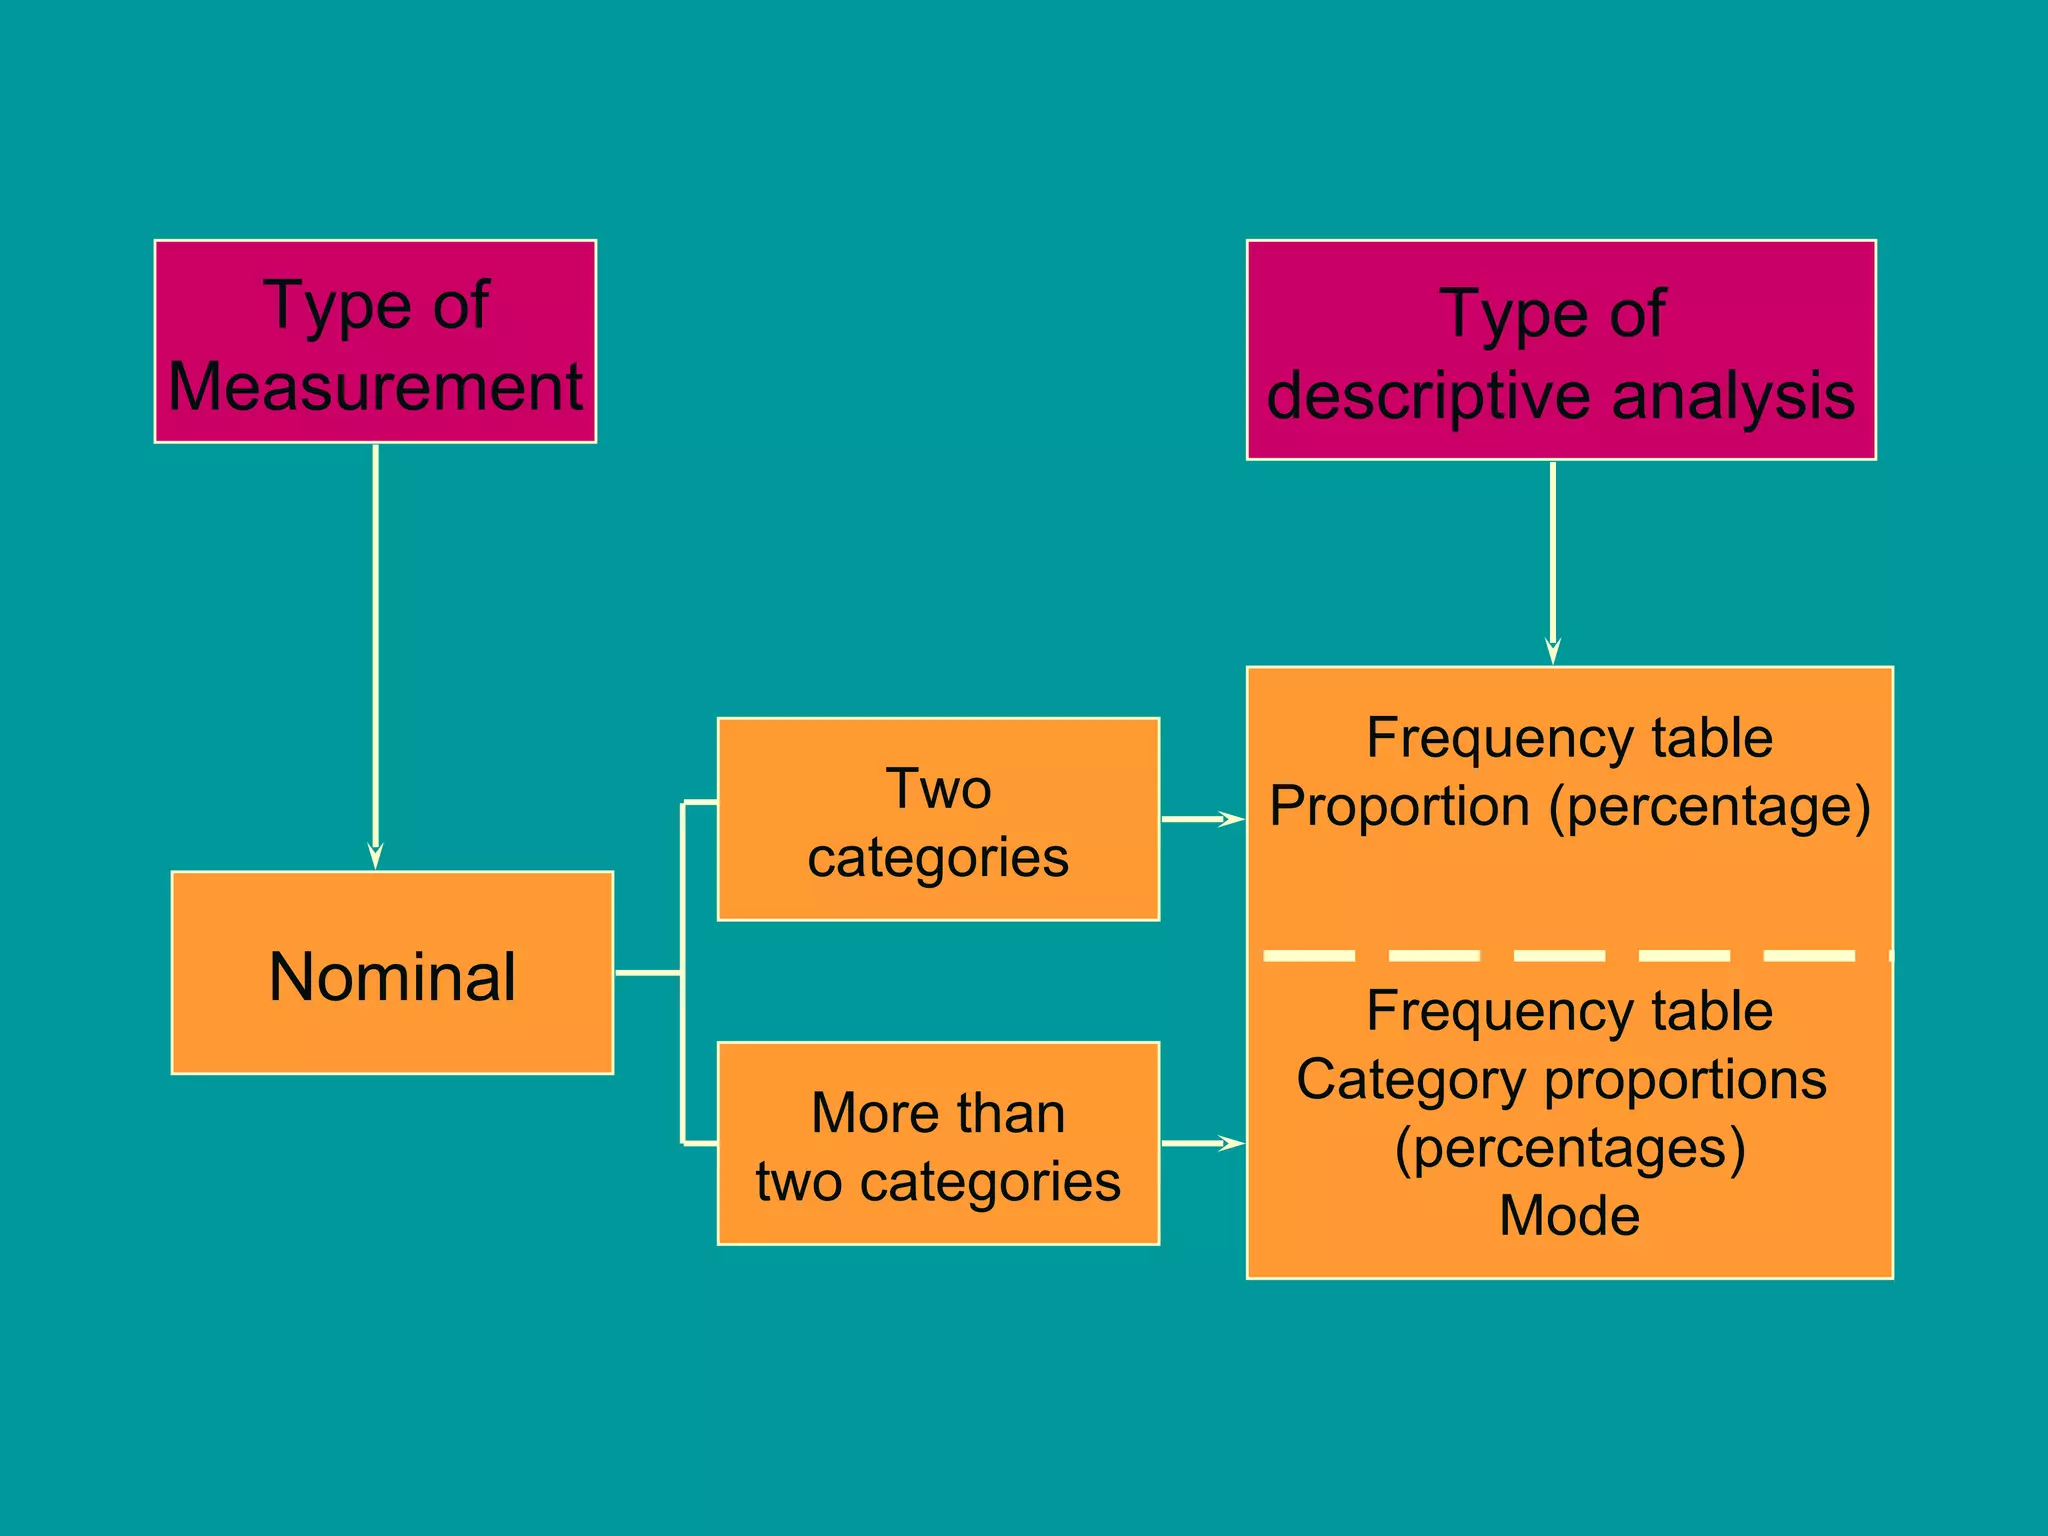
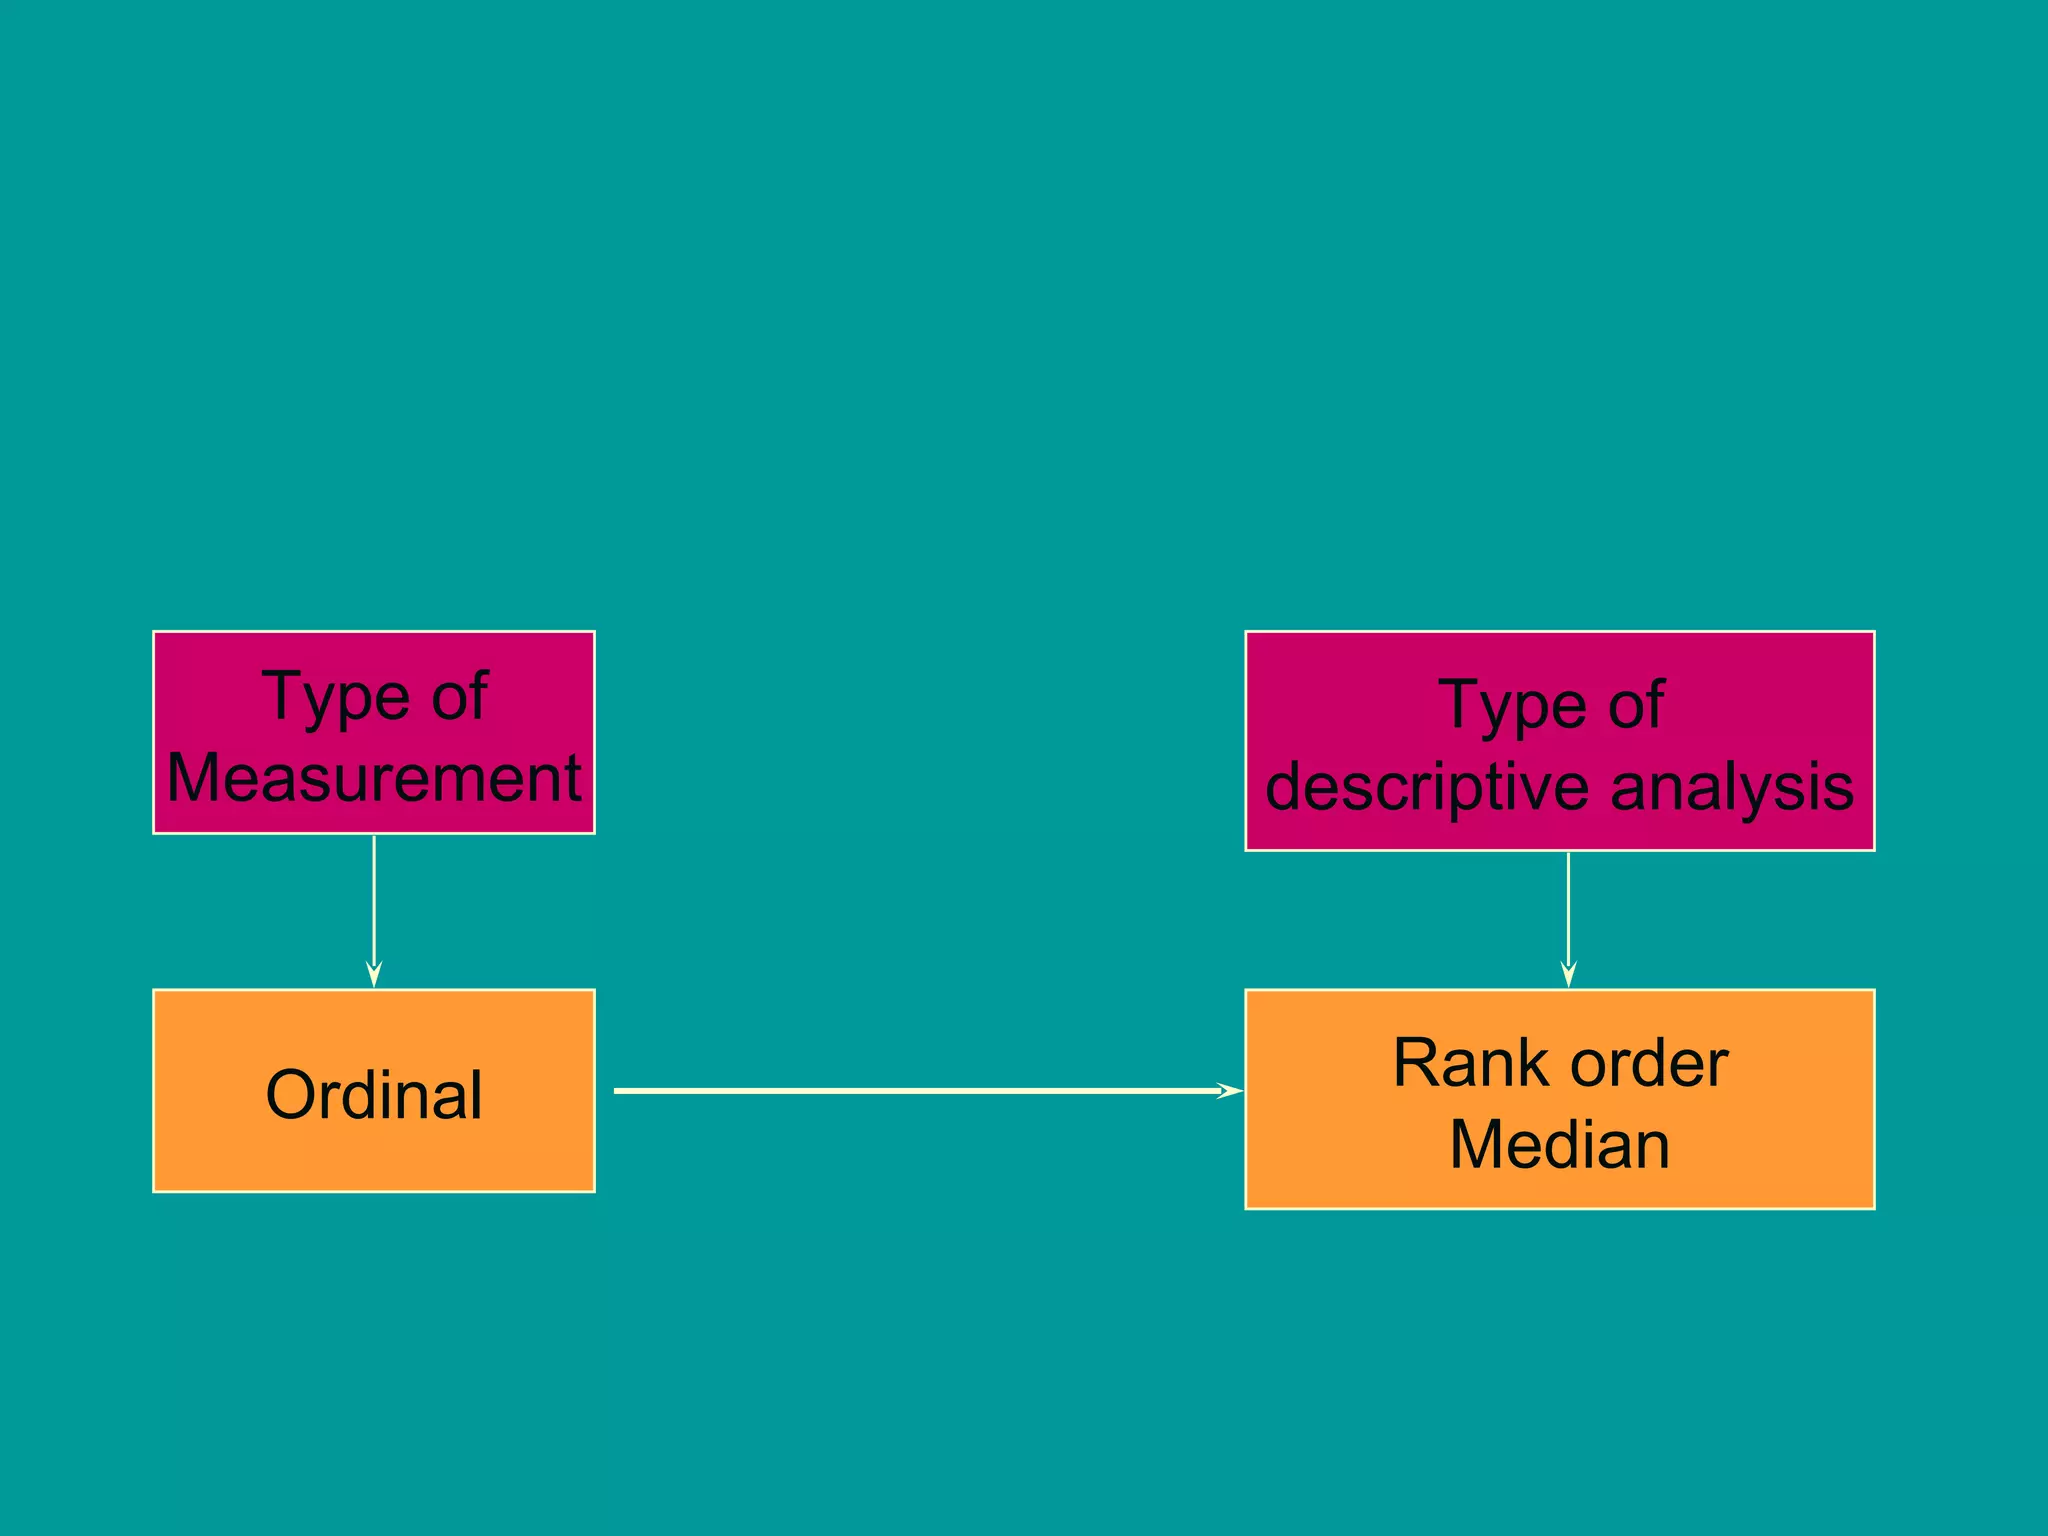
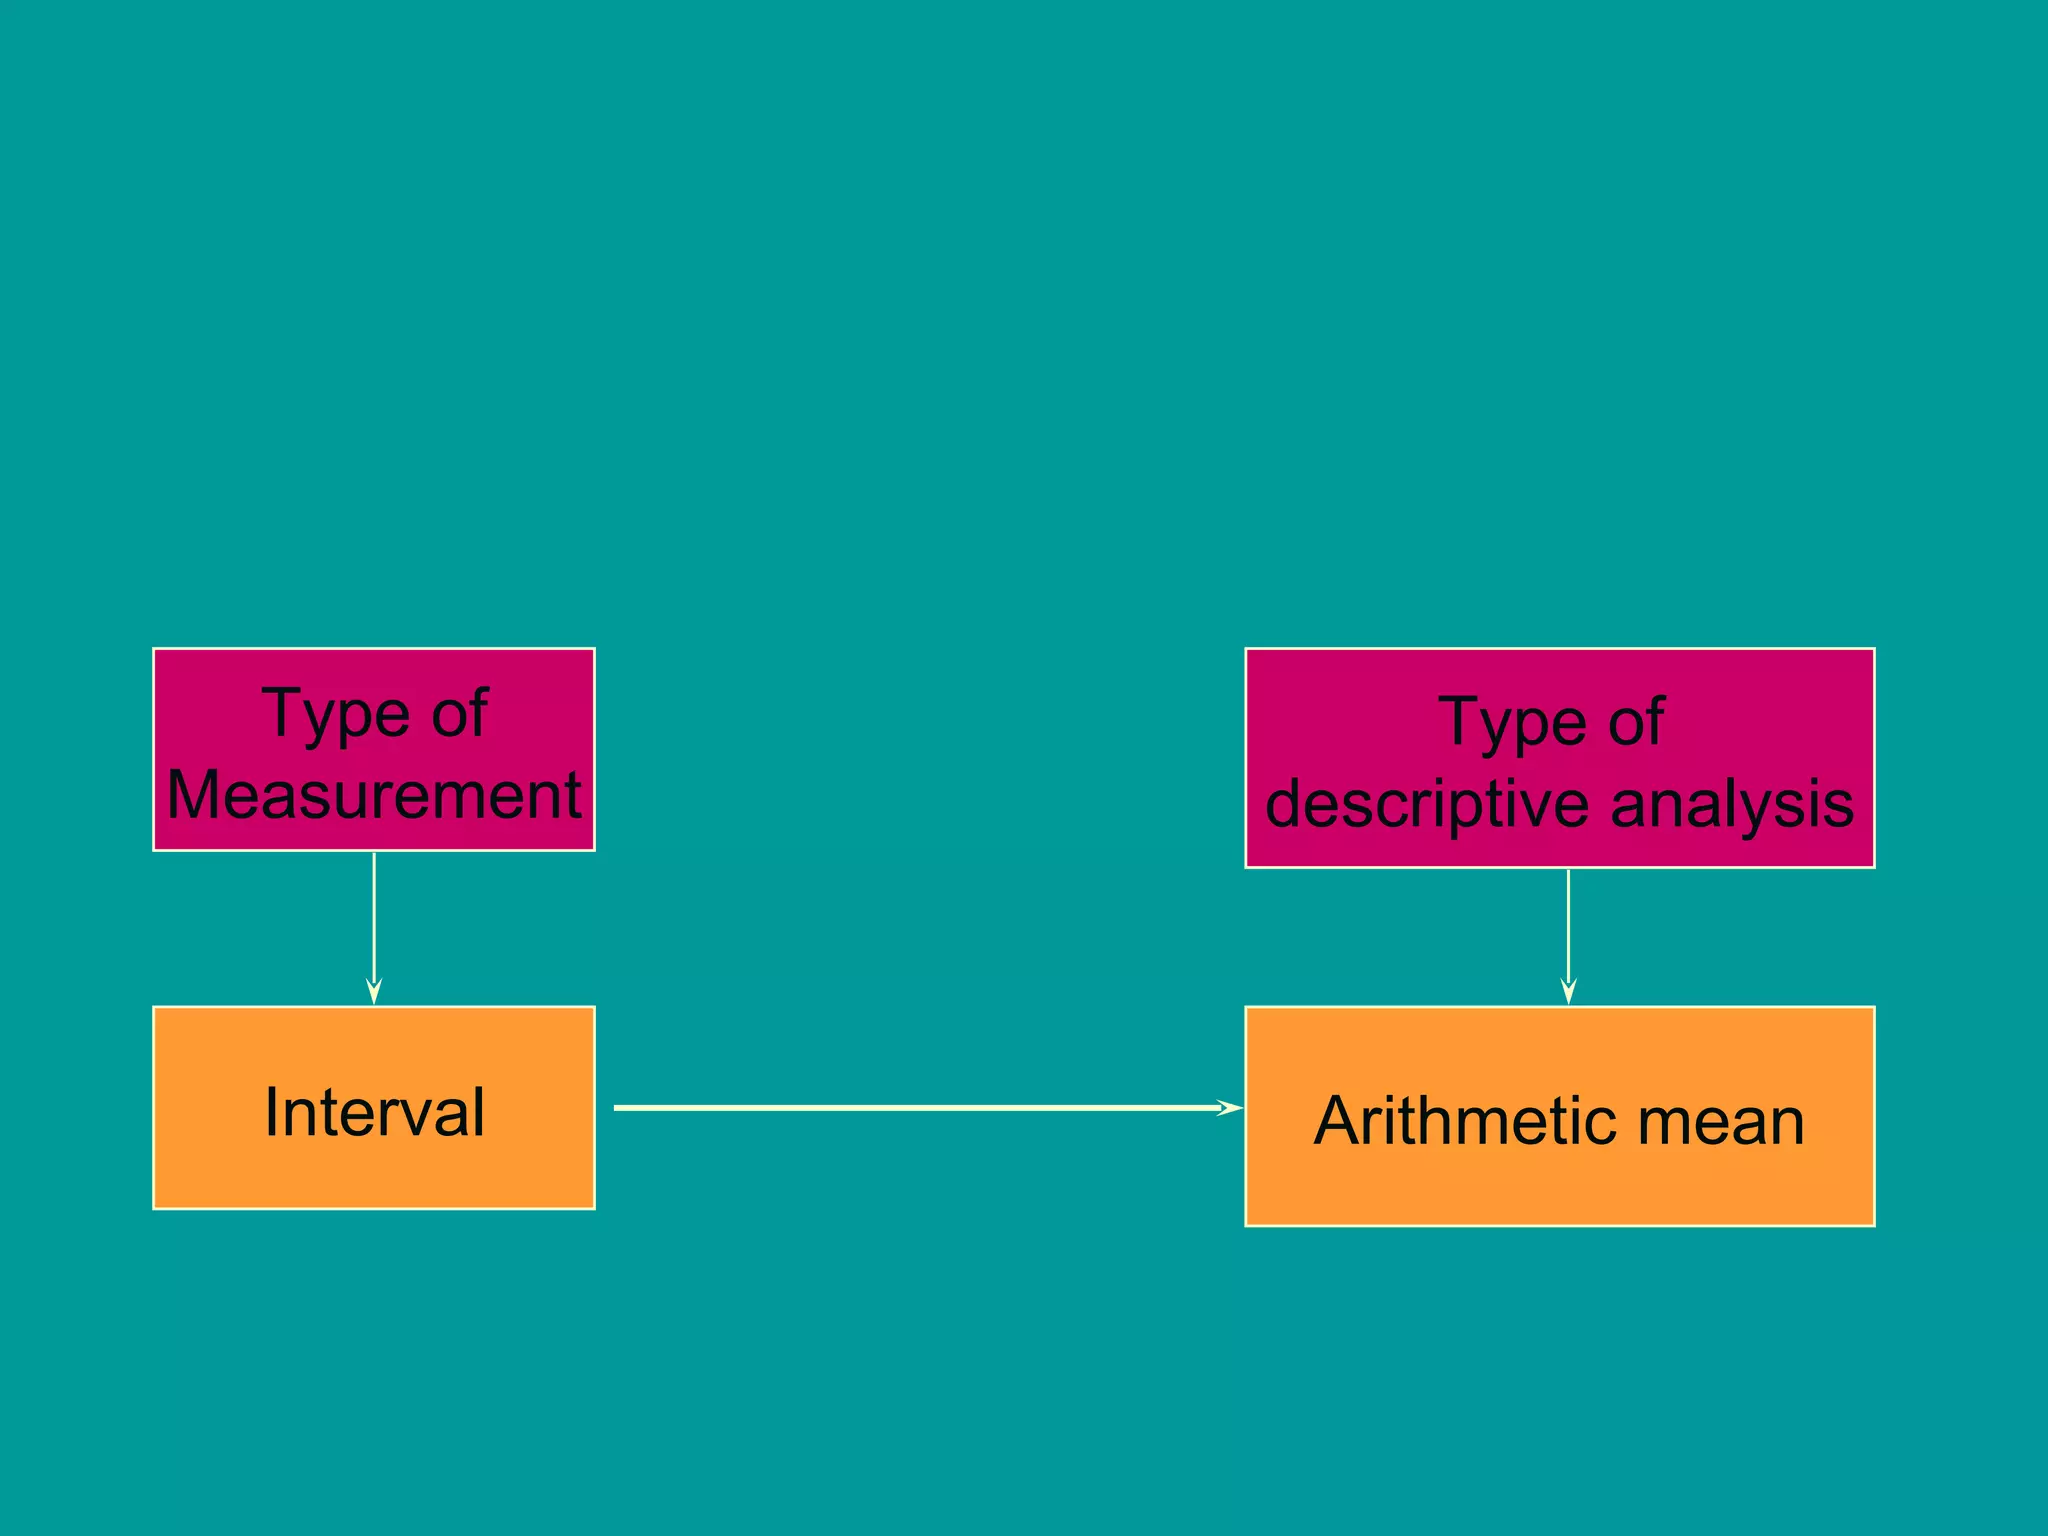
This document discusses various aspects of data collection, preparation, and analysis using SPSS. It covers topics such as data collection methods, data formatting, data preparation including coding, editing, and cleaning, and basic descriptive statistical analysis techniques like frequency tables, measures of central tendency, and cross-tabulation. The goal is to transform raw data into a usable form for answering research questions and testing hypotheses.


![Coded Agents – with UiPath SDK + LangGraph [Virtual Hands-on Workshop]](https://cdn.slidesharecdn.com/ss_thumbnails/codedagentsdeck-251215155422-5497c599-thumbnail.jpg?width=640&height=640&fit=bounds)


![Vibe Coding vs. Spec-Driven Development [Free Meetup]](https://cdn.slidesharecdn.com/ss_thumbnails/vibecodingvsspecdrivendevelopment-251209105622-43f455e7-thumbnail.jpg?width=640&height=640&fit=bounds)