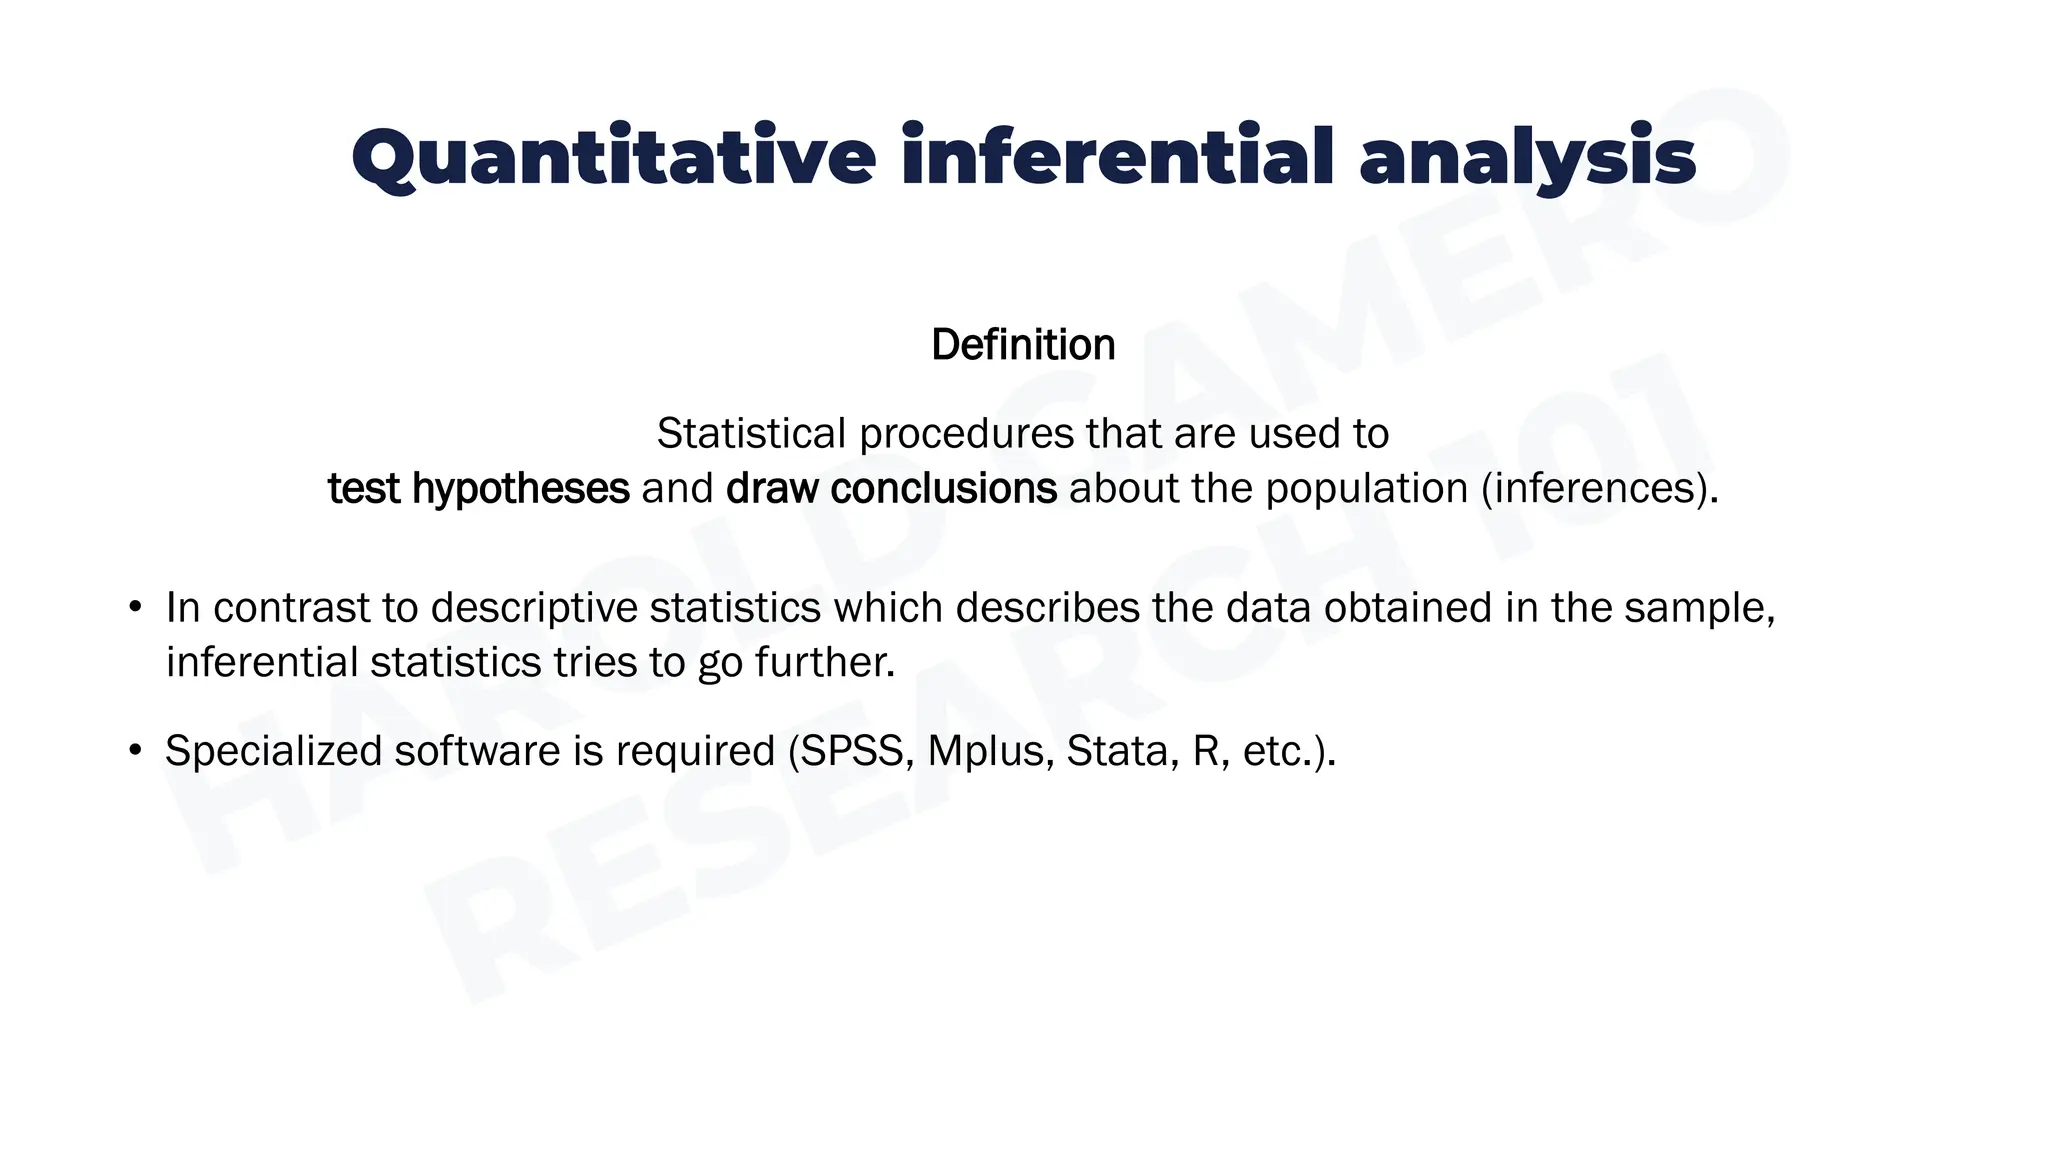
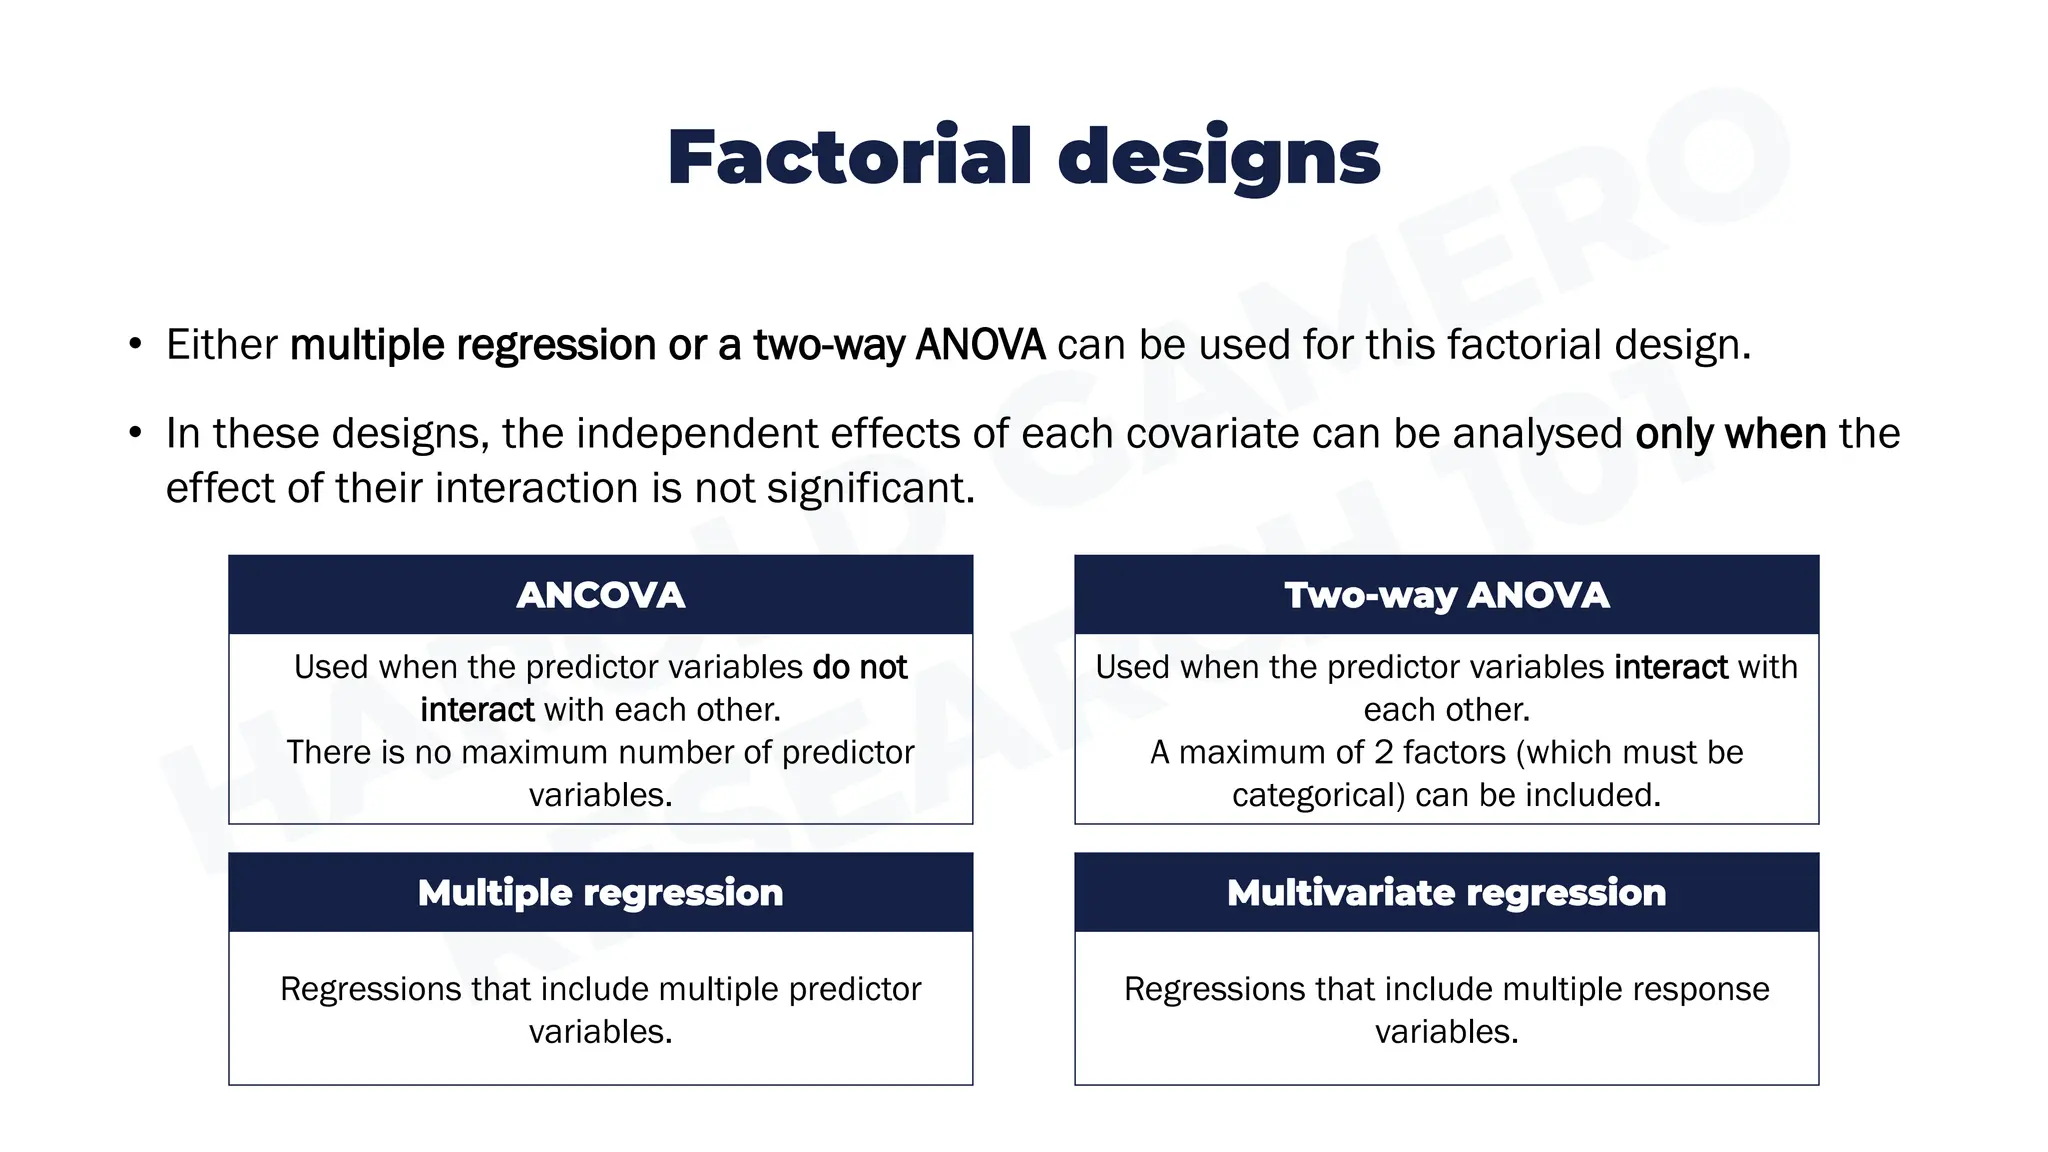
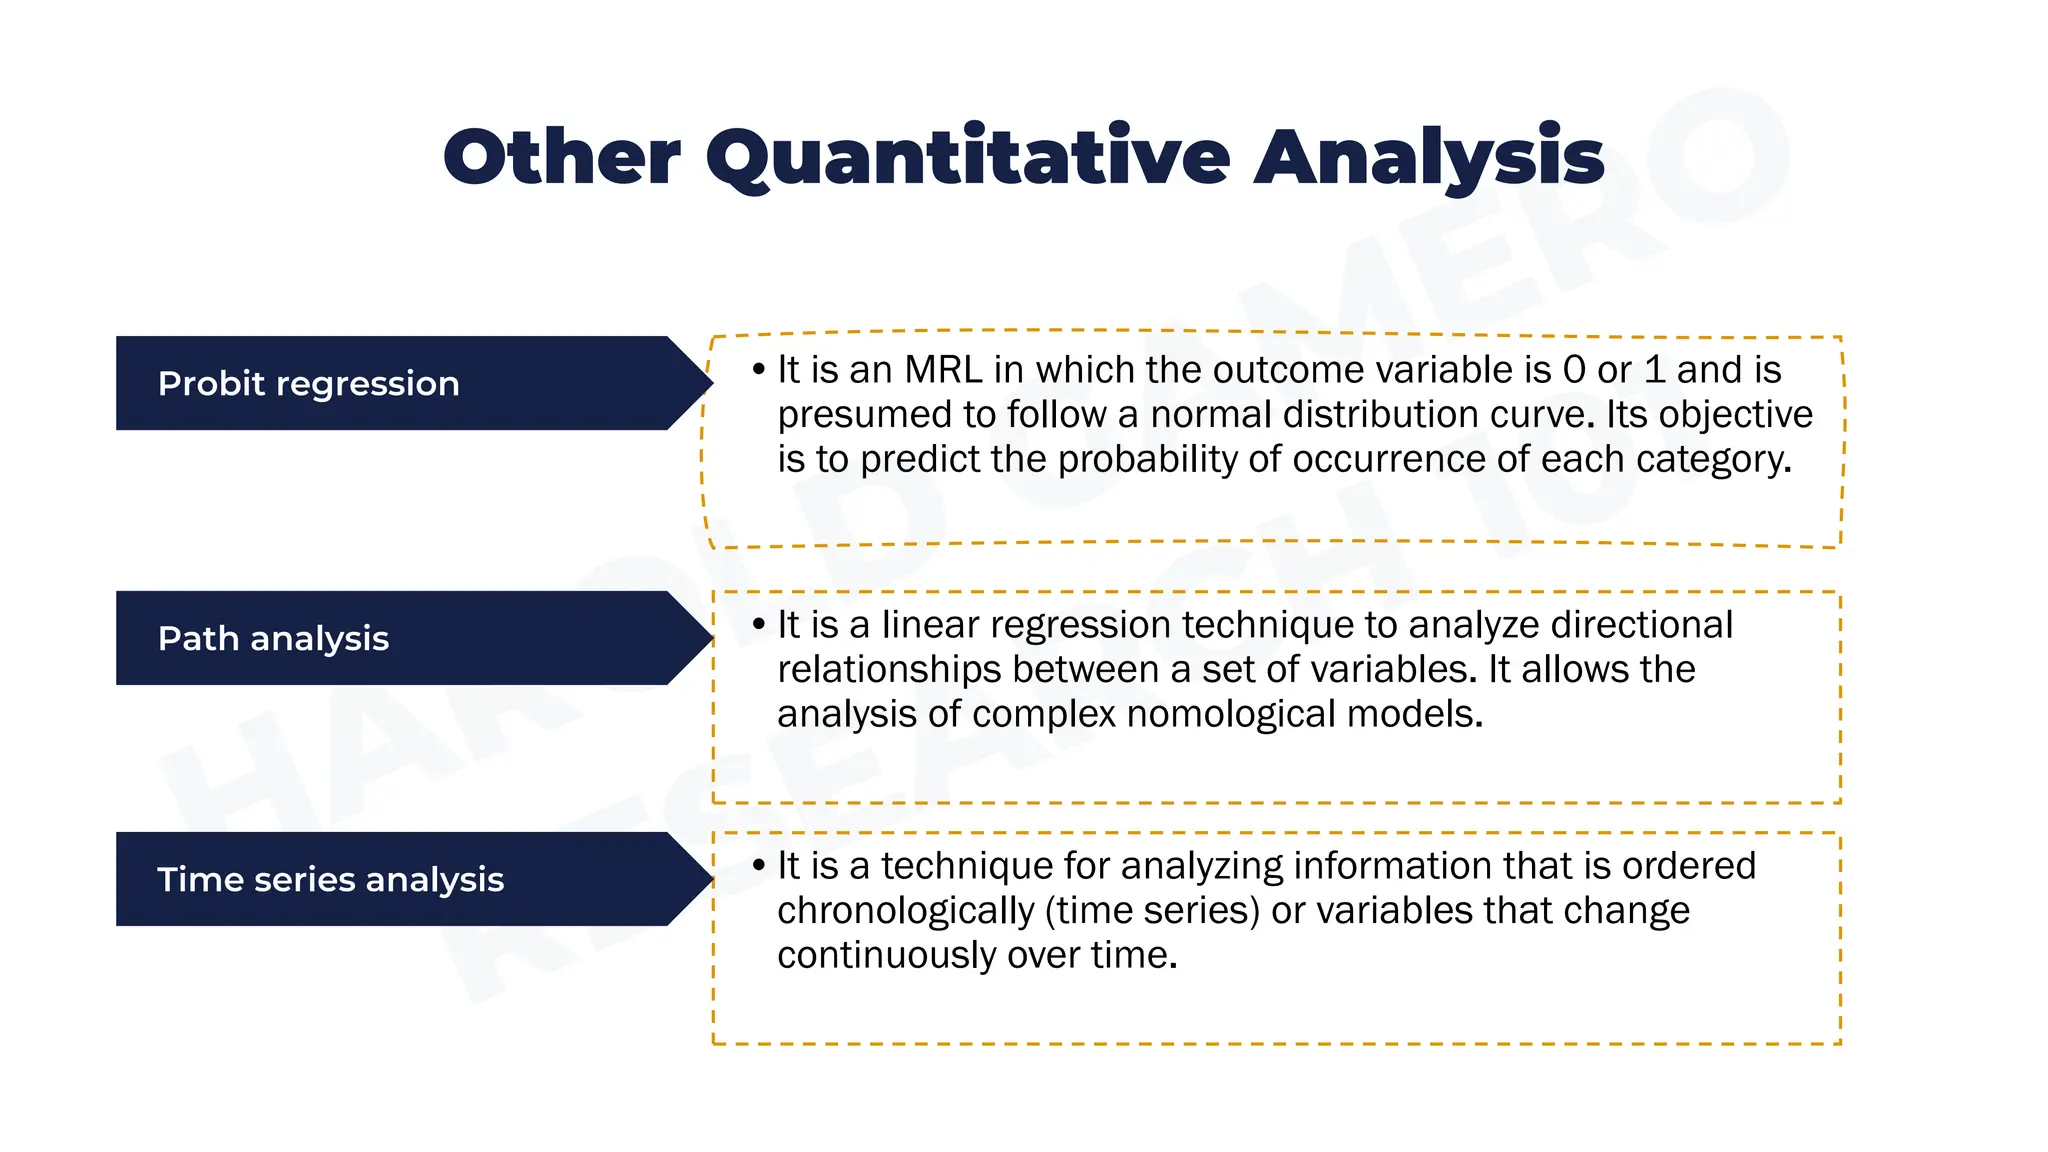
2. Quantitative inferential analysis
Definition
Statistical procedures that are used to
test hypotheses and draw conclusions about the population (inferences).
• In contrast to descriptive statistics which describes the data obtained in the sample,
inferential statistics tries to go further.
• Specialized software is required (SPSS, Mplus, Stata, R, etc.).
3. Basic concepts
• According to Karl Popper theories can only be disproved, not proved.
• The fact that there is evidence today to support a hypothesis does not mean that we will
not find contrary evidence later.
• For this reason, null hypotheses are proposed, contrary to the alternative hypotheses,
which are the ones to be statistically disproved.
• Statistical inferences are never deterministic, but probabilistic, since it is possible that the
findings in the sample will not occur in the same way in the population.
4. 1. Basic concepts
• Two items commonly seen in statistical results are:
• These elements, together with the confidence intervals, give us a good idea of how
close our results (sample) are to the parameters in the population.
Significance level
• Maximum accepted risk that the statistics
(sample) are different from the parameters
(population).
p-value
• Probability of being wrong in rejecting the
null hypothesis (type I error).
• That is, "accepting an alternative hypothesis
that is not truly correct".
5. General linear model
A system of equations used to represent linear patterns of relationships between variables.
6. General linear model
• A.k.a. linear regression model, it describes the relationship between two or more variables.
• By taking more predictor (independent) variables, the model would be as follows:
• The predictor variables can also be control variables (covariates), which in turn, can be
dichotomous (or dummy).
7. General linear model
• GLM comprises a family of methods that can be used to perform quite sophisticated analyses.
• Depending on the number of predictor (independent) variables and the number of response
(dependent) variables, the following variations of ANOVA can be used:
• MANOVA and MANCOVA are types of multivariate regressions.
1 factor 2 or more factors
1 response variable ANOVA ANCOVA
2 or more response
variables
MANOVA MANCOVA
8. Structural Equation Models
• They are interrelated systems of regression equations, where the result of one
regression is modelled as a predictor of another regression.
In any regression model (as SEM), the designation of predictor
variables should be based on the theoretical underpinnings of the
phenomenon and not on the fit of the data collected.
!
9. Comparison Between Groups
• One of the most used inferential analyses is to compare results between groups (e.g.,
treatment vs. control group).
• In this case the test to be used is ANOVA (one-way).
• ANOVA uses Student’s t-test to identify statistically significant differences between
the means of the groups compared.
• A significant difference depends not only on the average of each group, but also on its
standard error.
10. Comparison between groups
Groups without statistically
significant differences
Groups with statistically
significant differences
CI = µ ± 2σ = 95%. CI = µ ± 2σ = 95%.
11. Comparison between groups
Example: Happiness * Sex
Significance greater than 0.05
Differences between groups are NOT
statistically significant.
This is confirmed by the
overlap of the confidence
intervals.
12. Comparison between groups
Example: Happiness * Age bracket
Significance less than 0.05
The differences between groups ARE
statistically significant.
Those under 30 have
lower levels of happiness
than those aged 50 and
over.
13. Factorial designs
• To know the effects of 2 or more predictor variables (dummy) and their interactions on a
response variable.
• e.g. We wish to know the effects of a special curriculum on academic performance,
according to the type of enrolment:
Curriculum Type of registration
Traditional Regular
Special Special
Academic performance
14. Factorial designs
• Either multiple regression or a two-way ANOVA can be used for this factorial design.
• In these designs, the independent effects of each covariate can be analysed only when the
effect of their interaction is not significant.
Two-way ANOVA
Used when the predictor variables interact with
each other.
A maximum of 2 factors (which must be
categorical) can be included.
ANCOVA
Used when the predictor variables do not
interact with each other.
There is no maximum number of predictor
variables.
Multivariate regression
Regressions that include multiple response
variables.
Multiple regression
Regressions that include multiple predictor
variables.
15. Other Quantitative Analysis
•Data reduction technique that groups a large number of
items (observed data) into a smaller group of variables
(latent).
•Used to measure convergent and discriminant validity.
Factor analysis
•Technique for classifying observations into one of many
nominal categories.
•Similar to multiple regression, but with a nominal dependent
variable.
Discriminant analysis
•It is an MRL in which the outcome variable is binary and is
presumed to follow a logistic distribution curve.
•Its objective is to predict the probability of occurrence) of
that variable.
Logistic regression
16. Other Quantitative Analysis
•It is an MRL in which the outcome variable is 0 or 1 and is
presumed to follow a normal distribution curve. Its objective
is to predict the probability of occurrence of each category.
Probit regression
•It is a linear regression technique to analyze directional
relationships between a set of variables. It allows the
analysis of complex nomological models.
Path analysis
•It is a technique for analyzing information that is ordered
chronologically (time series) or variables that change
continuously over time.
Time series analysis