Data Presentation, Analysisand
Interpretation
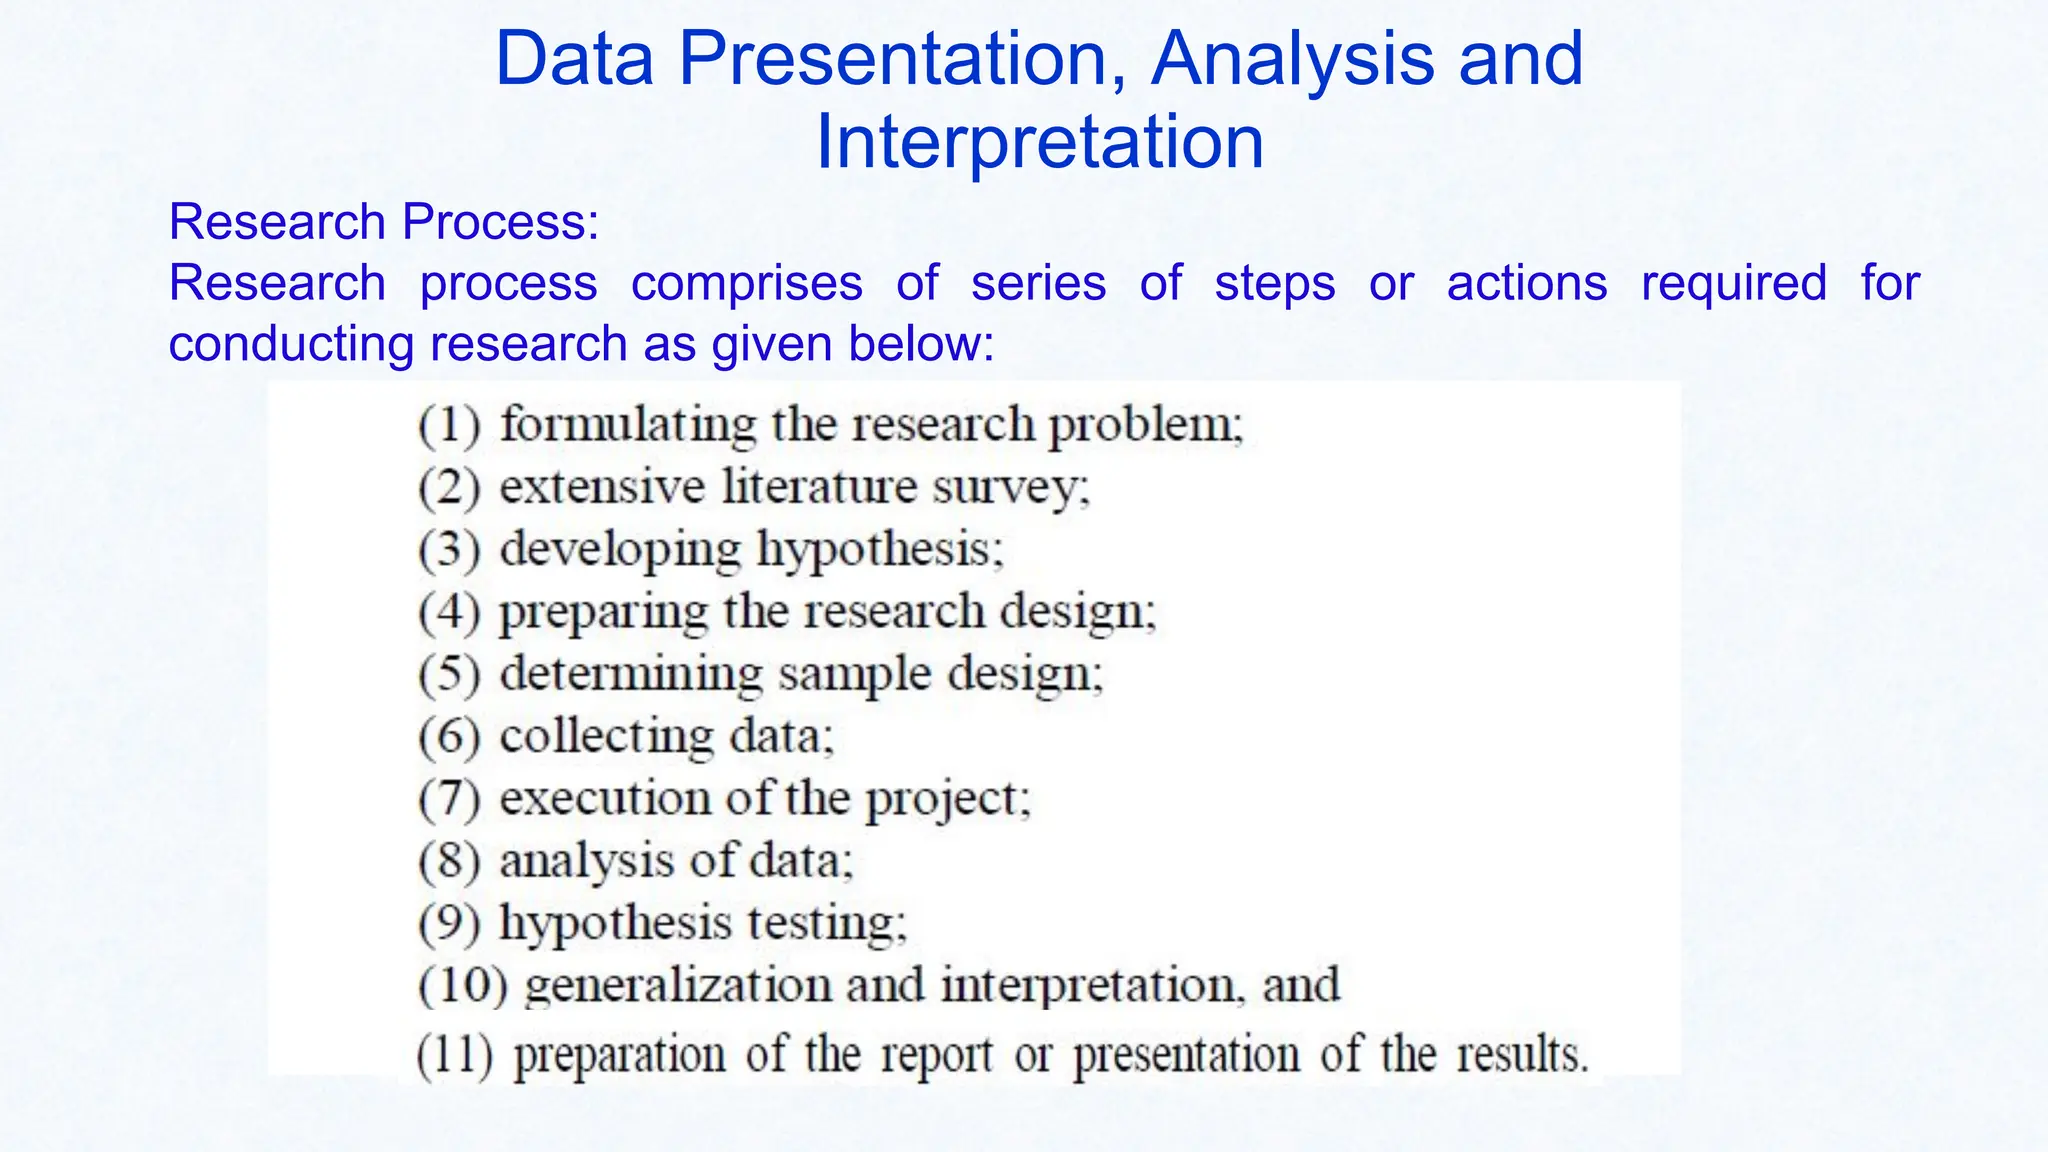
Research Process:
Research process comprises of series of steps or actions required for
conducting research as given below:
2.
Data Presentation, Analysisand
Interpretation
Data analysis
▪ An attempt by the researcher to
summarize collected data.
Data Interpretation
▪ Attempt to find meaning
3.
Definition of data:
Anyobservation collected in respect of any characteristic or event is called
data.
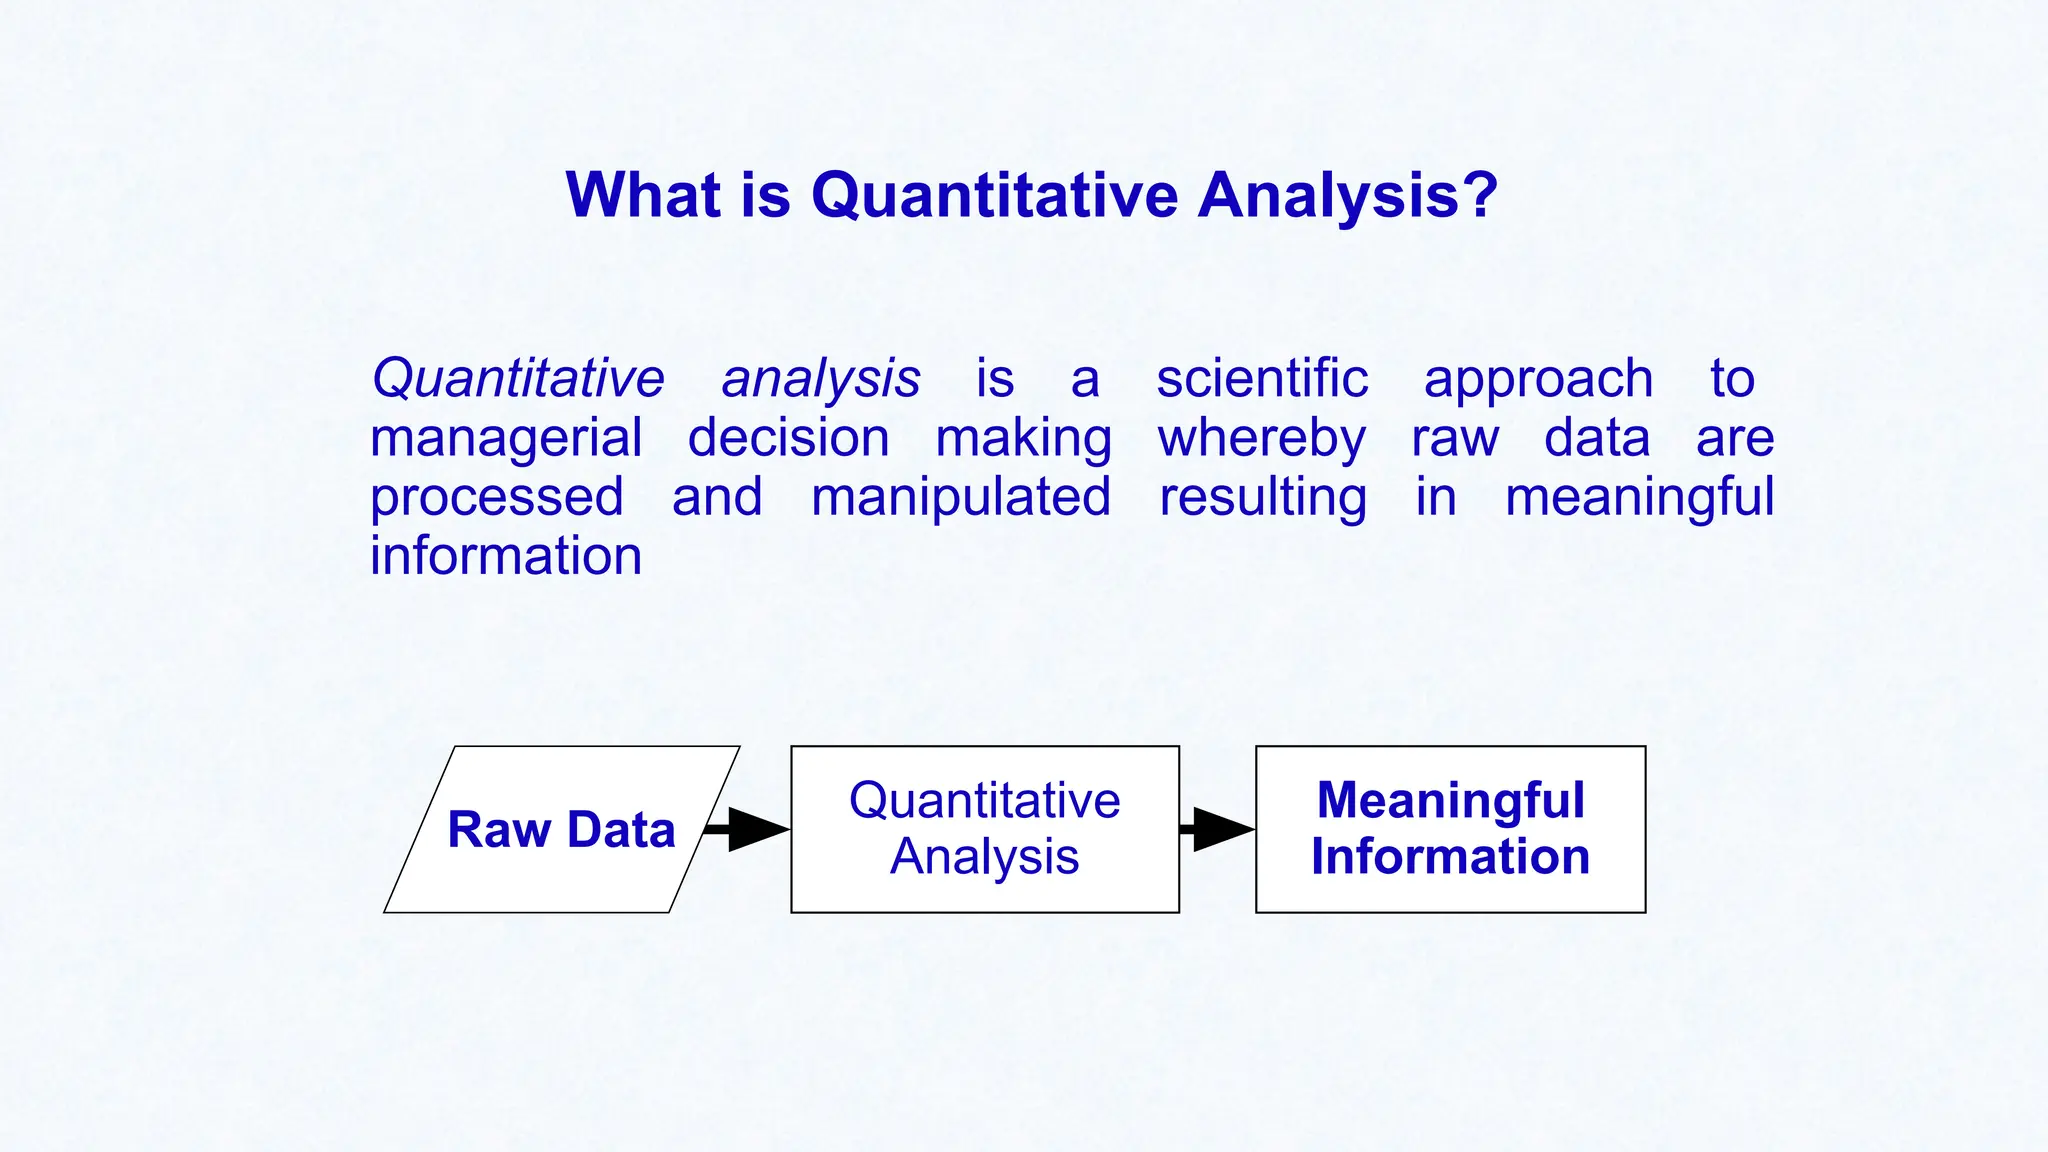
Raw data carry/convey little meaning, when it is considered alone.
The data is minimized, processed/analyzed and then presented
systematically, so that it can be converted into Information.
It is important to note that data, that is not converted into information is of little
value for evaluation and planning and can not be used by those who are
involved in decision making.
Types of Data
Data can divided into two types:
Quantitative data (numerical)
Qualitative data (descriptive, categorical/frequency count)
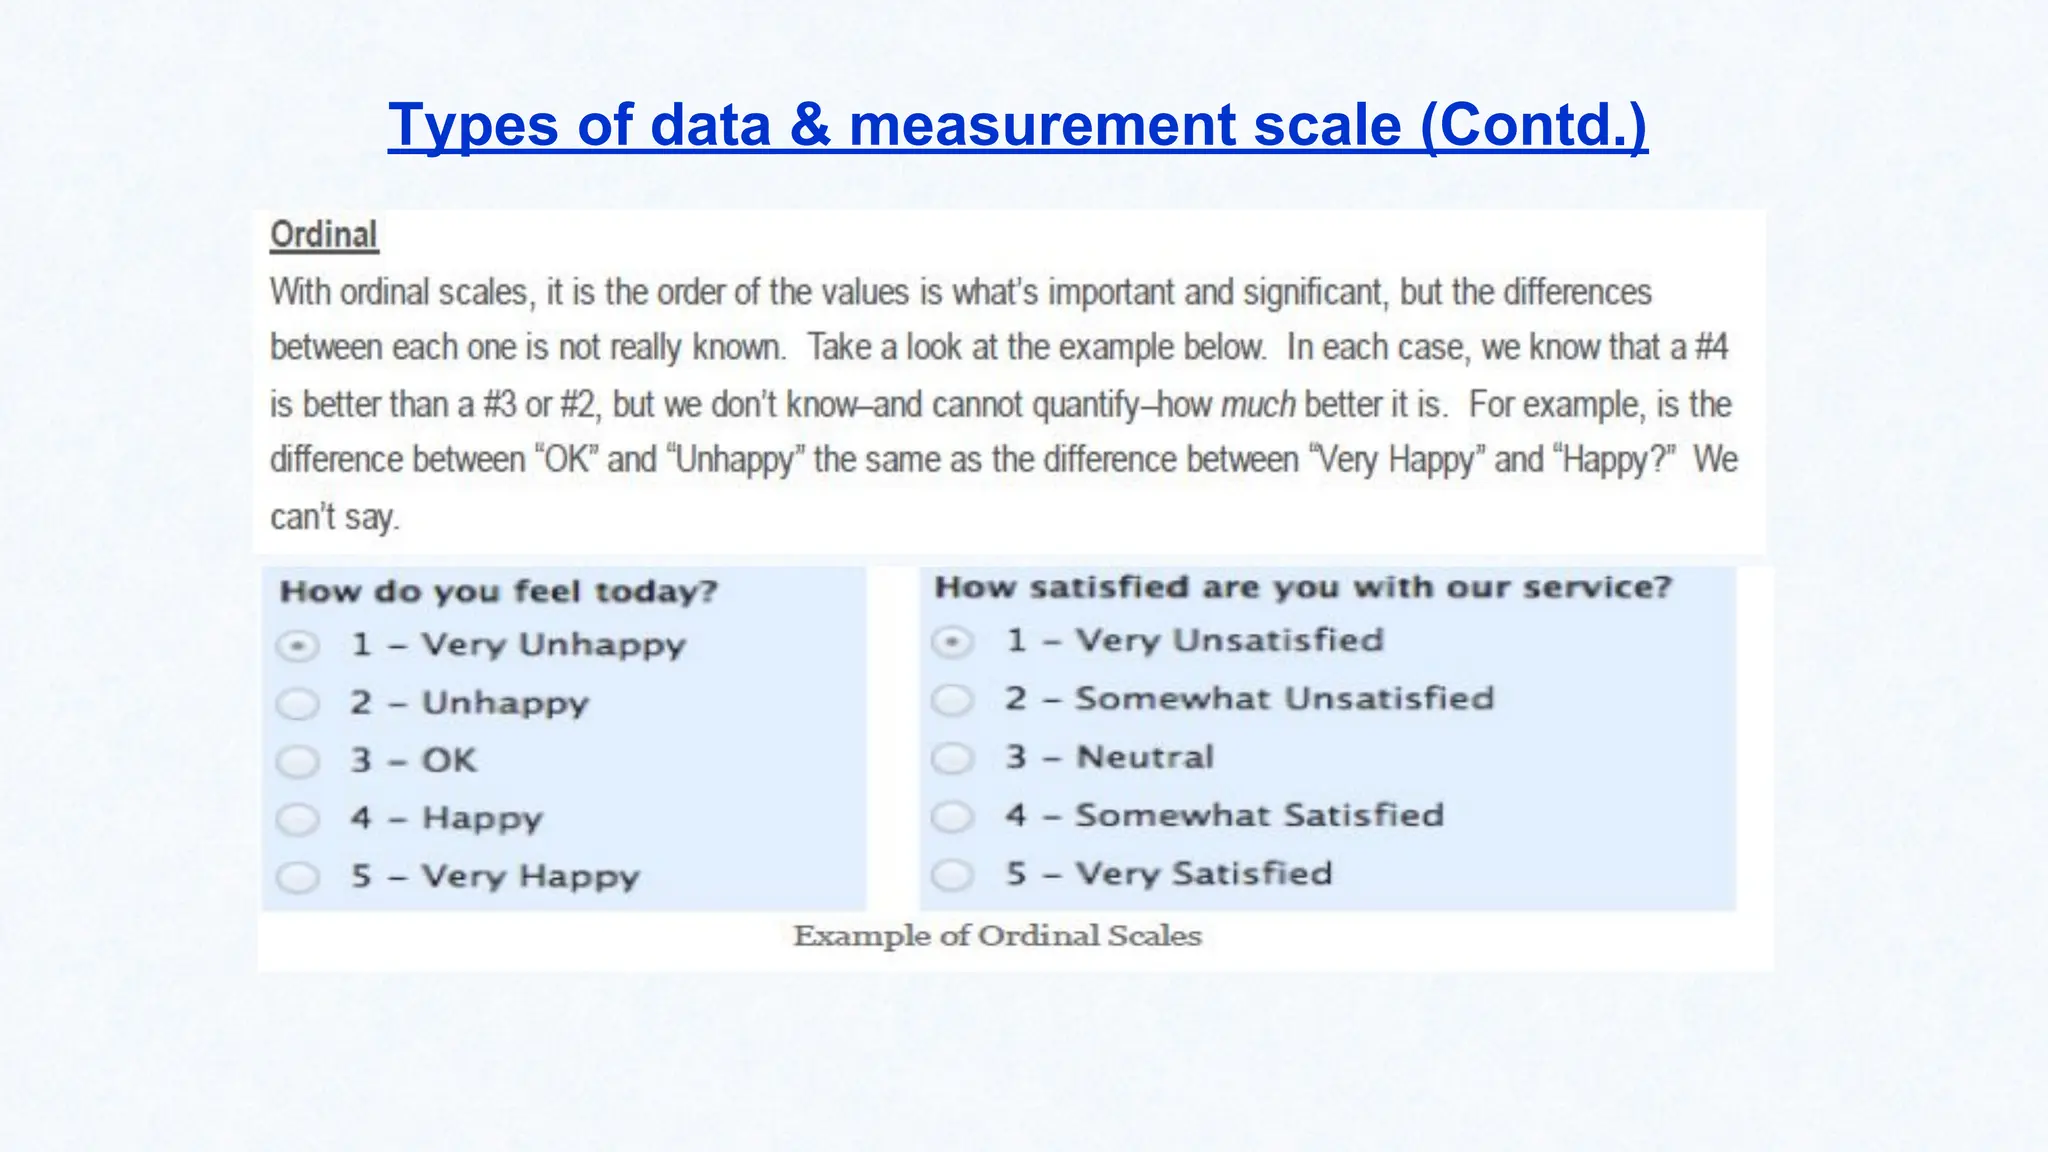
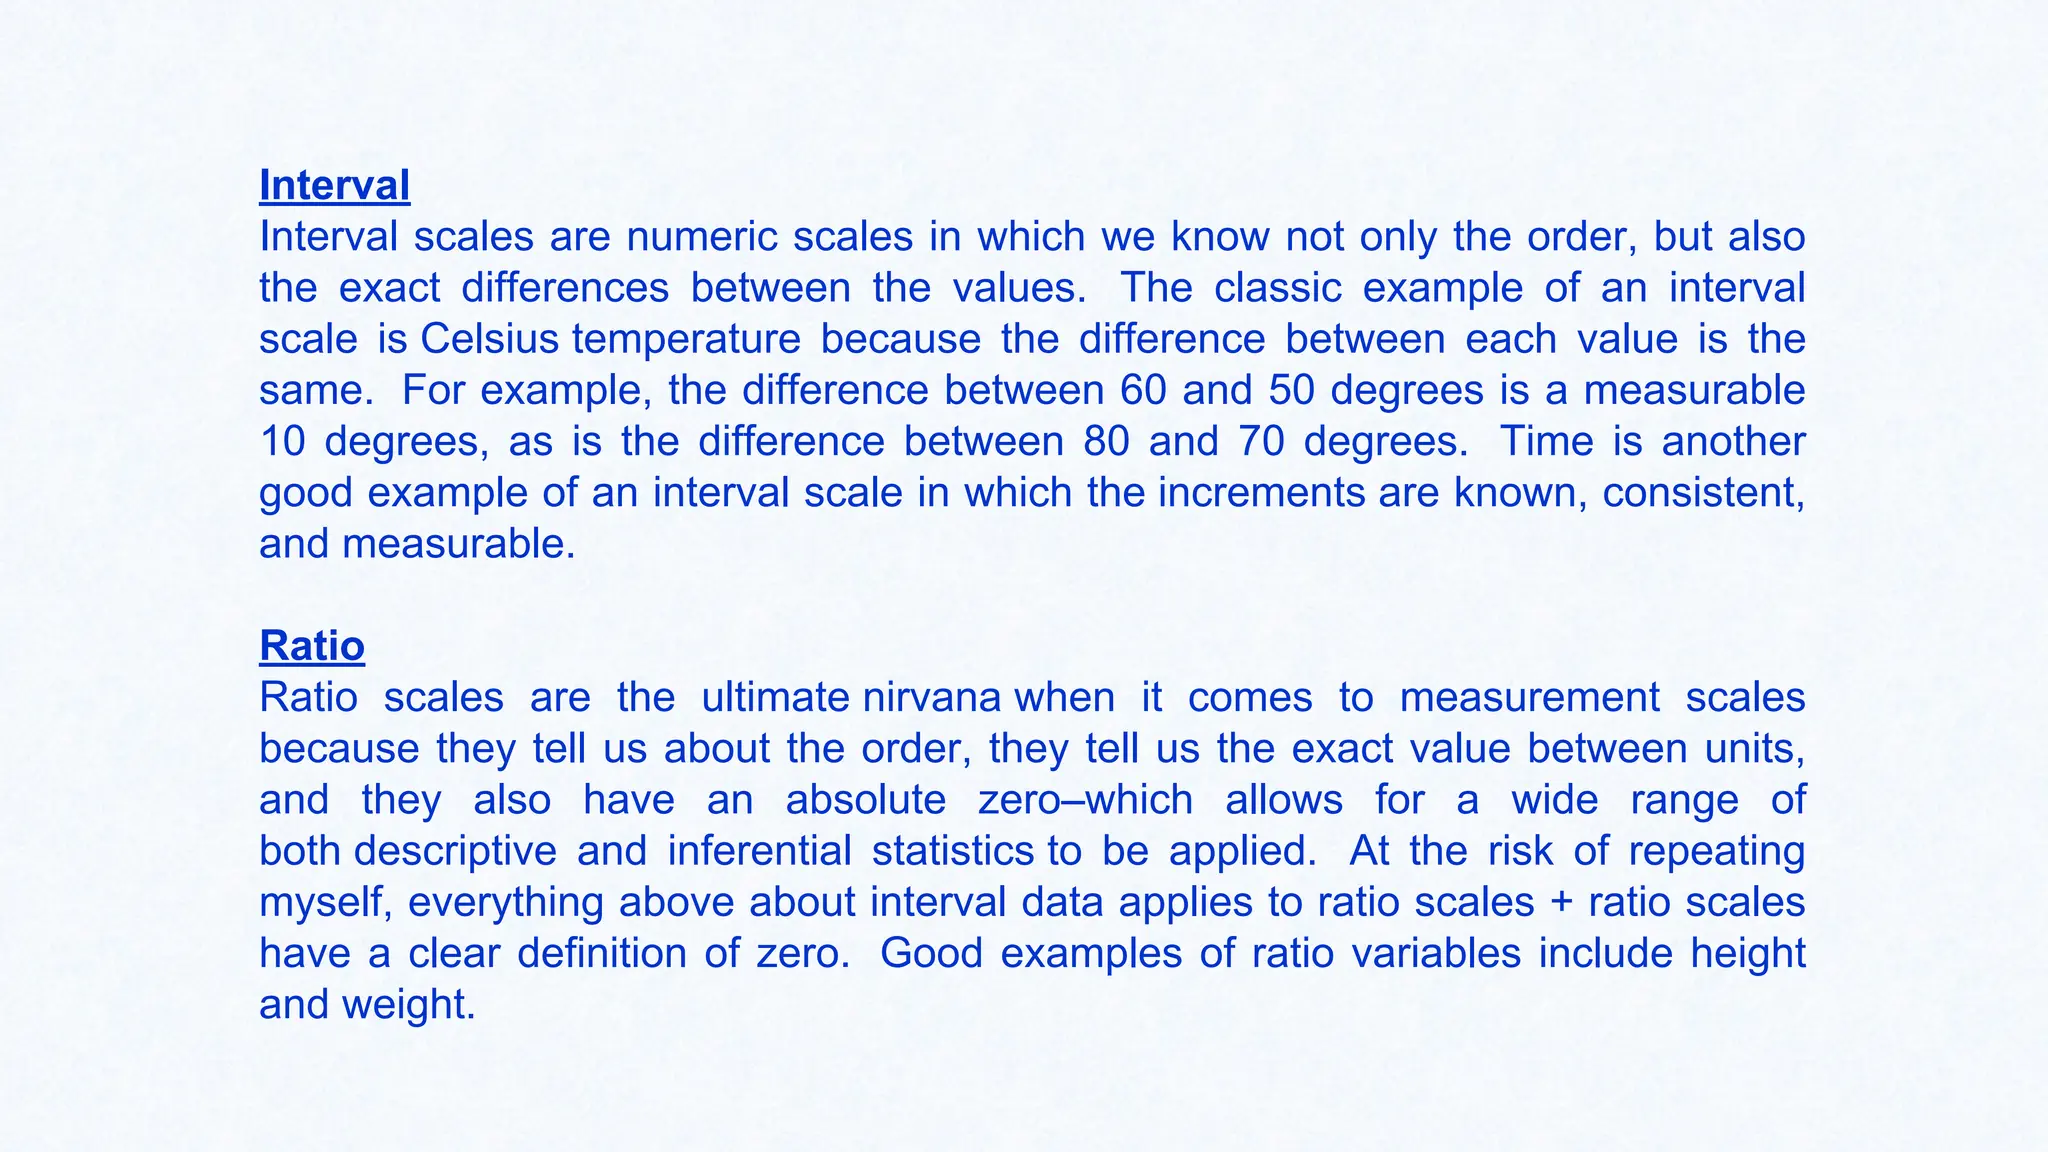
Interval
Interval scales arenumeric scales in which we know not only the order, but also
the exact differences between the values. The classic example of an interval
scale is Celsius temperature because the difference between each value is the
same. For example, the difference between 60 and 50 degrees is a measurable
10 degrees, as is the difference between 80 and 70 degrees. Time is another
good example of an interval scale in which the increments are known, consistent,
and measurable.
Ratio
Ratio scales are the ultimate nirvana when it comes to measurement scales
because they tell us about the order, they tell us the exact value between units,
and they also have an absolute zero–which allows for a wide range of
both descriptive and inferential statistics to be applied. At the risk of repeating
myself, everything above about interval data applies to ratio scales + ratio scales
have a clear definition of zero. Good examples of ratio variables include height
and weight.
8.
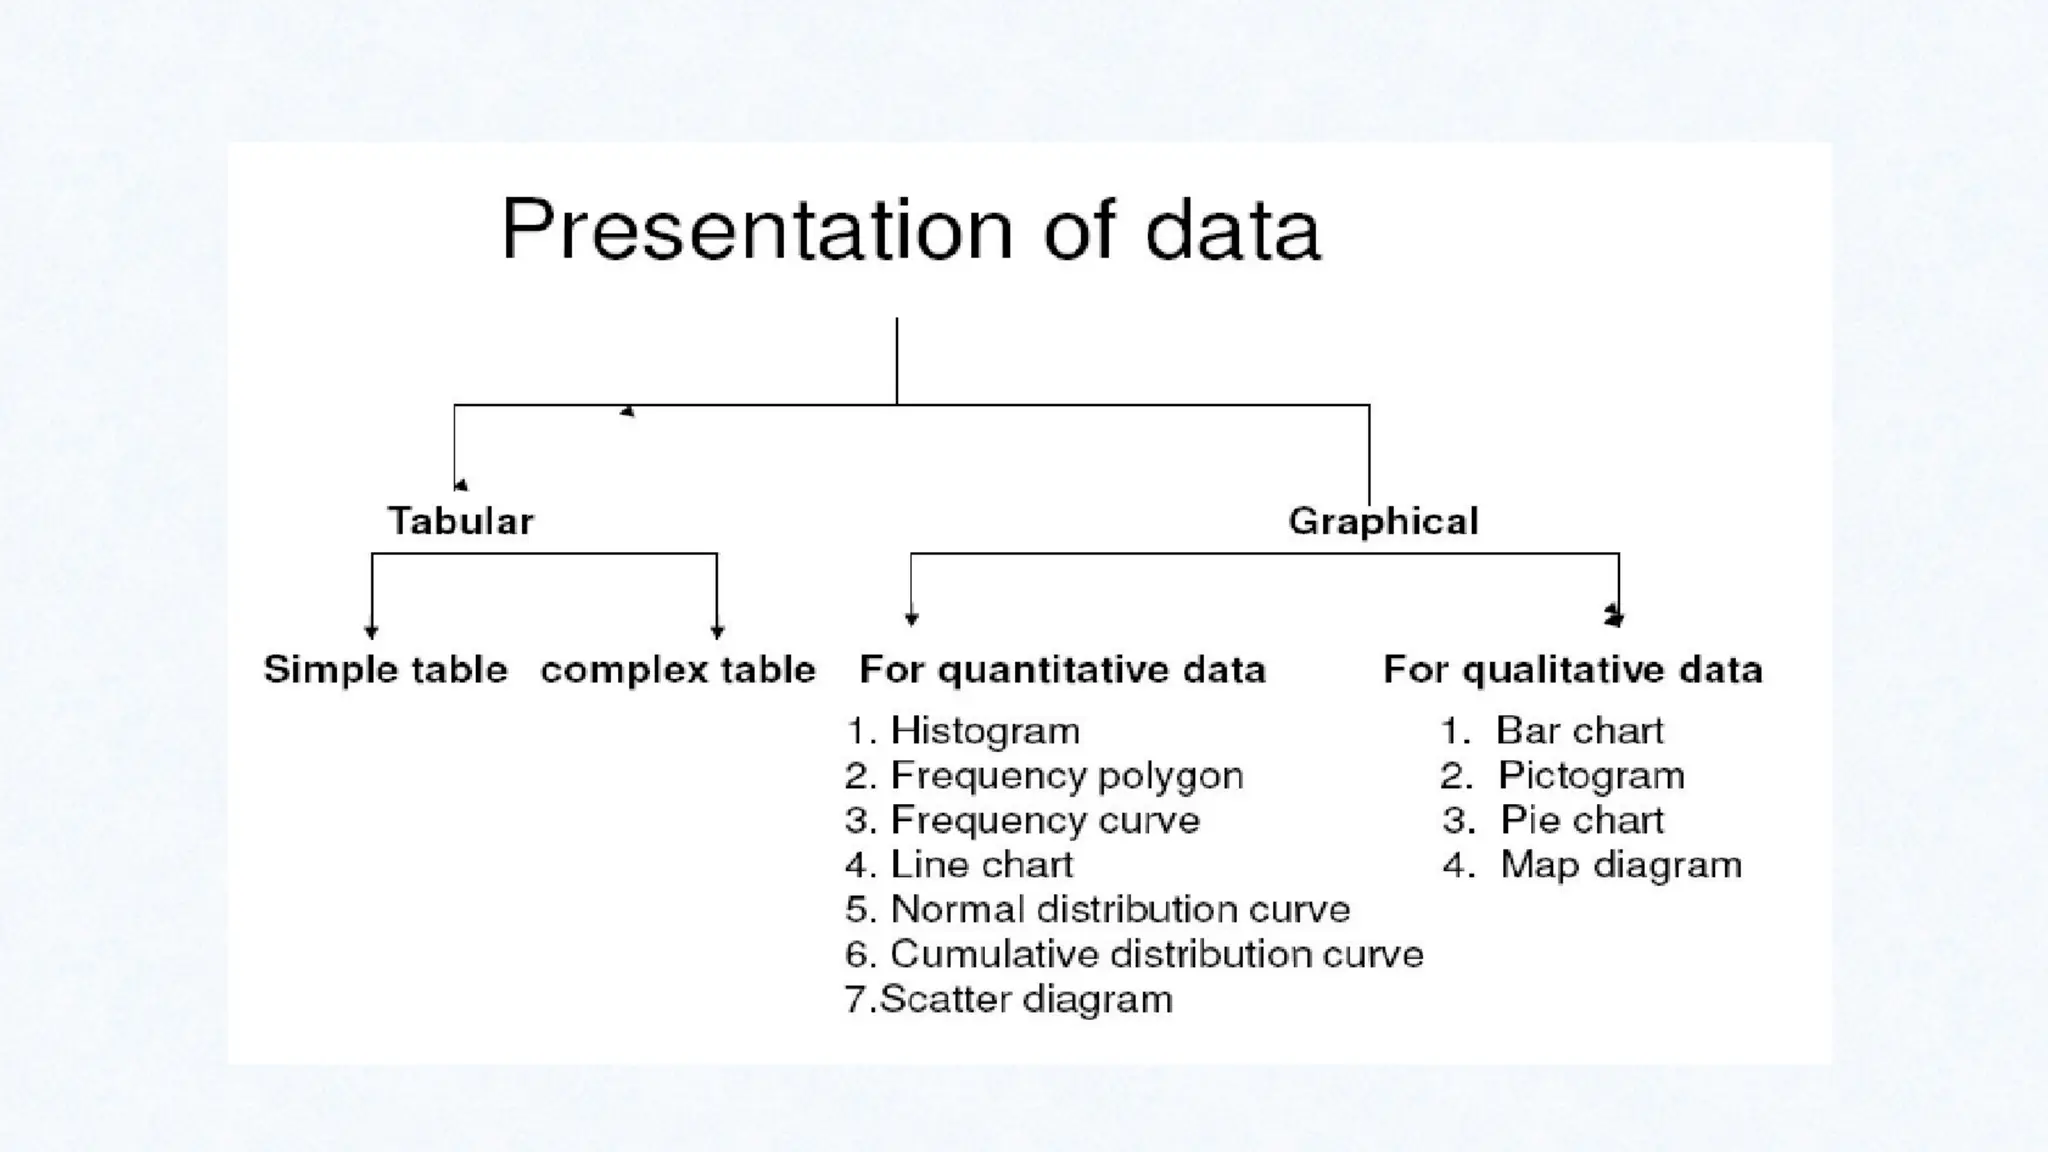
Data Presentation: Why?
Principlesof data presentation:
a. To arrange the data in such a way that it should create interest in the
reader’s mind at the first sight.
b. To present the information in a compact and concise form without losing
important details.
c. To present the data in a simple form so as to draw the conclusion directly
by viewing at the data.
d. To present it in such away that it can help in further statistical analysis.
10.
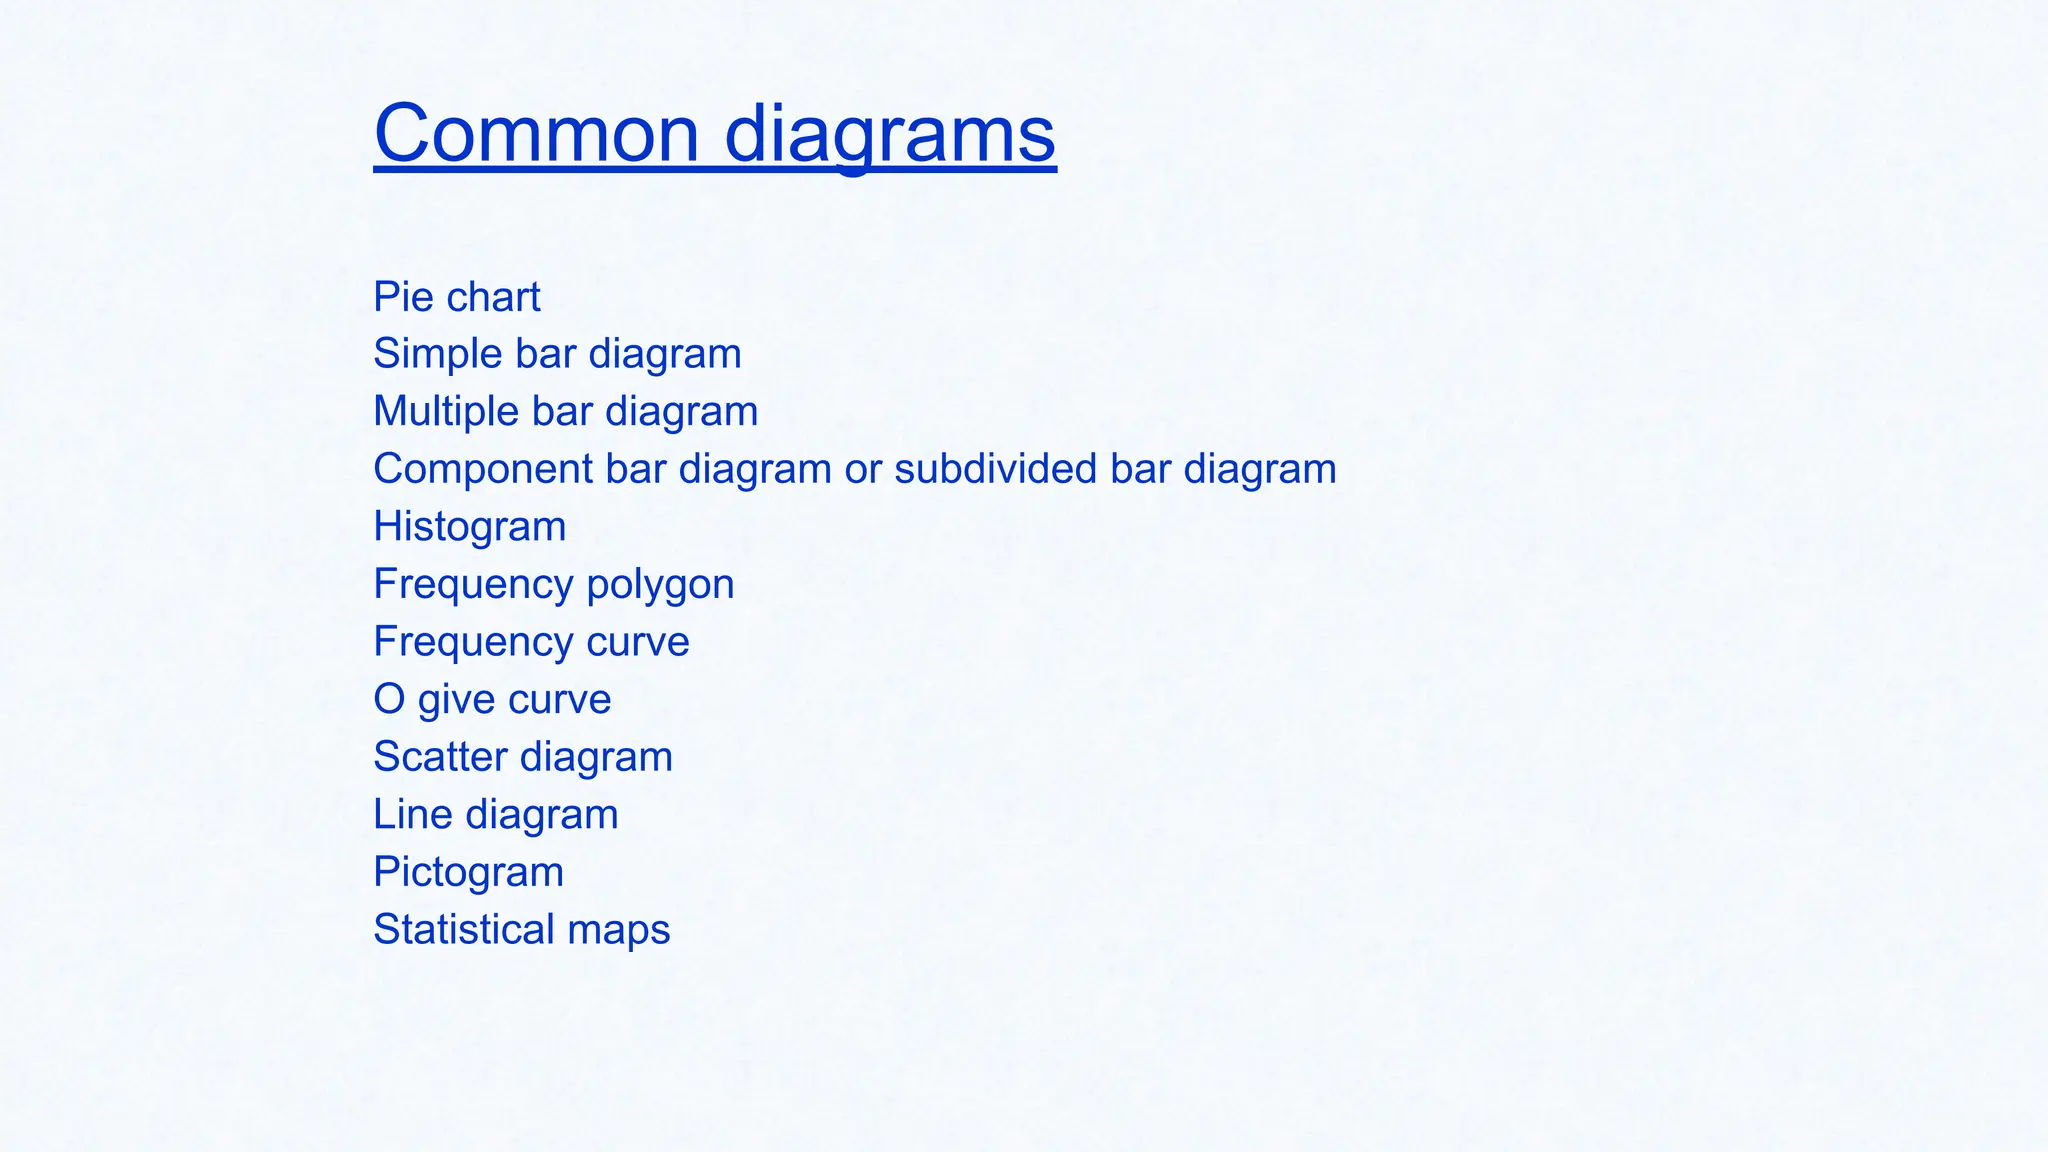
Common diagrams
Pie chart
Simplebar diagram
Multiple bar diagram
Component bar diagram or subdivided bar diagram
Histogram
Frequency polygon
Frequency curve
O give curve
Scatter diagram
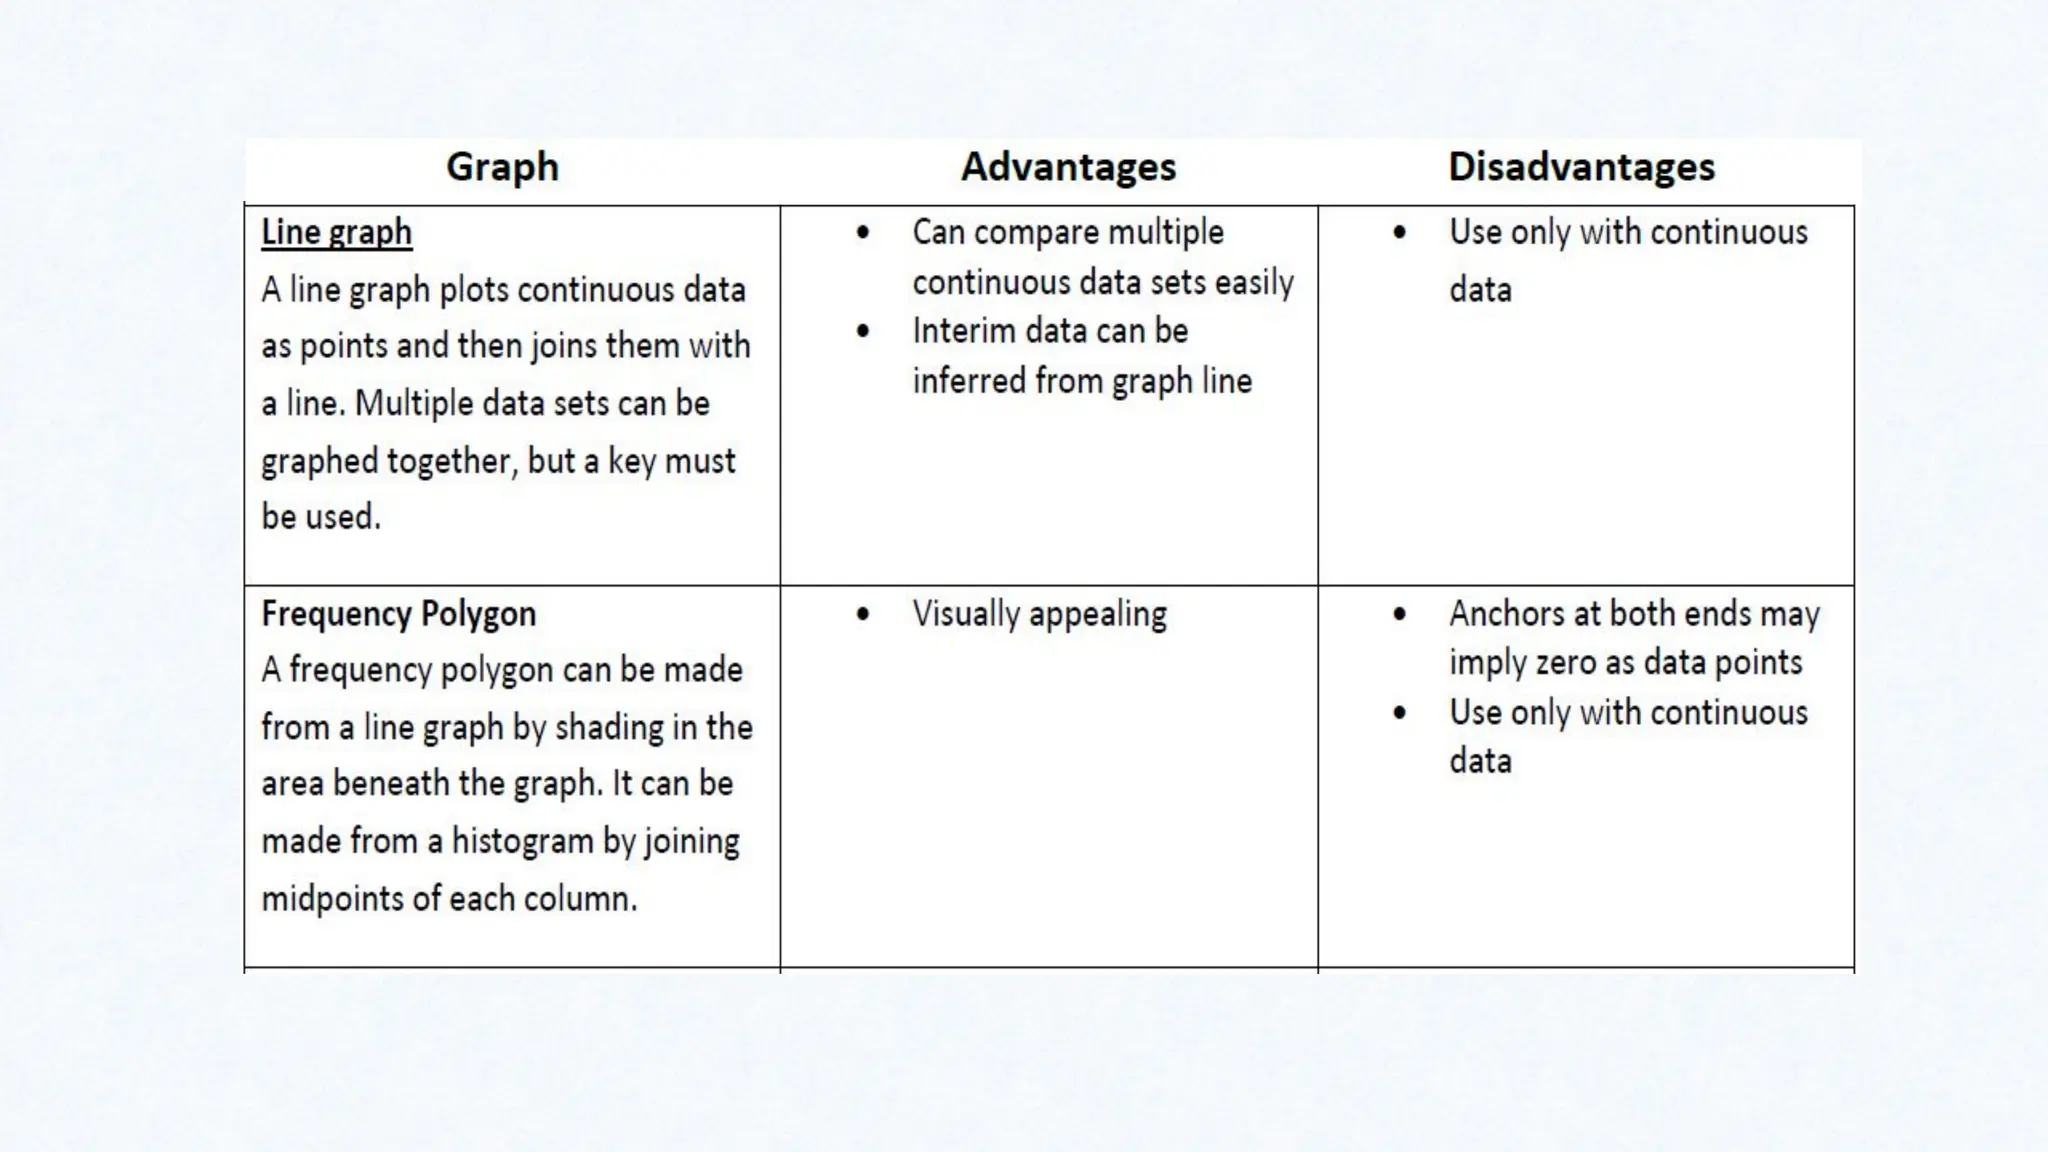
Line diagram
Pictogram
Statistical maps
11.
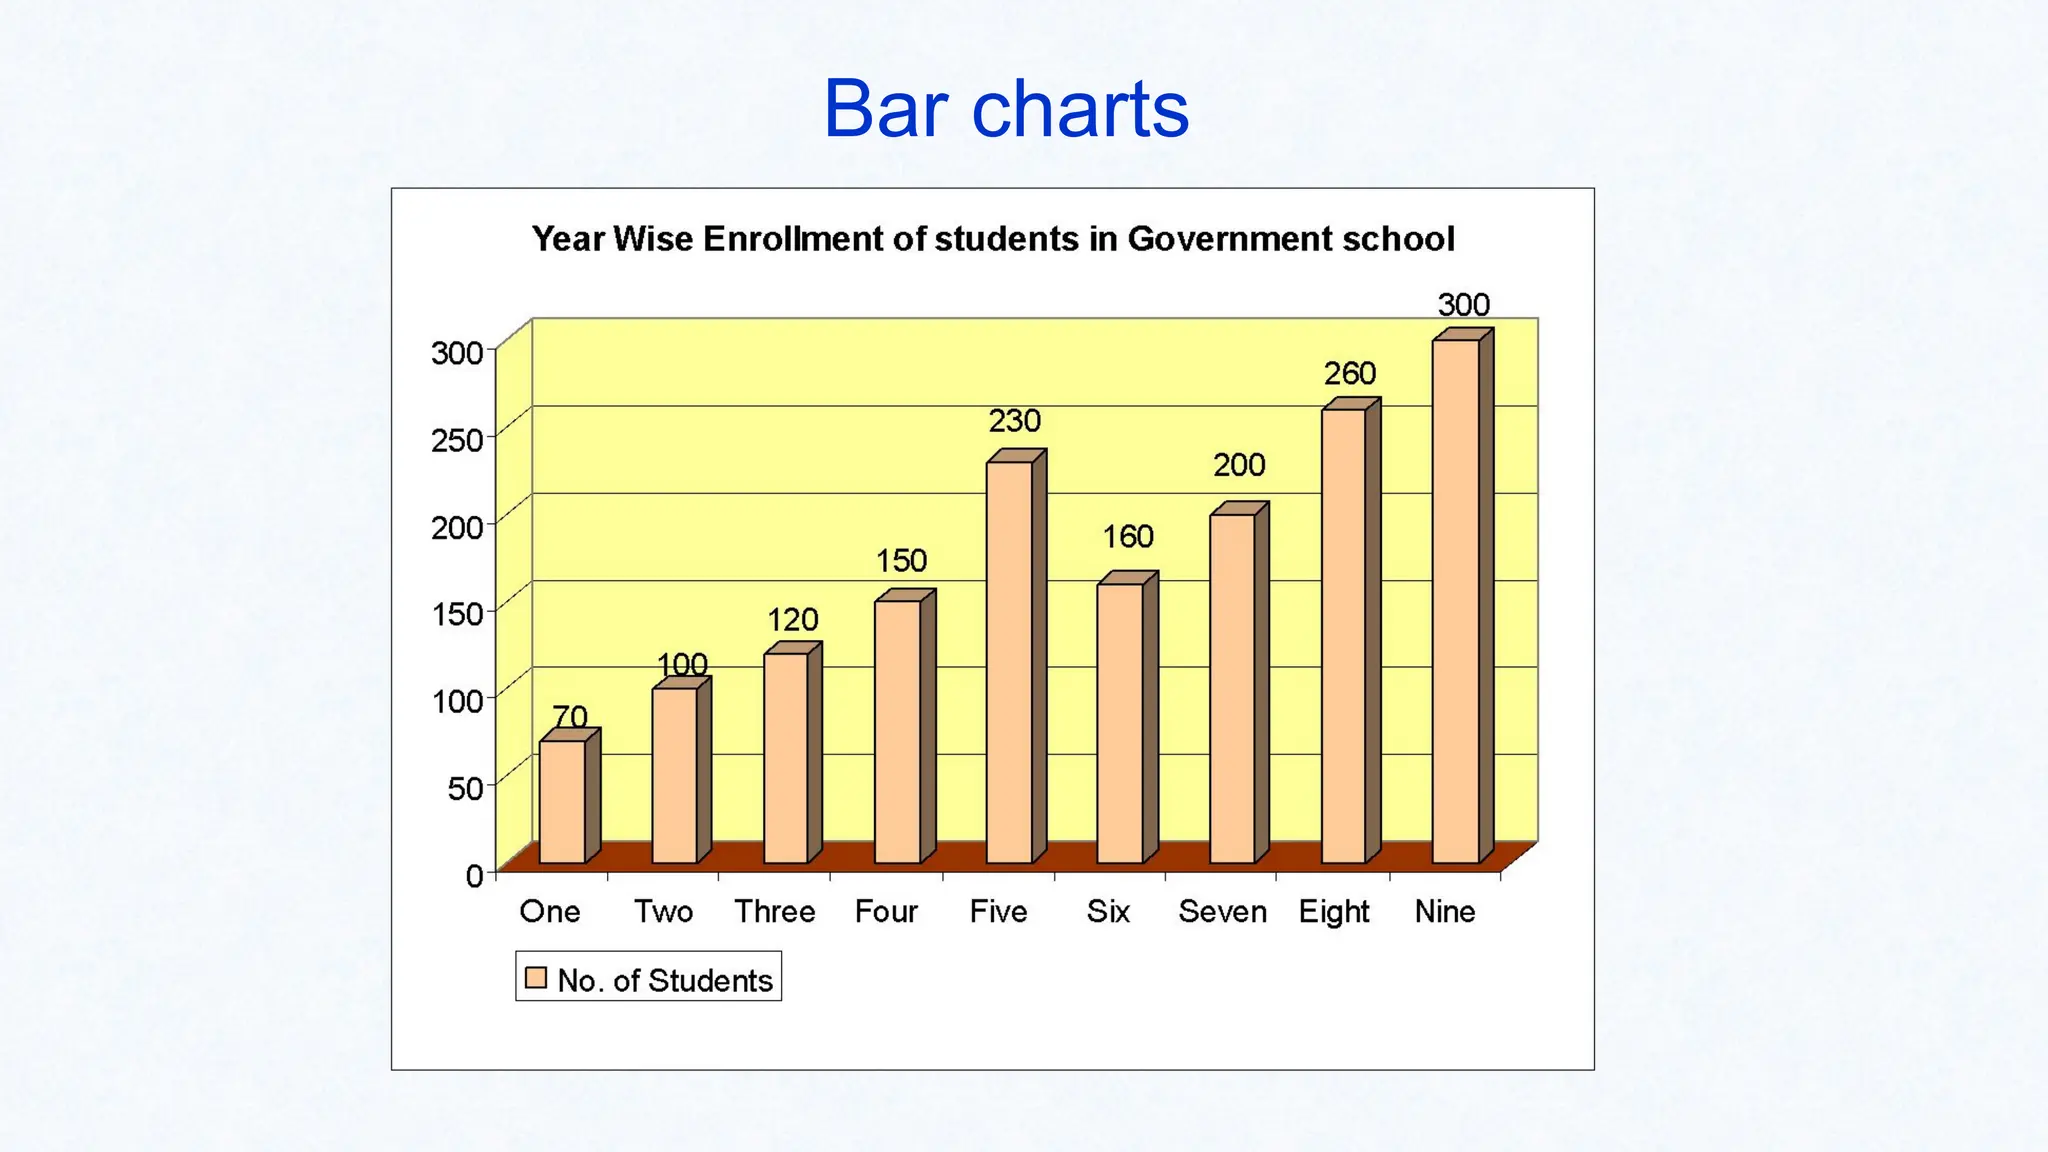
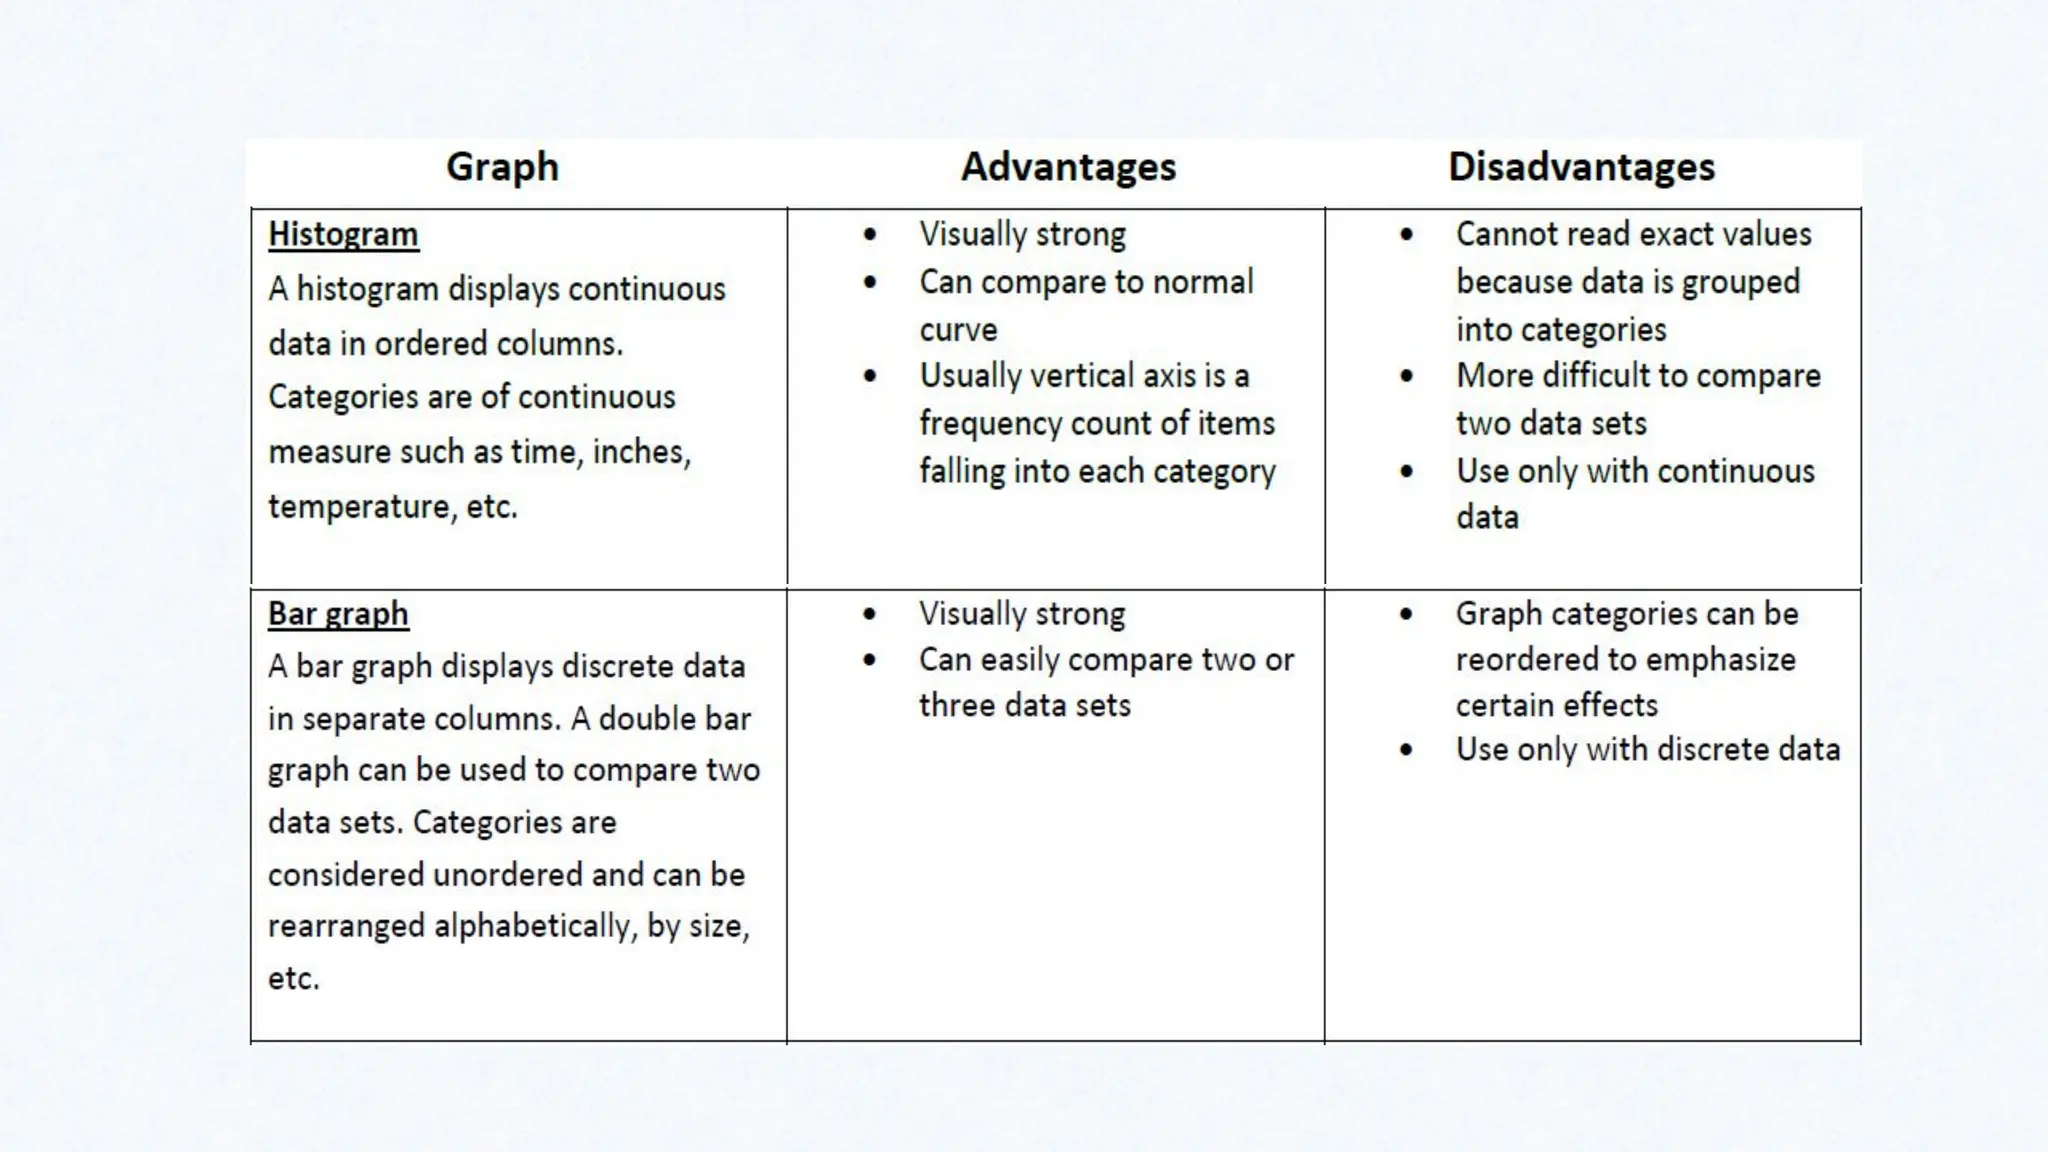
Bar charts
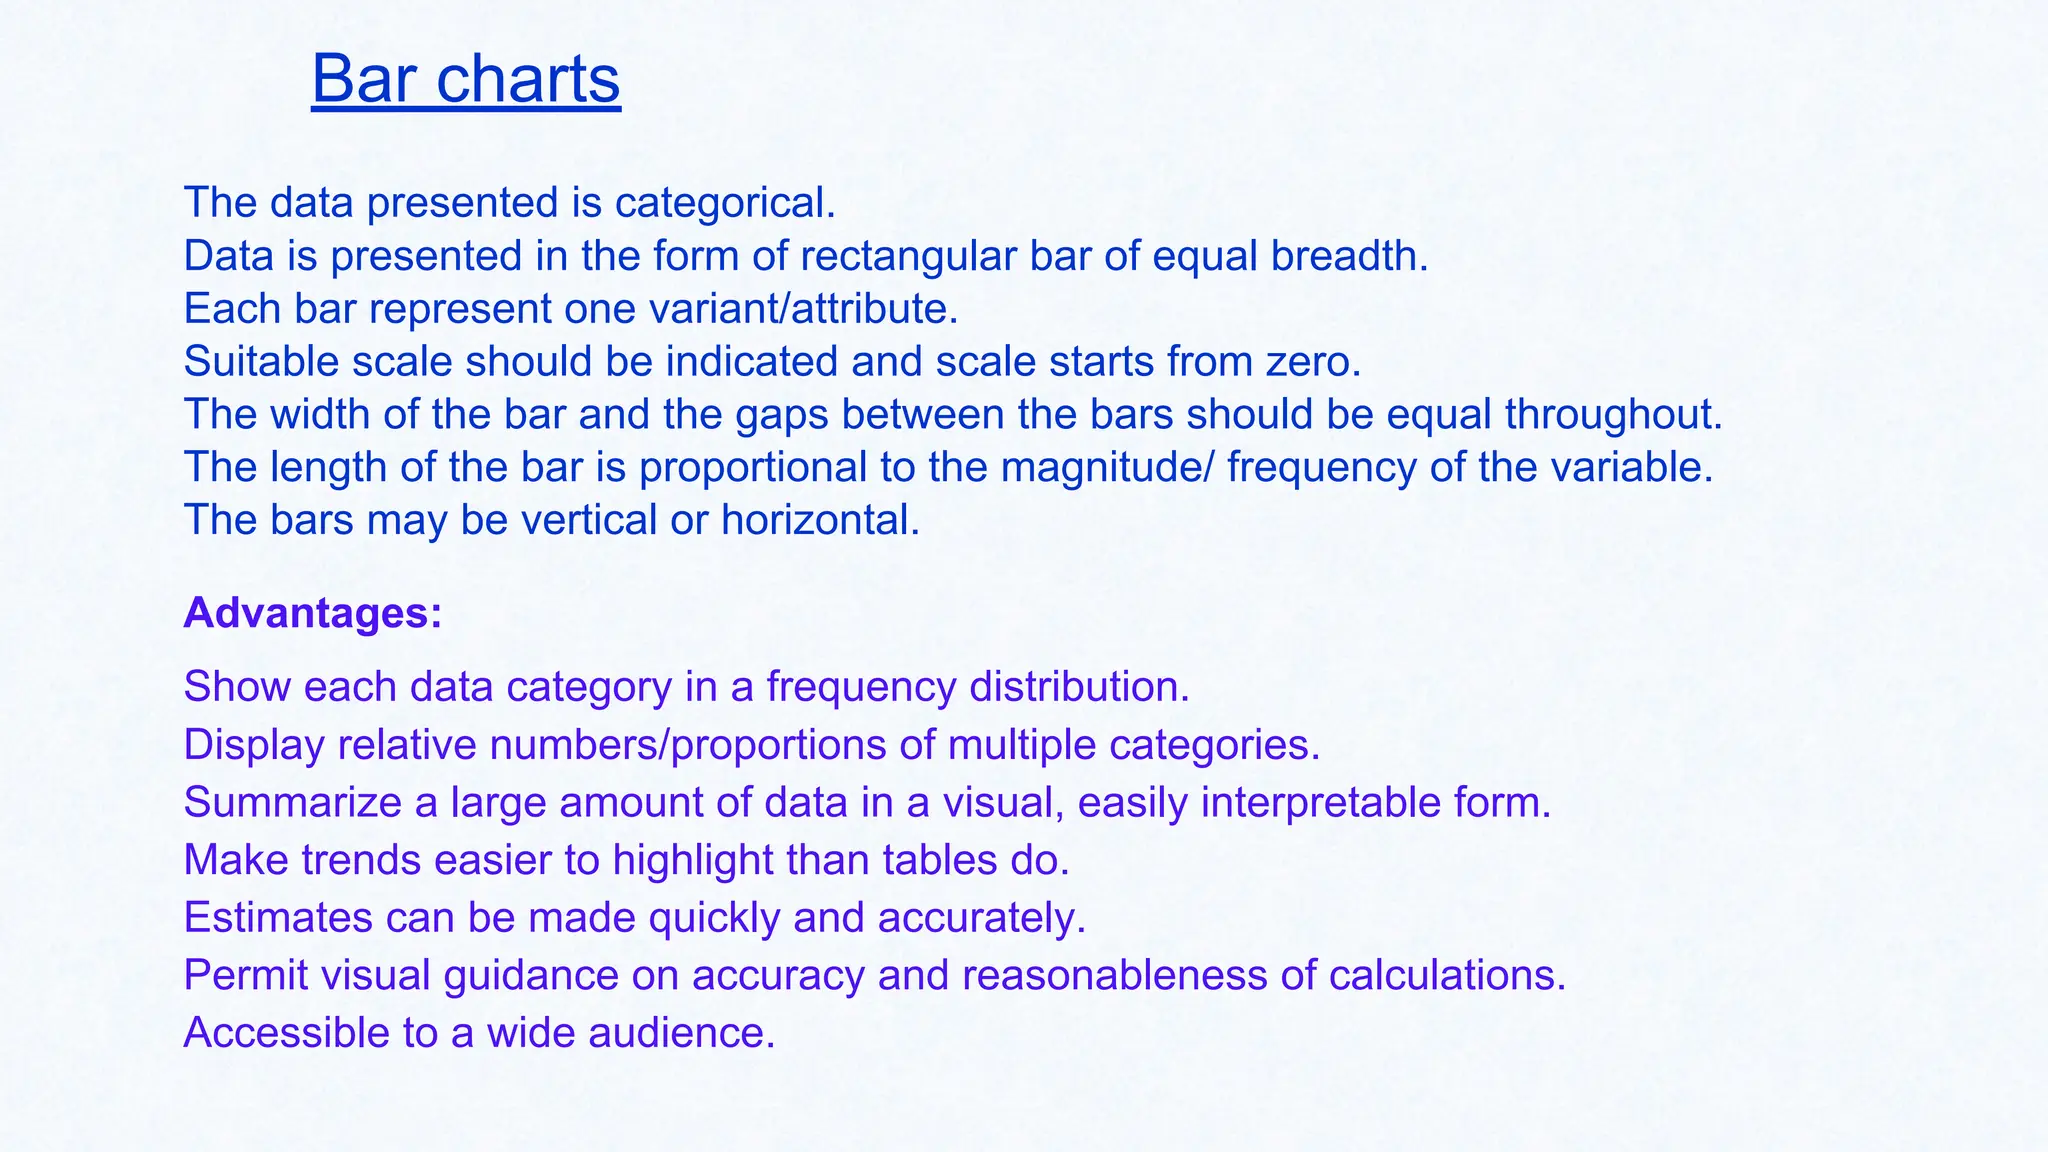
The datapresented is categorical.
Data is presented in the form of rectangular bar of equal breadth.
Each bar represent one variant/attribute.
Suitable scale should be indicated and scale starts from zero.
The width of the bar and the gaps between the bars should be equal throughout.
The length of the bar is proportional to the magnitude/ frequency of the variable.
The bars may be vertical or horizontal.
Advantages:
Show each data category in a frequency distribution.
Display relative numbers/proportions of multiple categories.
Summarize a large amount of data in a visual, easily interpretable form.
Make trends easier to highlight than tables do.
Estimates can be made quickly and accurately.
Permit visual guidance on accuracy and reasonableness of calculations.
Accessible to a wide audience.
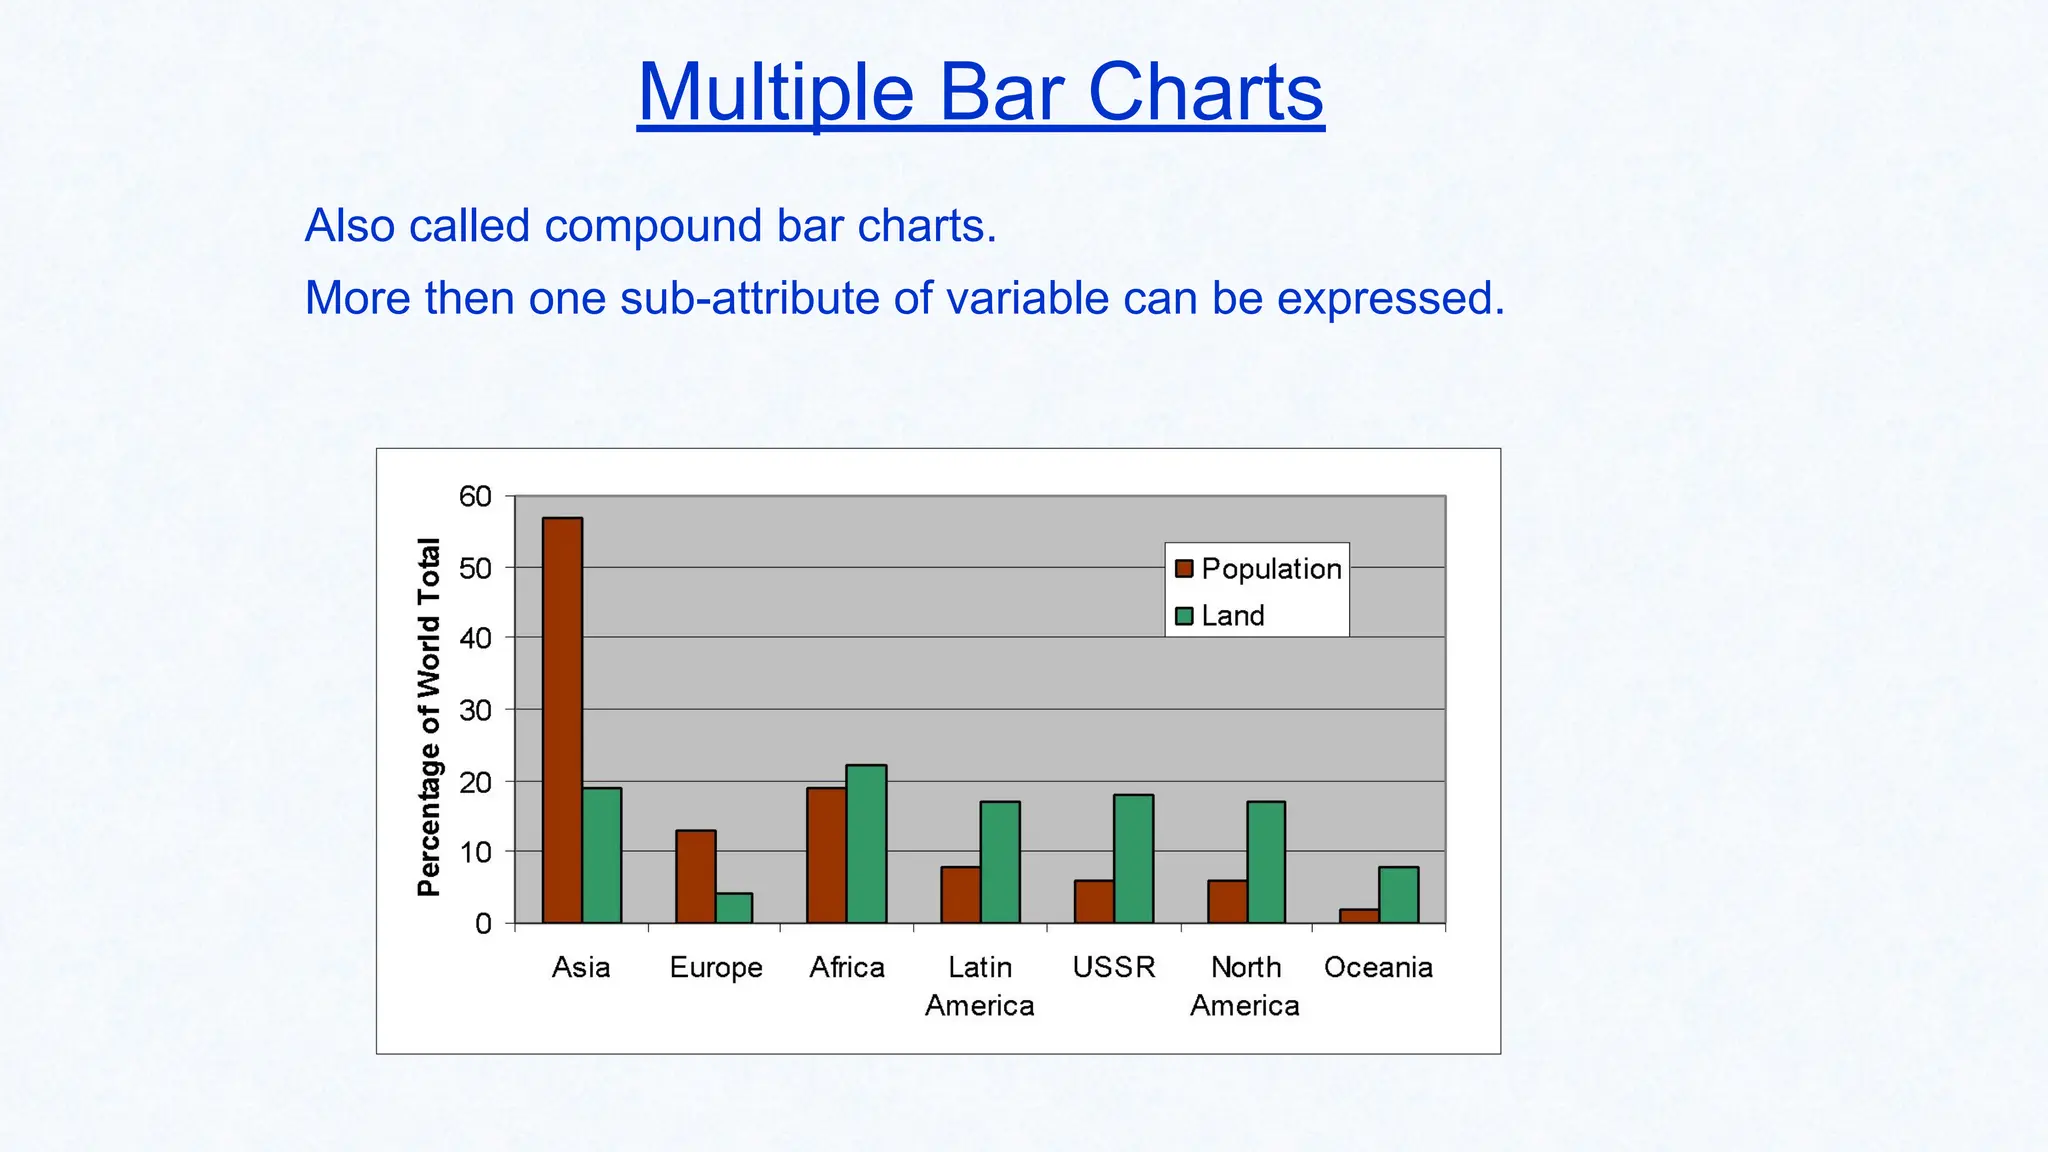
Multiple Bar Charts
Alsocalled compound bar charts.
More then one sub-attribute of variable can be expressed.
14.
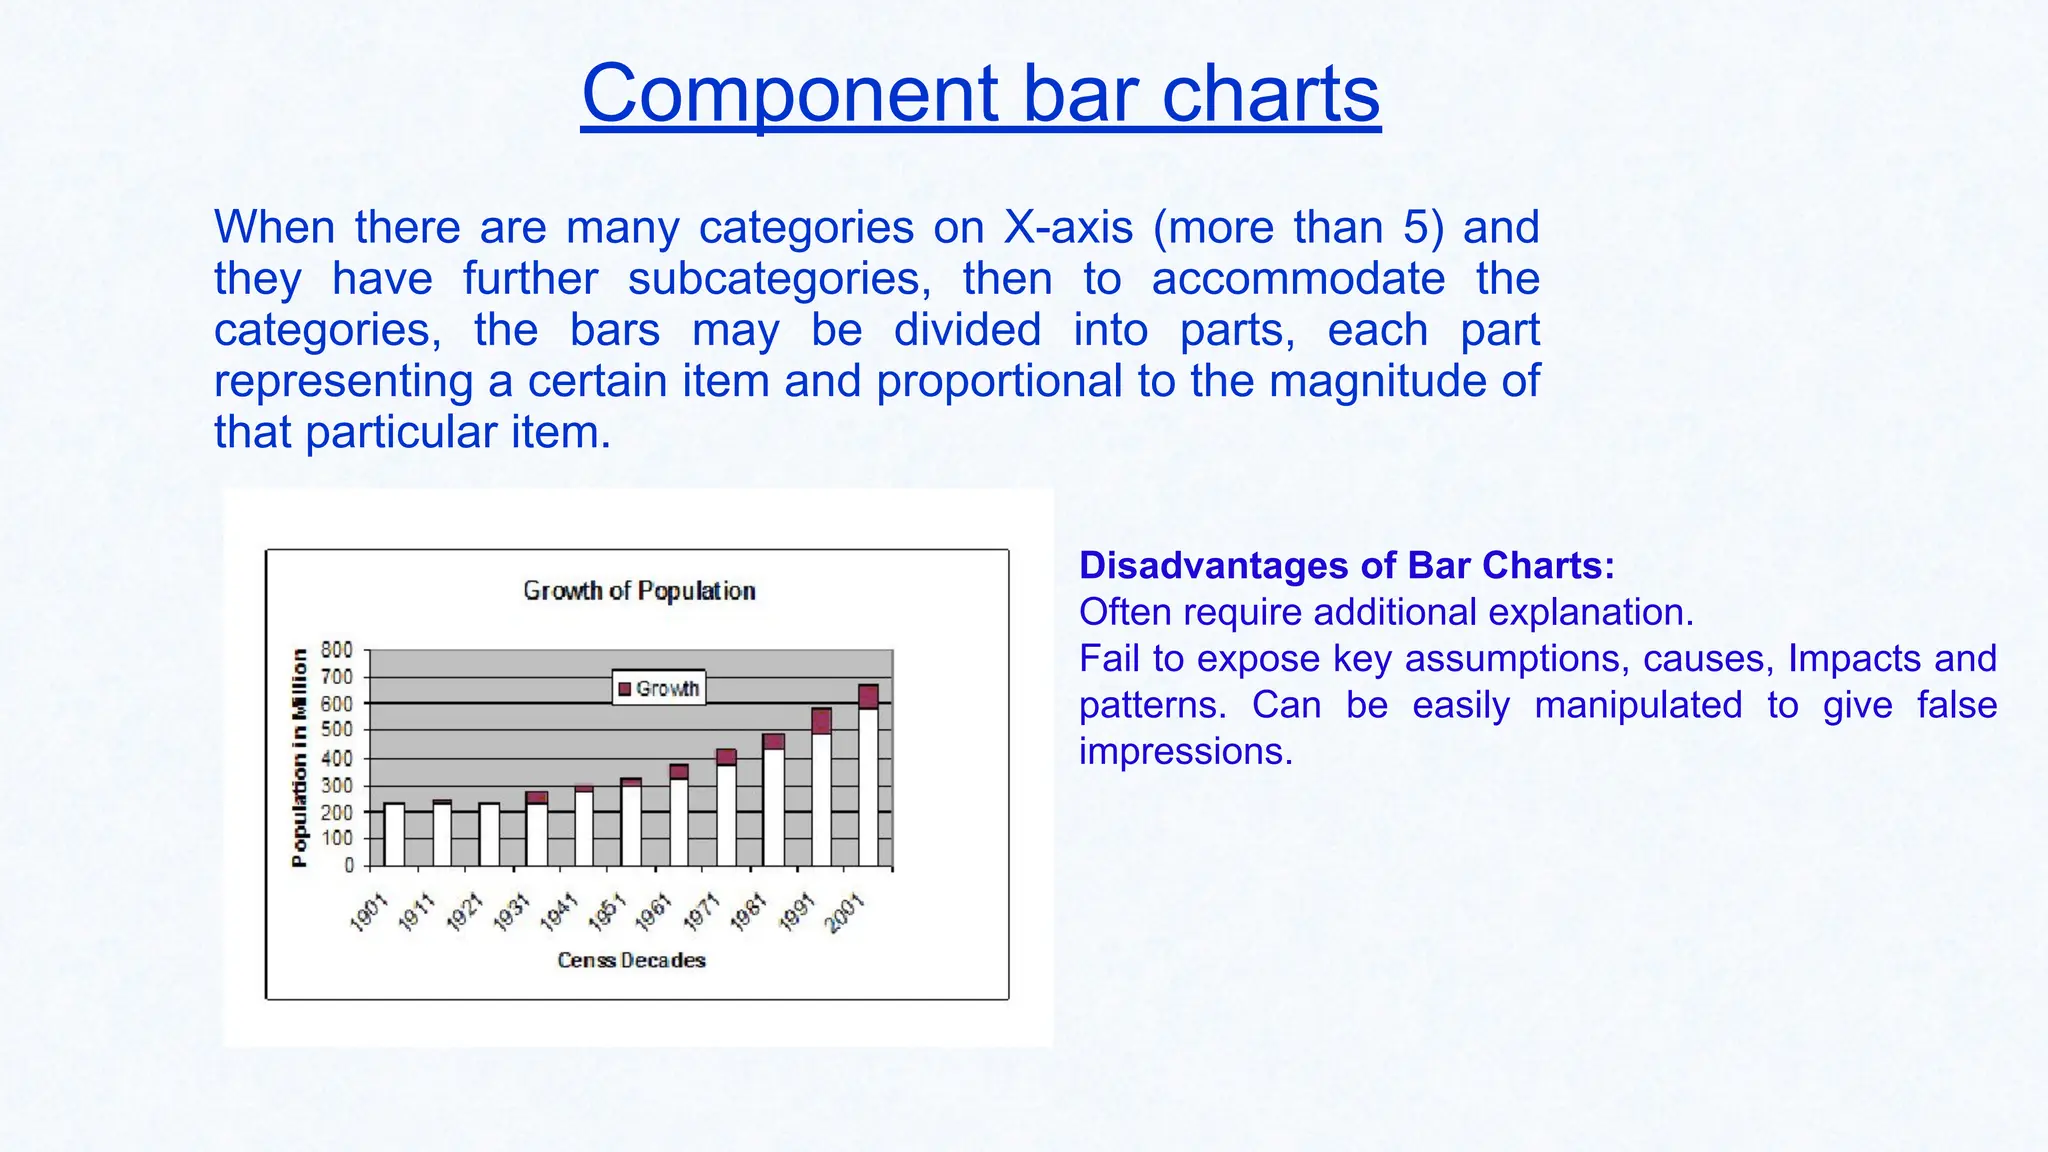
Component bar charts
Whenthere are many categories on X-axis (more than 5) and
they have further subcategories, then to accommodate the
categories, the bars may be divided into parts, each part
representing a certain item and proportional to the magnitude of
that particular item.
Disadvantages of Bar Charts:
Often require additional explanation.
Fail to expose key assumptions, causes, Impacts and
patterns. Can be easily manipulated to give false
impressions.
15.
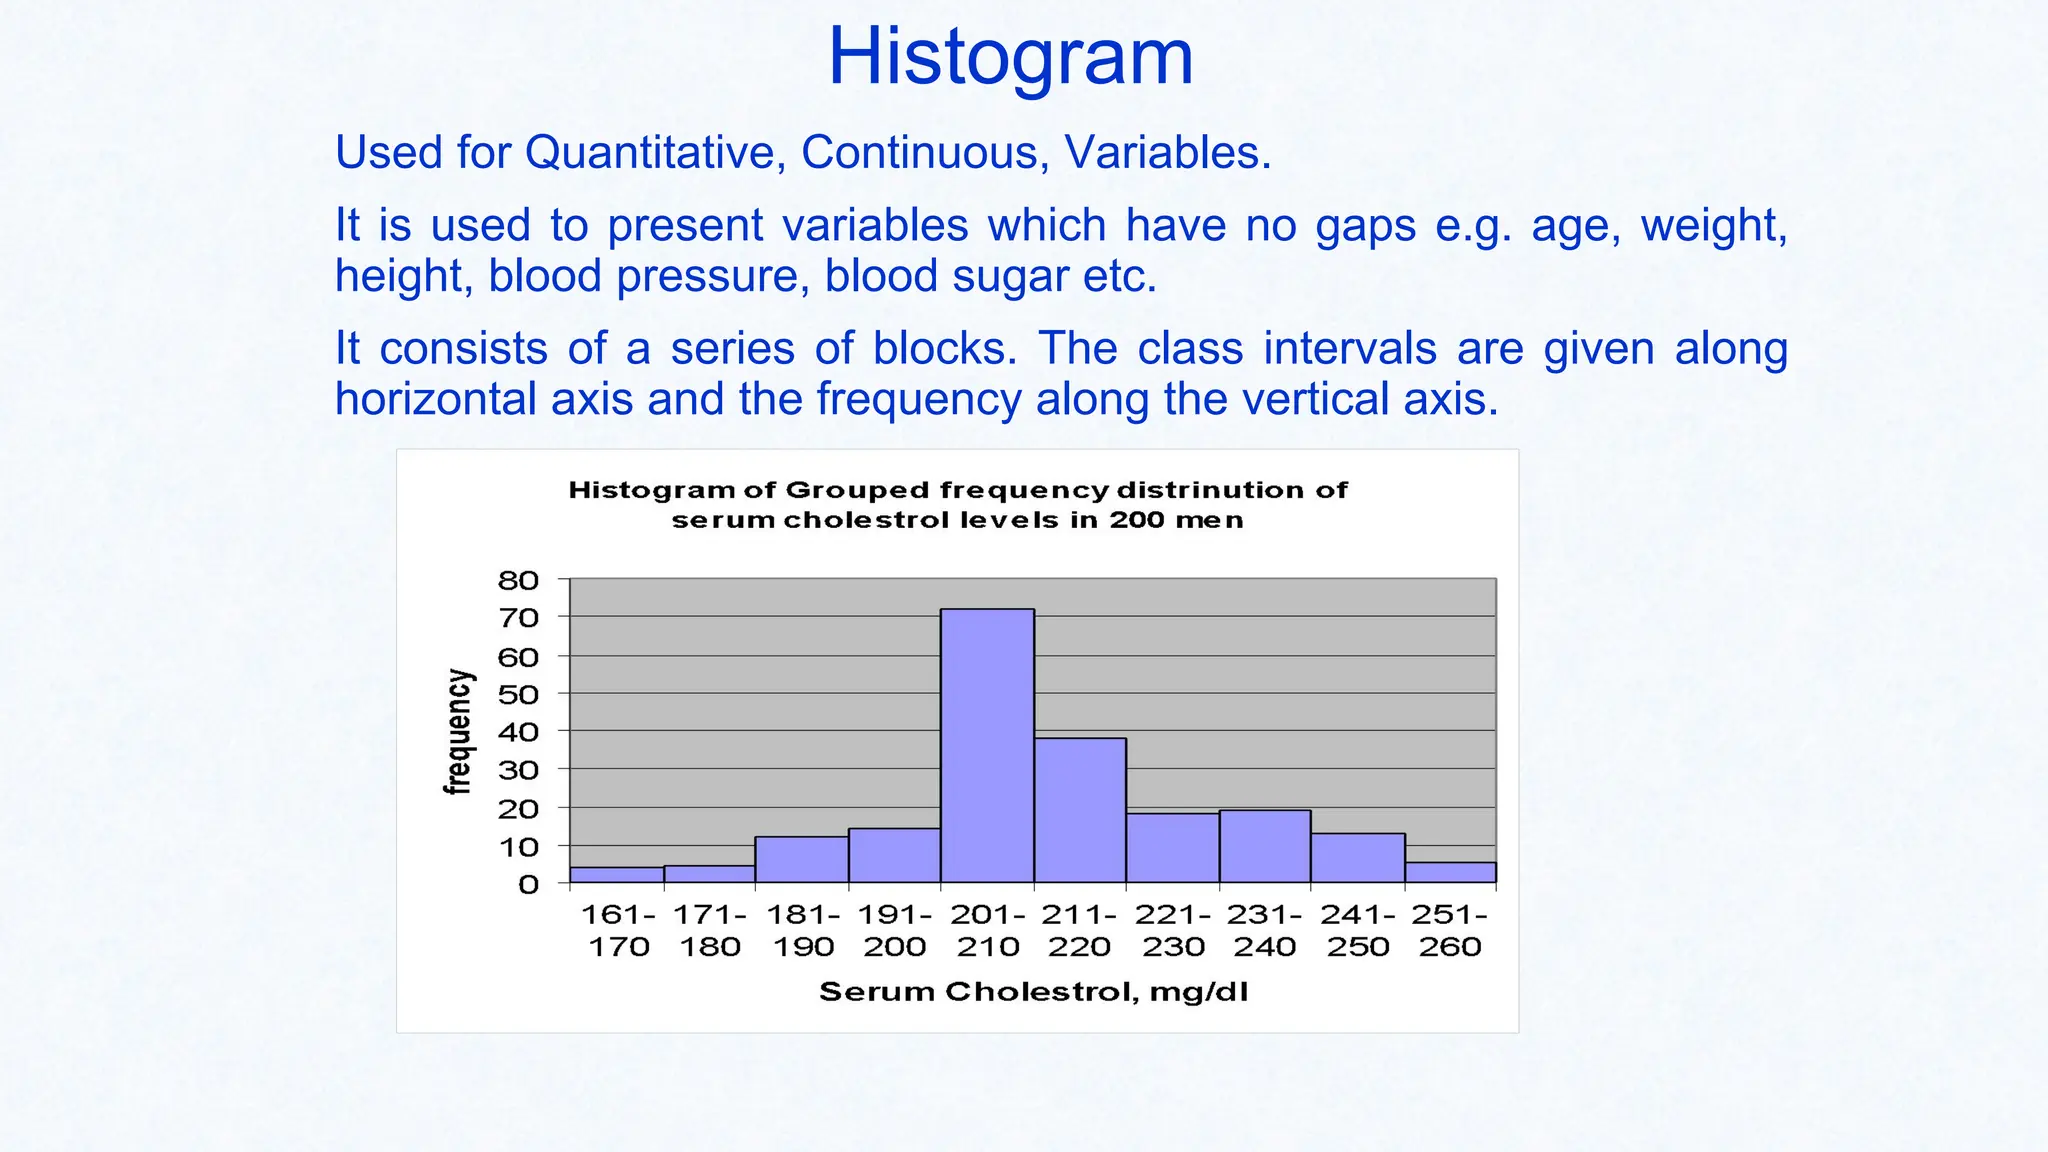
Histogram
Used for Quantitative,Continuous, Variables.
It is used to present variables which have no gaps e.g. age, weight,
height, blood pressure, blood sugar etc.
It consists of a series of blocks. The class intervals are given along
horizontal axis and the frequency along the vertical axis.
16.
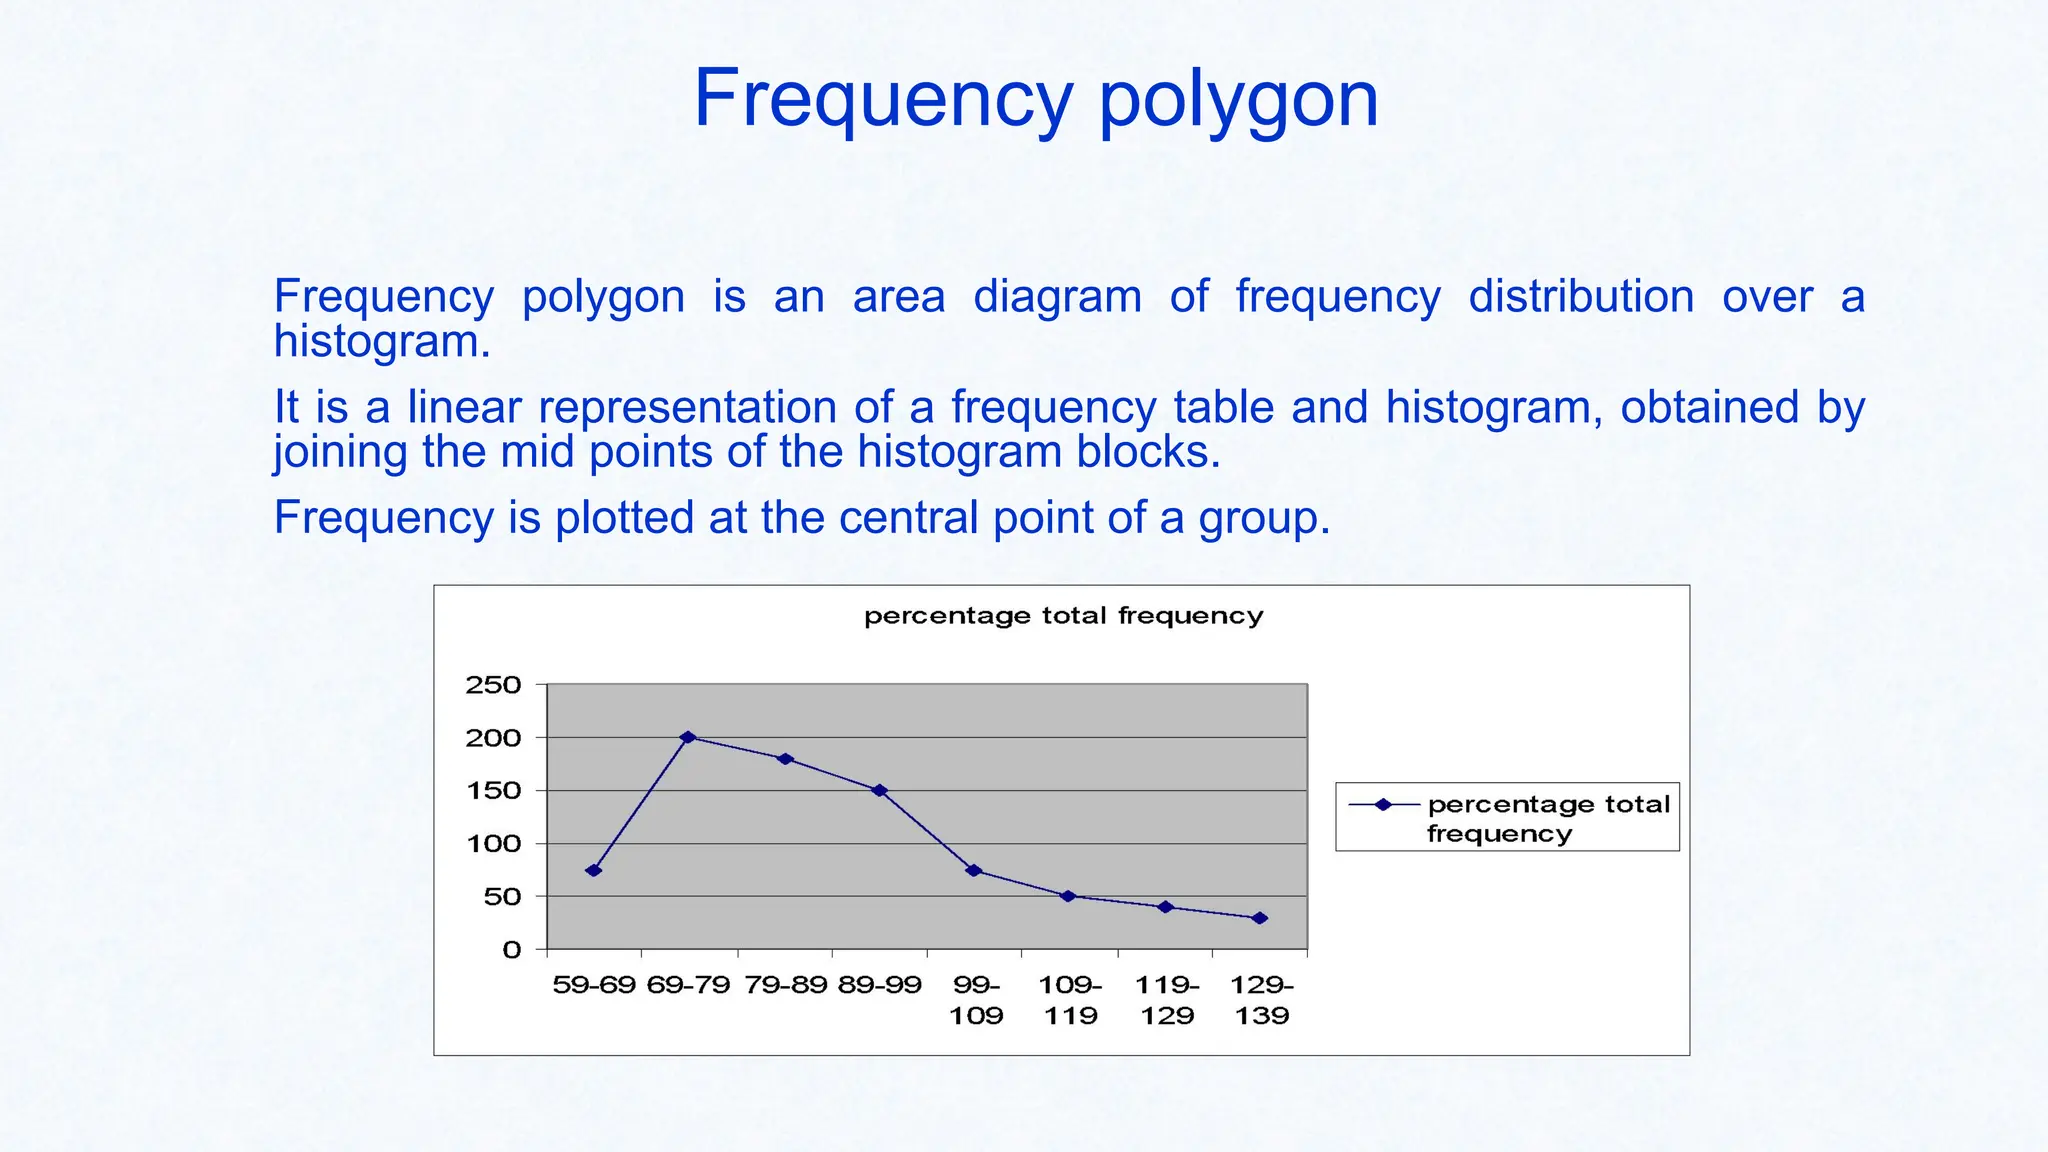
Frequency polygon
Frequency polygonis an area diagram of frequency distribution over a
histogram.
It is a linear representation of a frequency table and histogram, obtained by
joining the mid points of the histogram blocks.
Frequency is plotted at the central point of a group.
17.
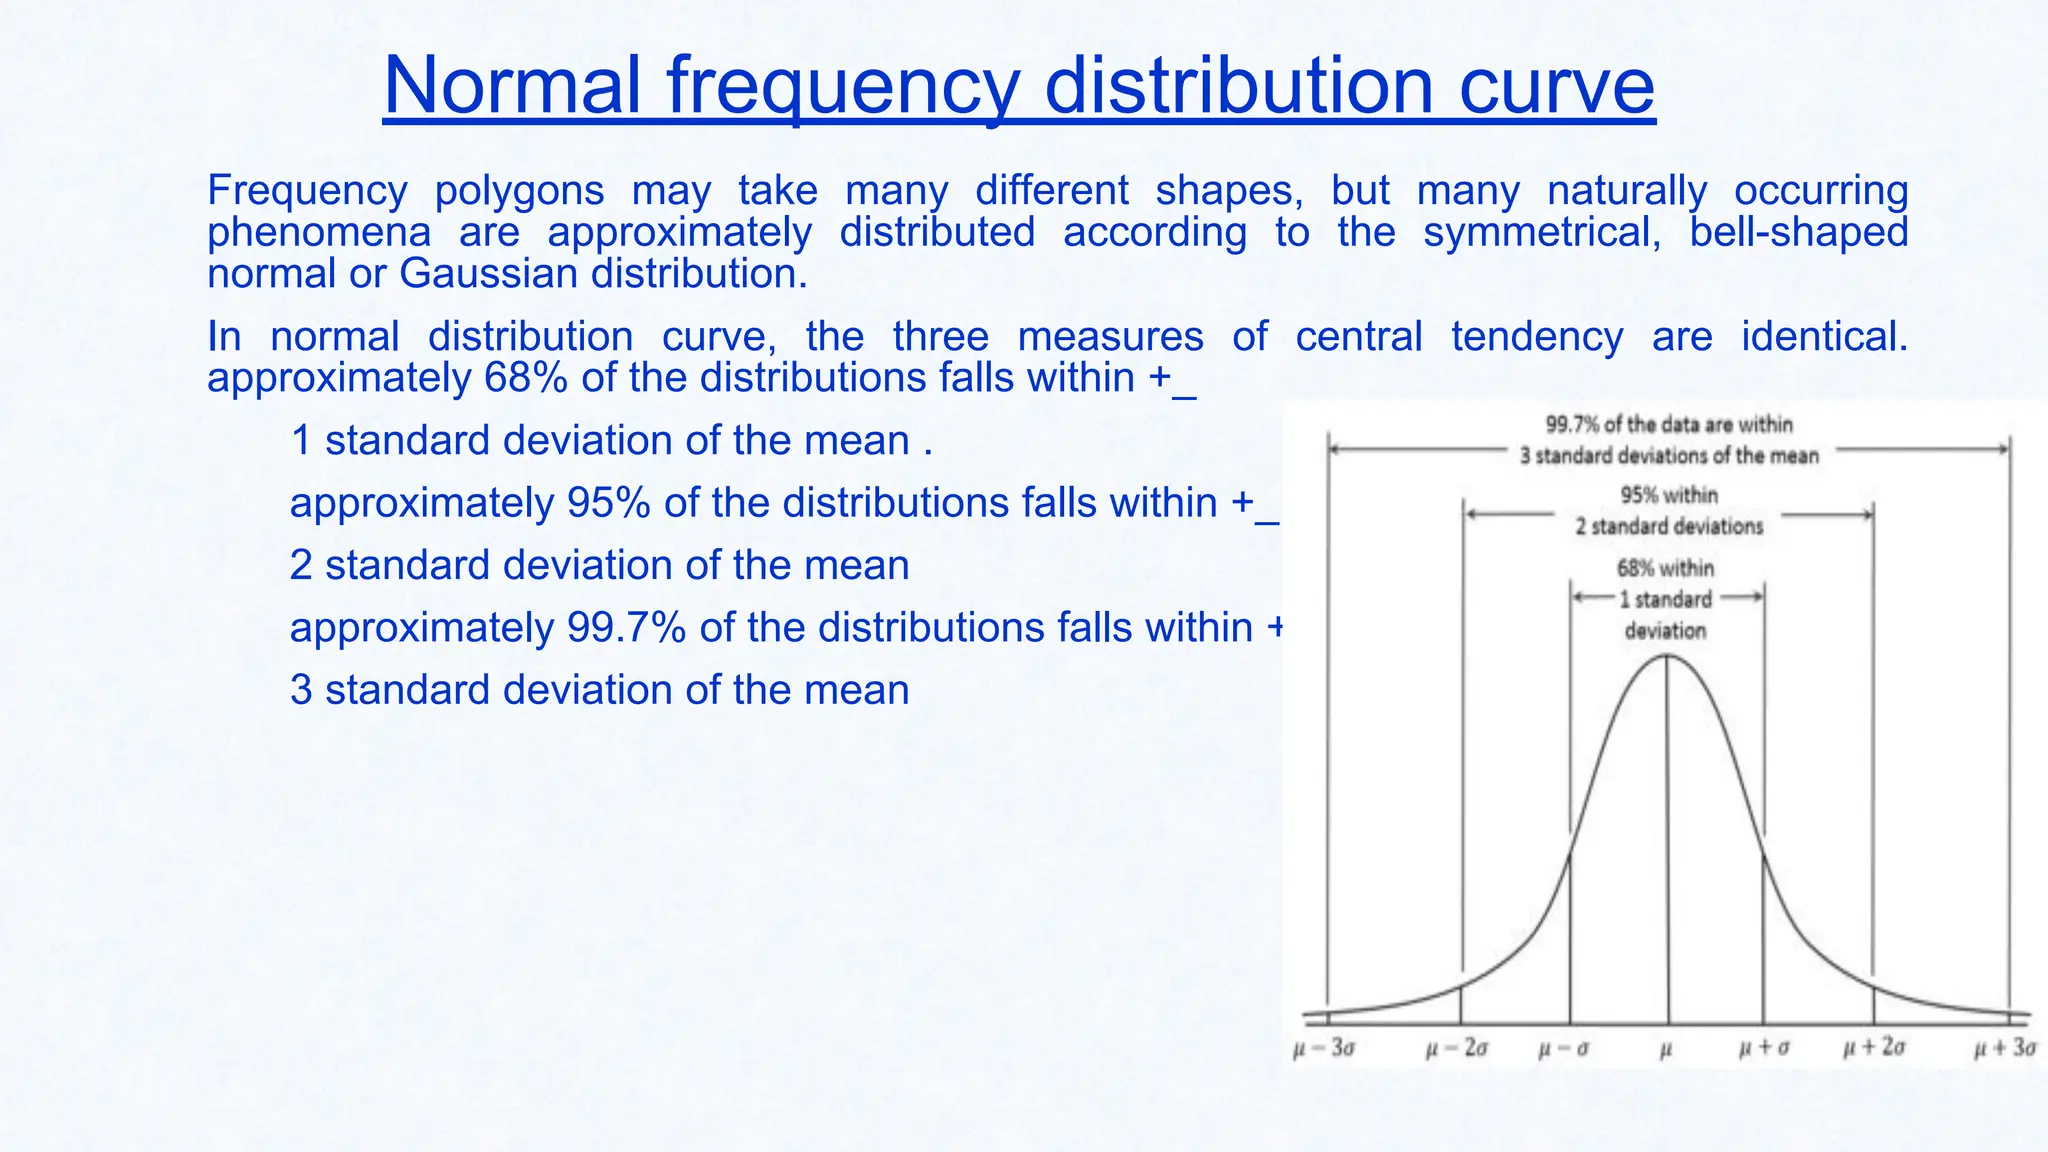
Normal frequency distributioncurve
Frequency polygons may take many different shapes, but many naturally occurring
phenomena are approximately distributed according to the symmetrical, bell-shaped
normal or Gaussian distribution.
In normal distribution curve, the three measures of central tendency are identical.
approximately 68% of the distributions falls within +_
1 standard deviation of the mean .
approximately 95% of the distributions falls within +_
2 standard deviation of the mean
approximately 99.7% of the distributions falls within +_
3 standard deviation of the mean
18.
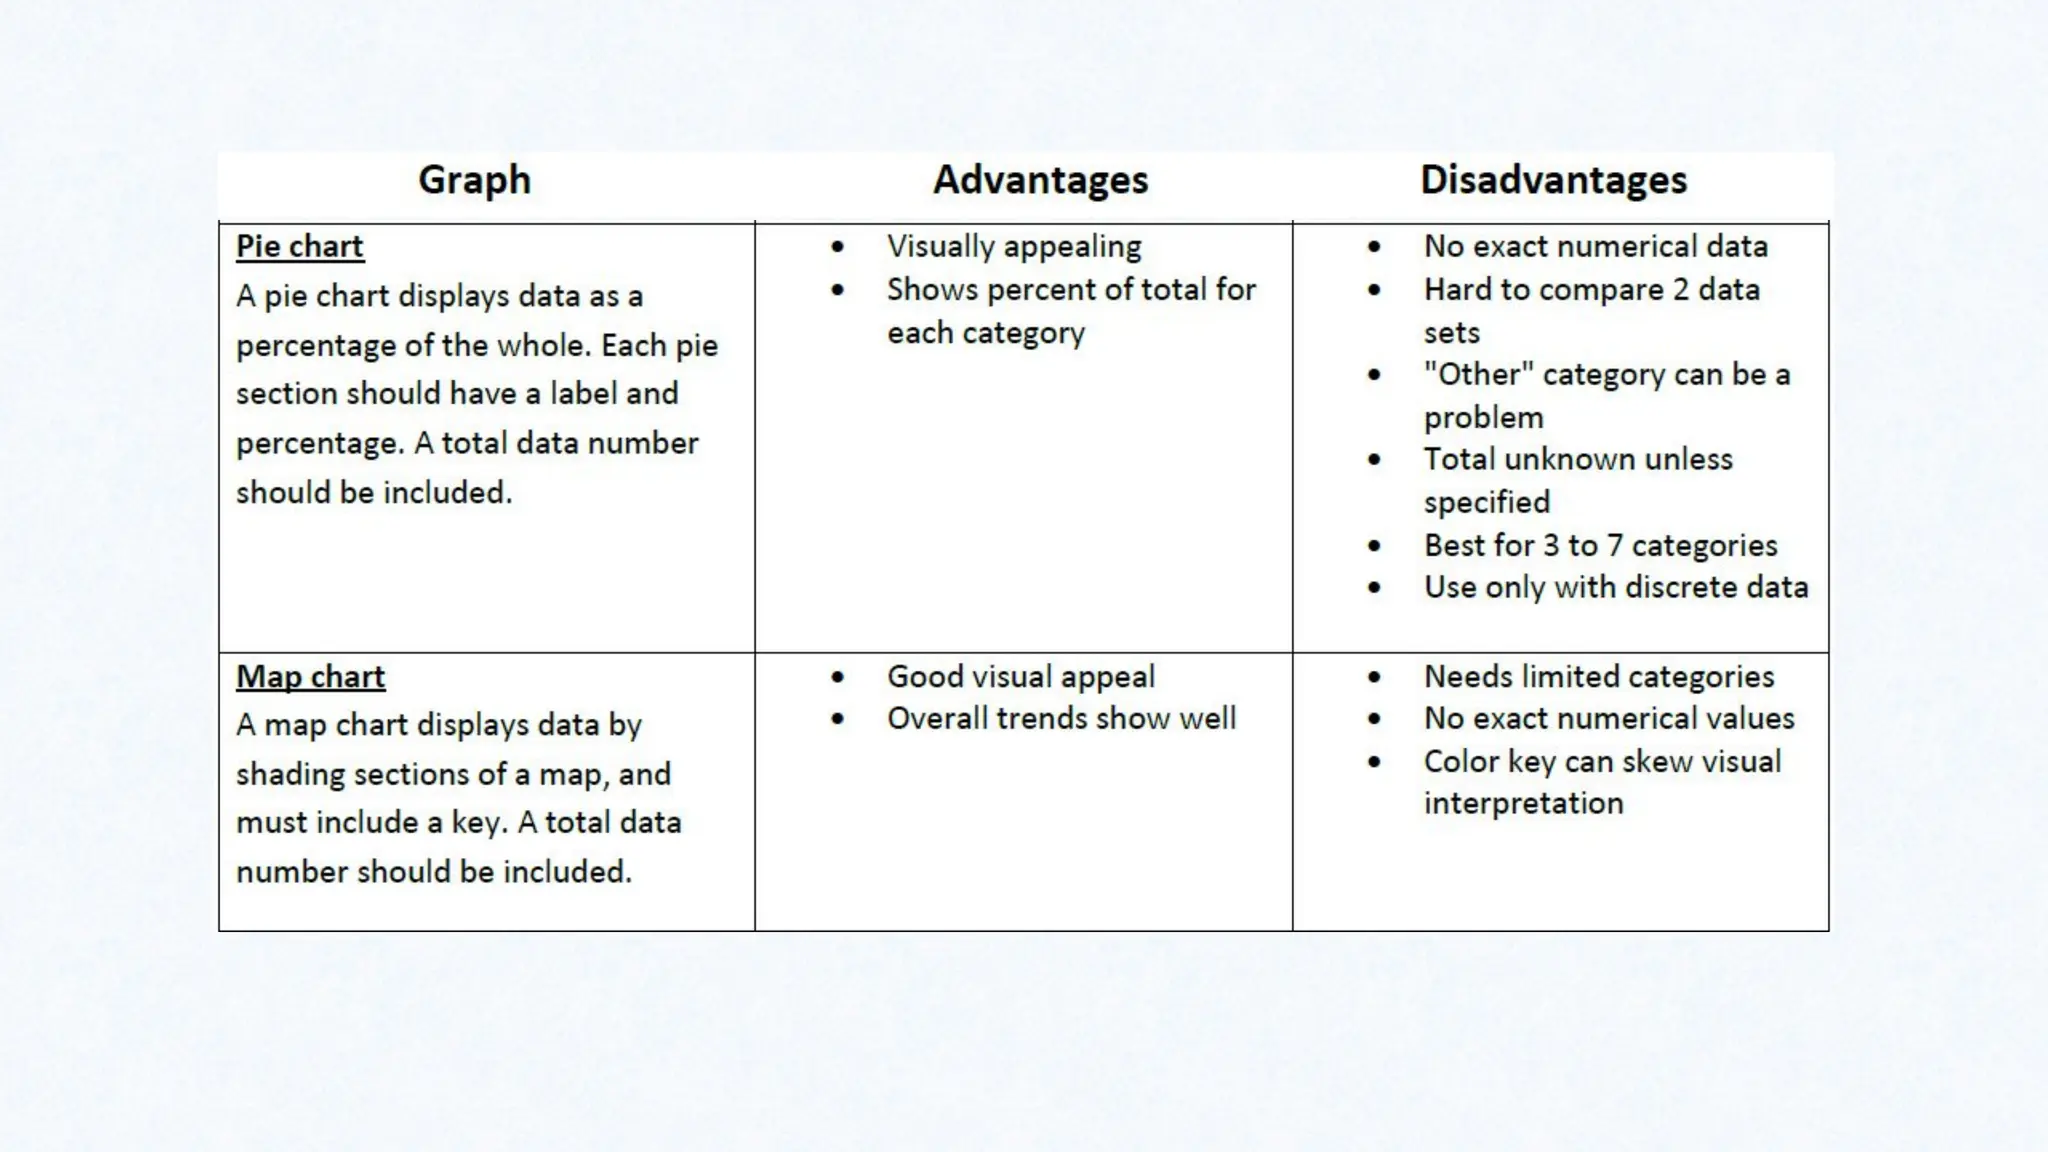
Pie charts
Most commonway of presenting data.
The value of each category is divided by the total values and then
multiplied by 360 and then each category is allocated the respective
angle to present the proportion it has.
It is often necessary to indicate percentages in the segment as it may
not be sometimes very easy virtually, to compare the areas of
segments.
19.
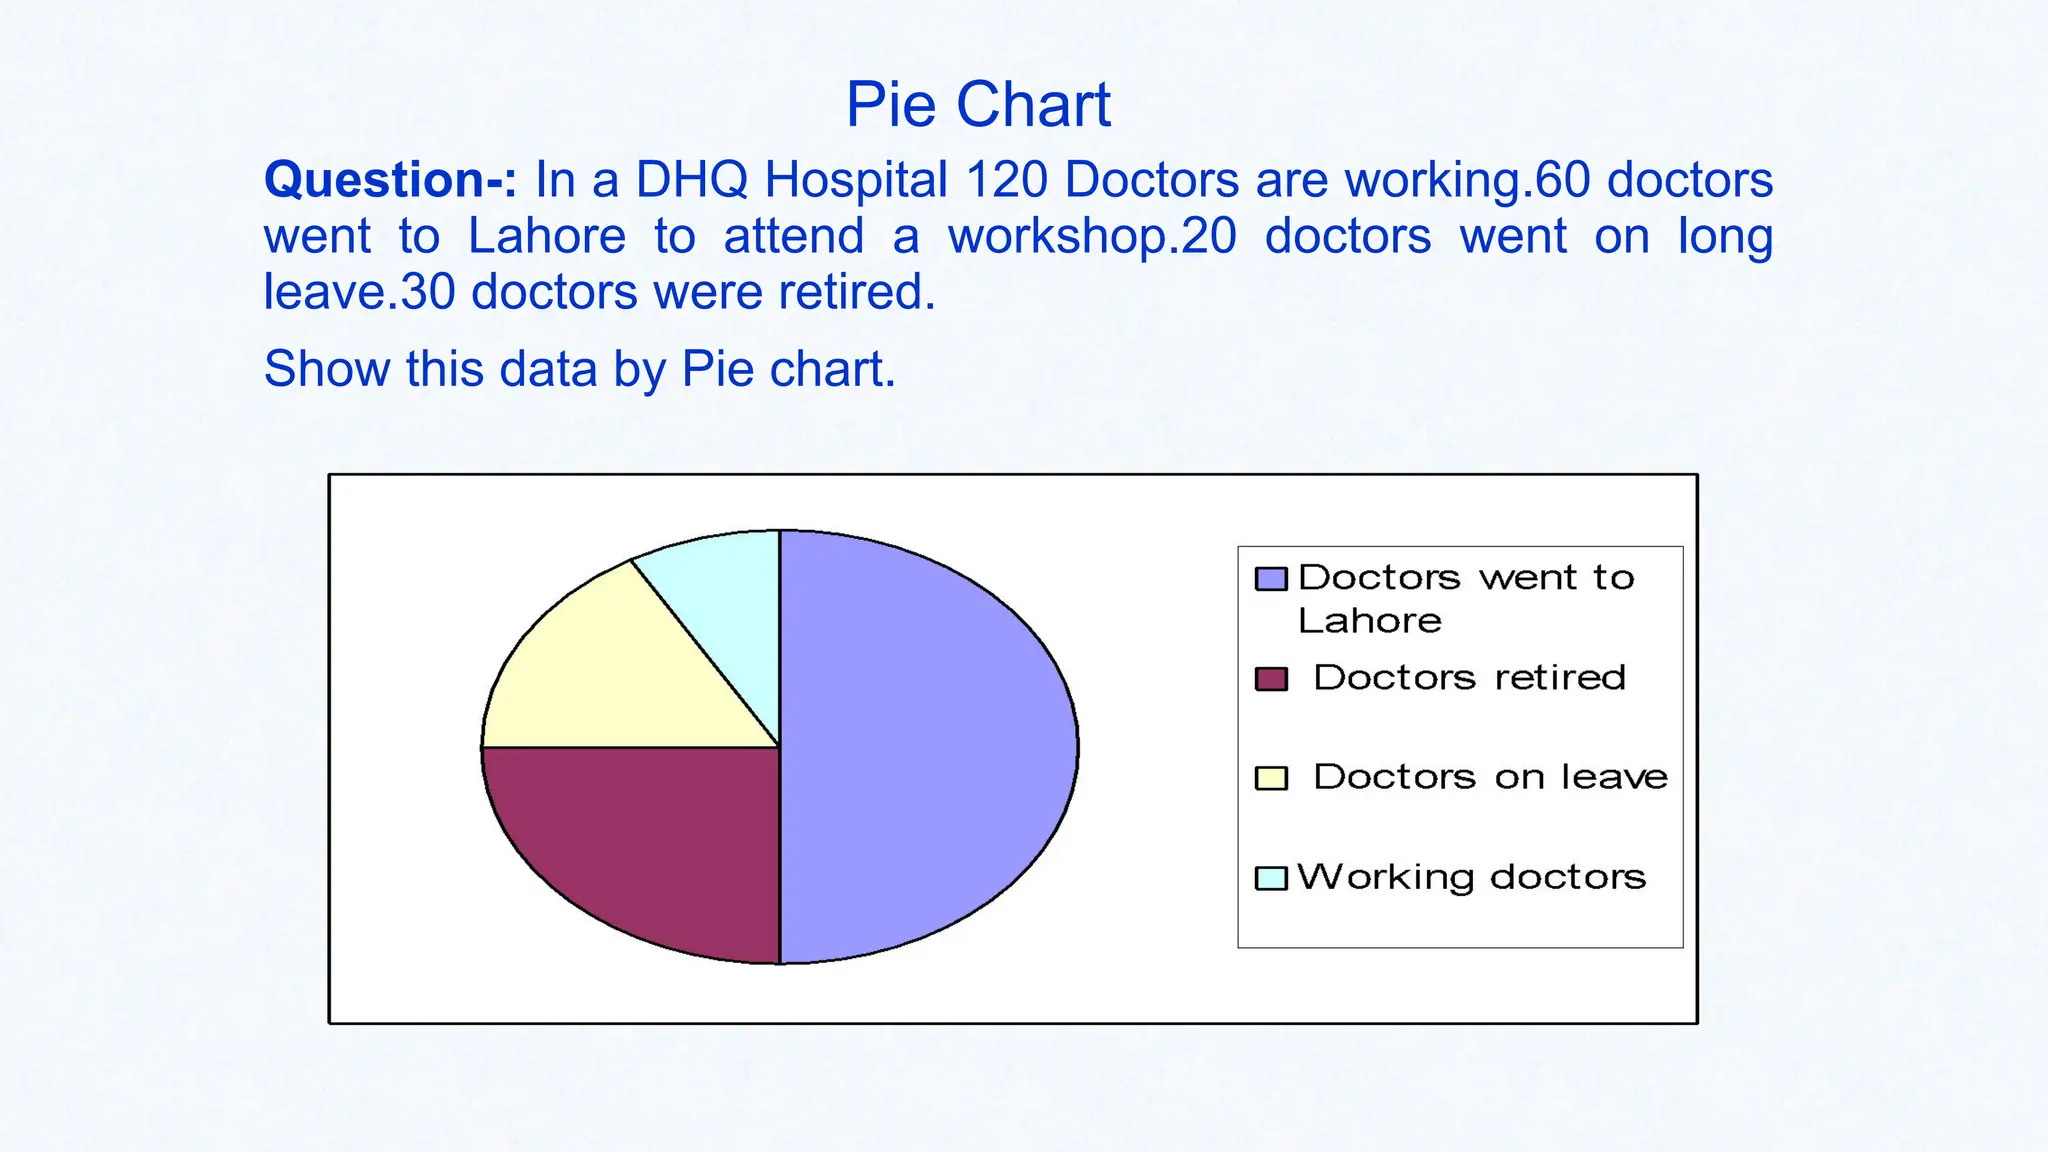
Pie Chart
Question-: Ina DHQ Hospital 120 Doctors are working.60 doctors
went to Lahore to attend a workshop.20 doctors went on long
leave.30 doctors were retired.
Show this data by Pie chart.
20.
Pictogram
Popular method ofpresenting data to those who cannot understand
orthodox charts.
Small pictures or symbols are used to present the data, e.g. a picture of
a doctor to represent the population physician.
Fraction of the picture can be used to represent numbers smaller than
the value of whole symbol.
21.
Statistical maps:
When statisticaldata refers to geographic or administrative areas, it is
presented either as statistical map or dot map.
The shaded maps are used to present data of varying size. The areas are
shaded with different colour or different intensities of the same colour, which is
indicated in the key.
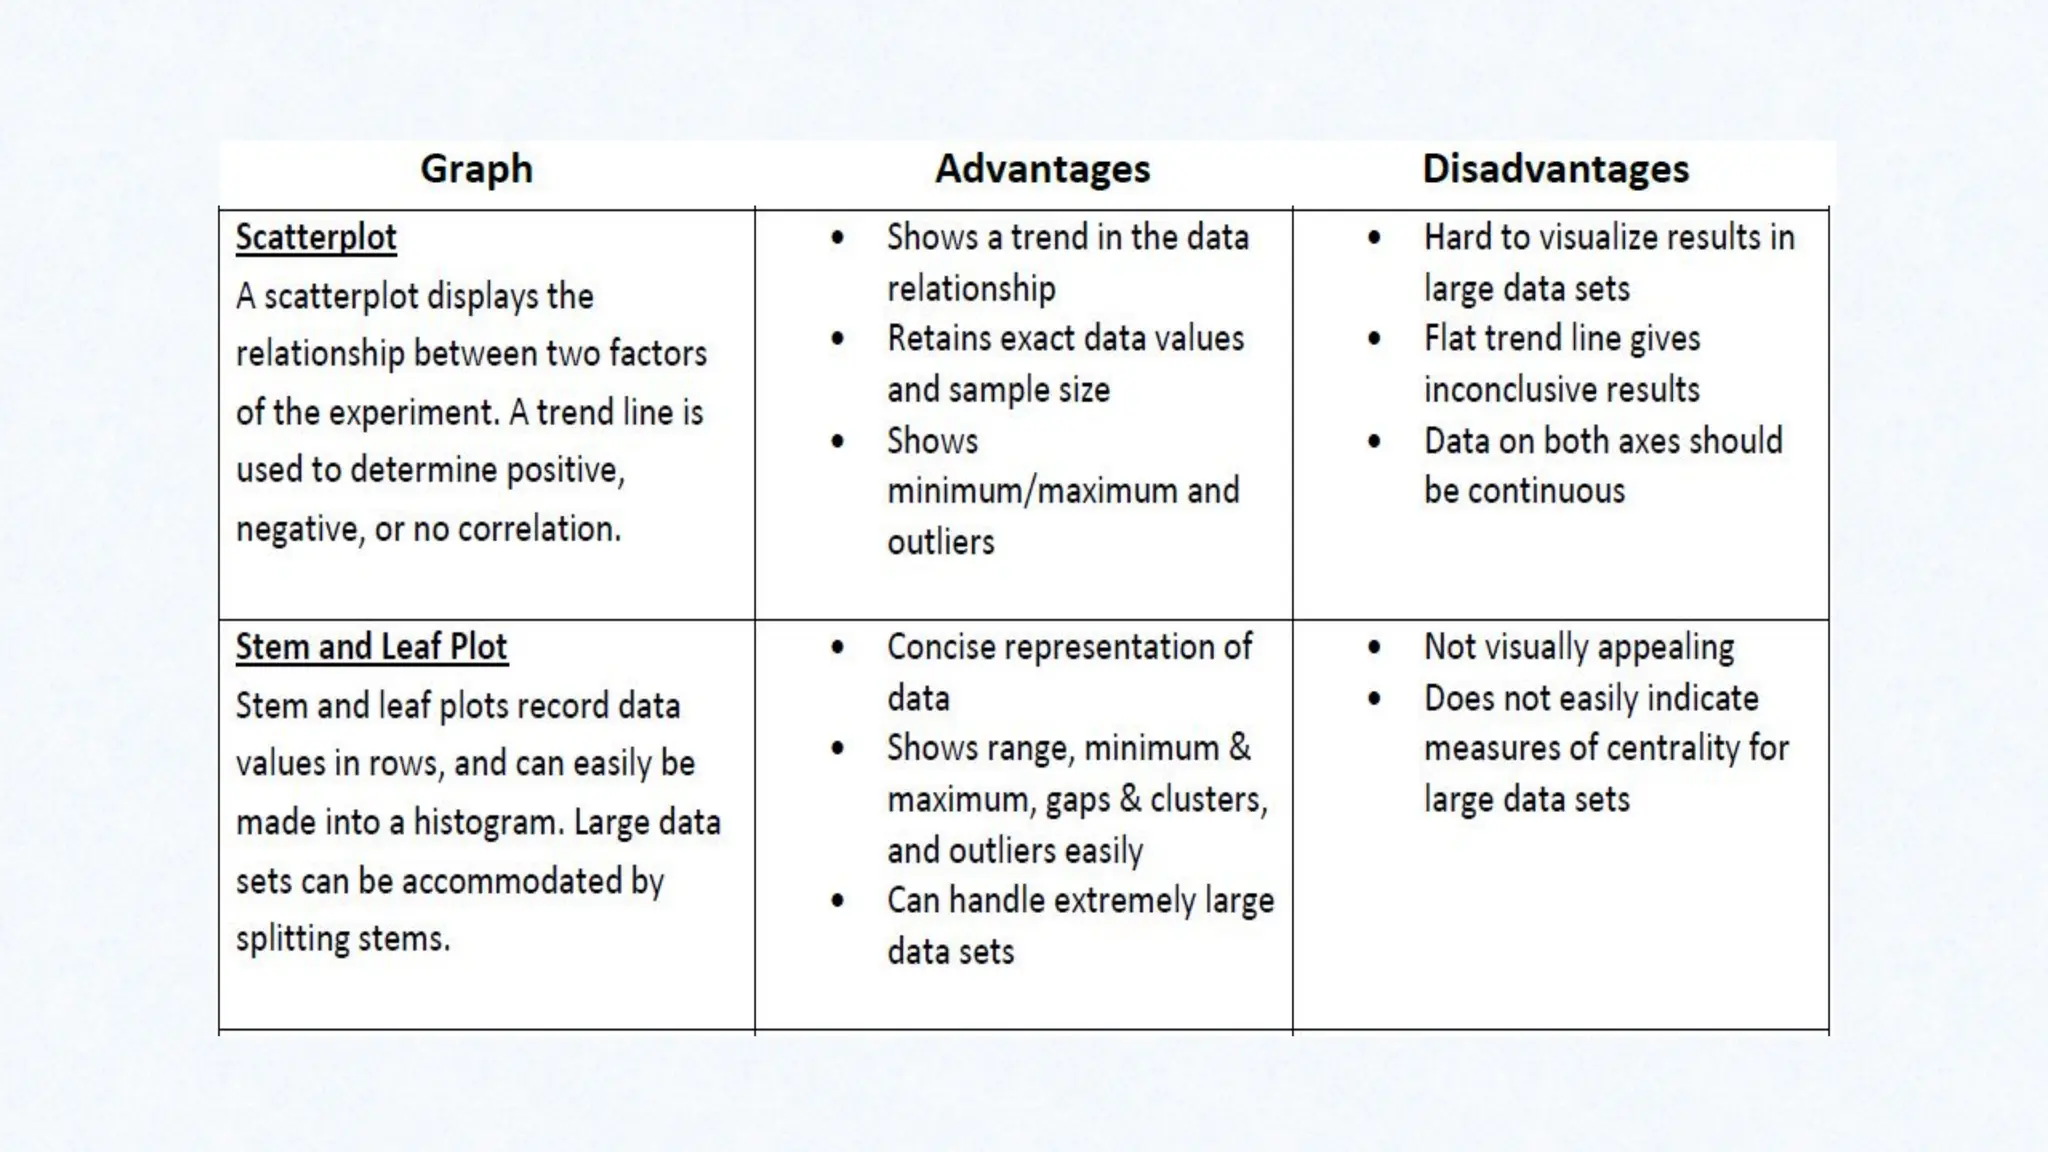
Scatter diagram:
Scatter diagrams show the relationship between the two variables e.g. a
positive correlation/ association between the intake of fat and sugar in the
average diets of 41 countries.
If the dots cluster round a straight line, it shows evidence of a relationship of a
linear nature.
If there is no such cluster, it is probable that there is no relationship between the
variables.
27.
Approaches in analysis
Deductiveapproach and inductive approaches:
Inductive reasoning starts with a conclusion and deductive reasoning starts with a
premise. Therefore, inductive reasoning moves from specific instances into a
generalized conclusion, while deductive reasoning moves from generalized
principles that are known to be true to a true and specific conclusion.
Deductive Reasoning – A type of logic in which one goes from a general statement
to a specific instance.
The classic example
All men are mortal. (major premise)
Socrates is a man. (minor premise)
Therefore, Socrates is mortal. (conclusion)
Inductive Reasoning, involves going from a series of specific cases to a general
statement. The conclusion in an inductive argument is never guaranteed.
28.
Data Analysis
WHY DOWE ANALYZE DATA?
The purpose of analysing data is to obtain usable and useful information.
The analysis, irrespective of whether the data is qualitative or
quantitative, may:
•describe and summarise the data
•identify relationships between variables
•compare variables
•identify the difference between variables
•forecast outcomes
29.
Data Analysis
Analysis ofdata, also known as data analytics, is a process of
inspecting, cleansing, transforming, and modelling data with the goal of discovering
useful information, suggesting conclusions, and supporting decision-making.
Data cleansing, data cleaning, or data scrubbing is the process of detecting and
correcting (or removing) corrupt or inaccurate records from a record set, table,
or database and refers to identifying incomplete, incorrect, inaccurate or irrelevant parts of
the data and then replacing, modifying, or deleting the dirty or coarse data.
Data transformation converts a set of data values from the data format of a source data
system into the data format of a destination data system.
30.
Data Analysis DuringCollection
Analysis not left until the end
To avoid collecting data that are not important
the researcher must ask:
▪ How am I going to make sense of this data?
As they collect data the researcher must ask
▪ Why do the participants act as they do?
▪ What does this focus mean?
▪ What else do I want to know?
▪ What new ideas have emerged?
▪ Is this new information?
31.
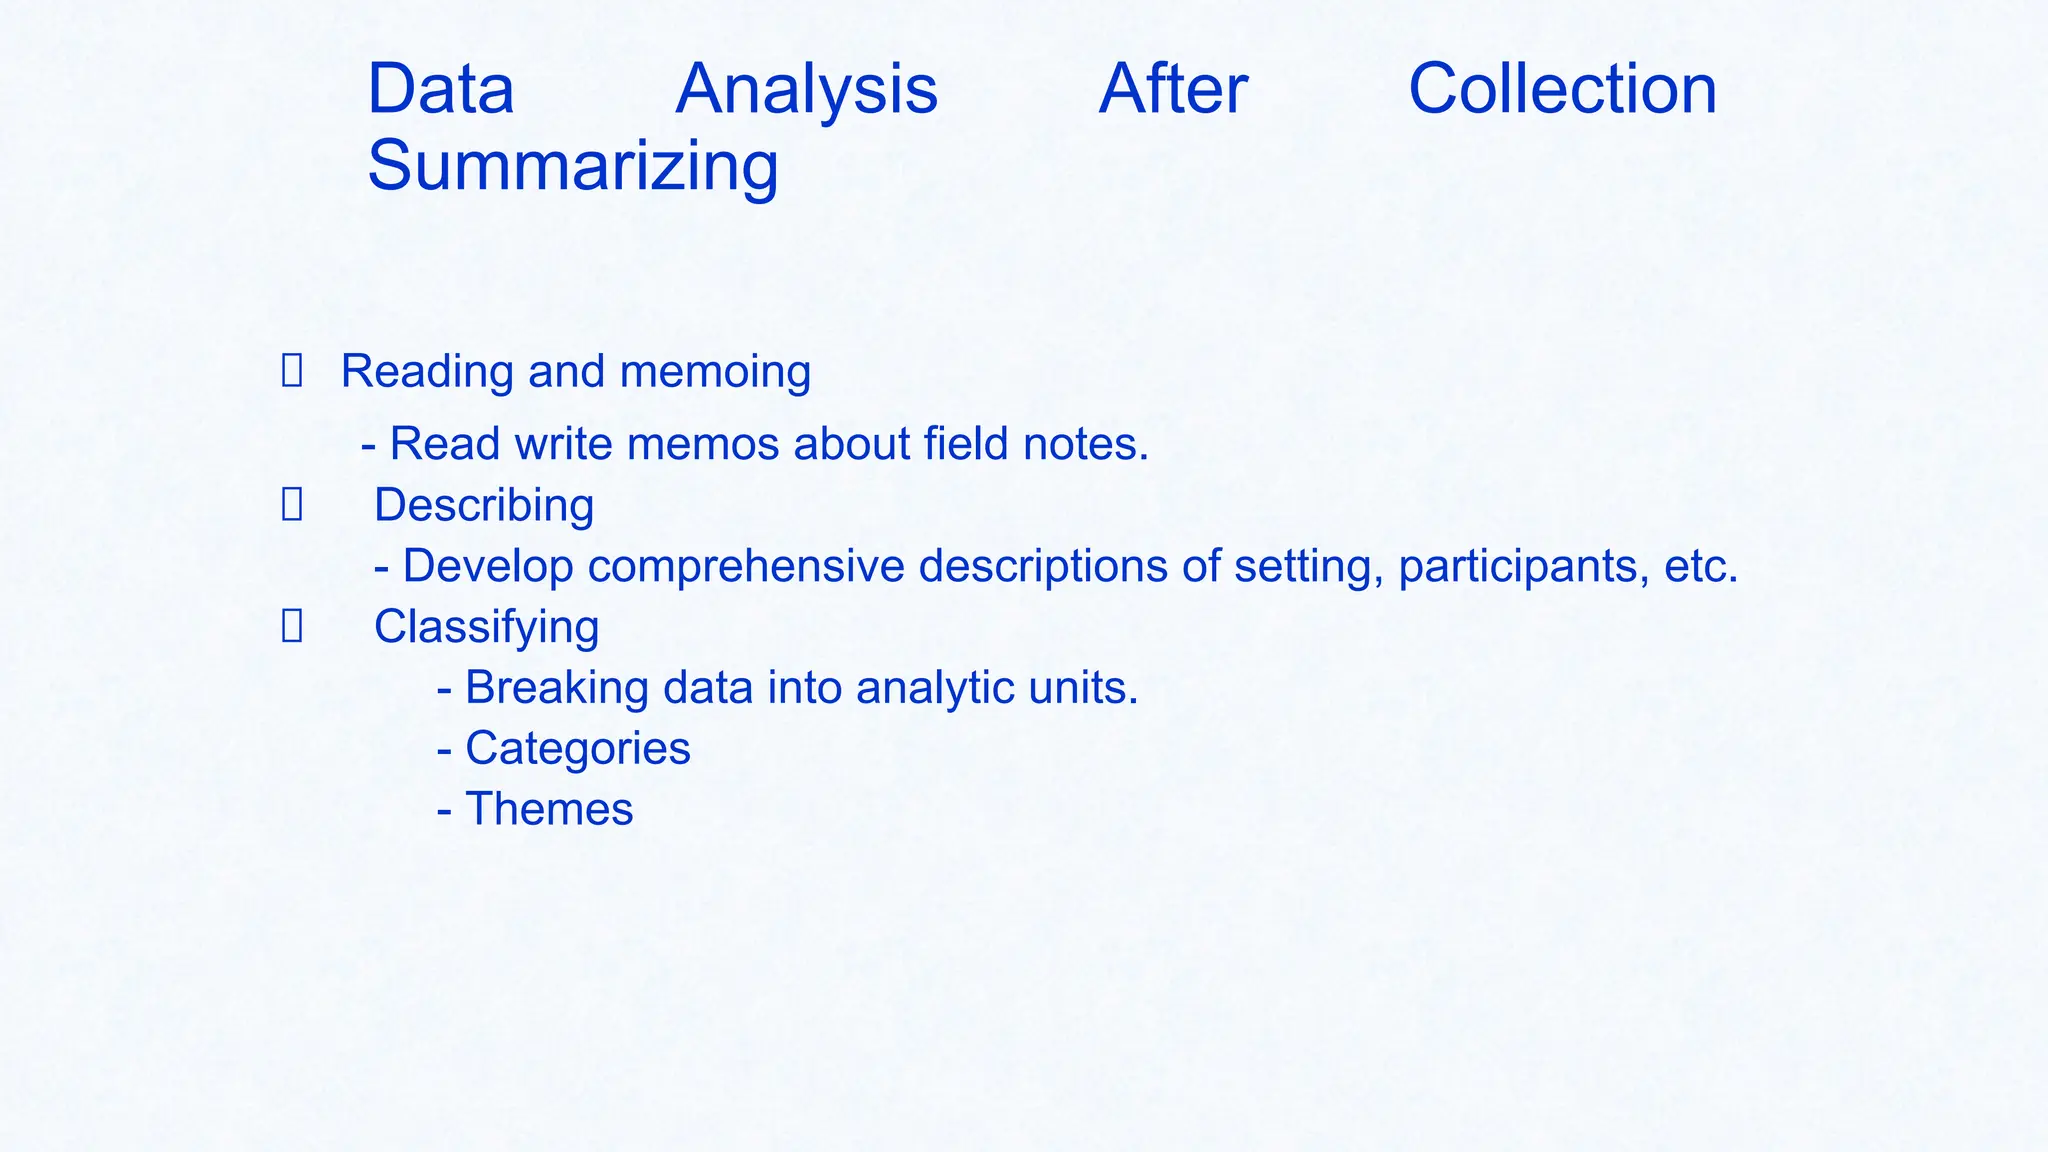
Data Analysis AfterCollection
Summarizing
Reading and memoing
- Read write memos about field notes.
Describing
- Develop comprehensive descriptions of setting, participants, etc.
Classifying
- Breaking data into analytic units.
- Categories
- Themes
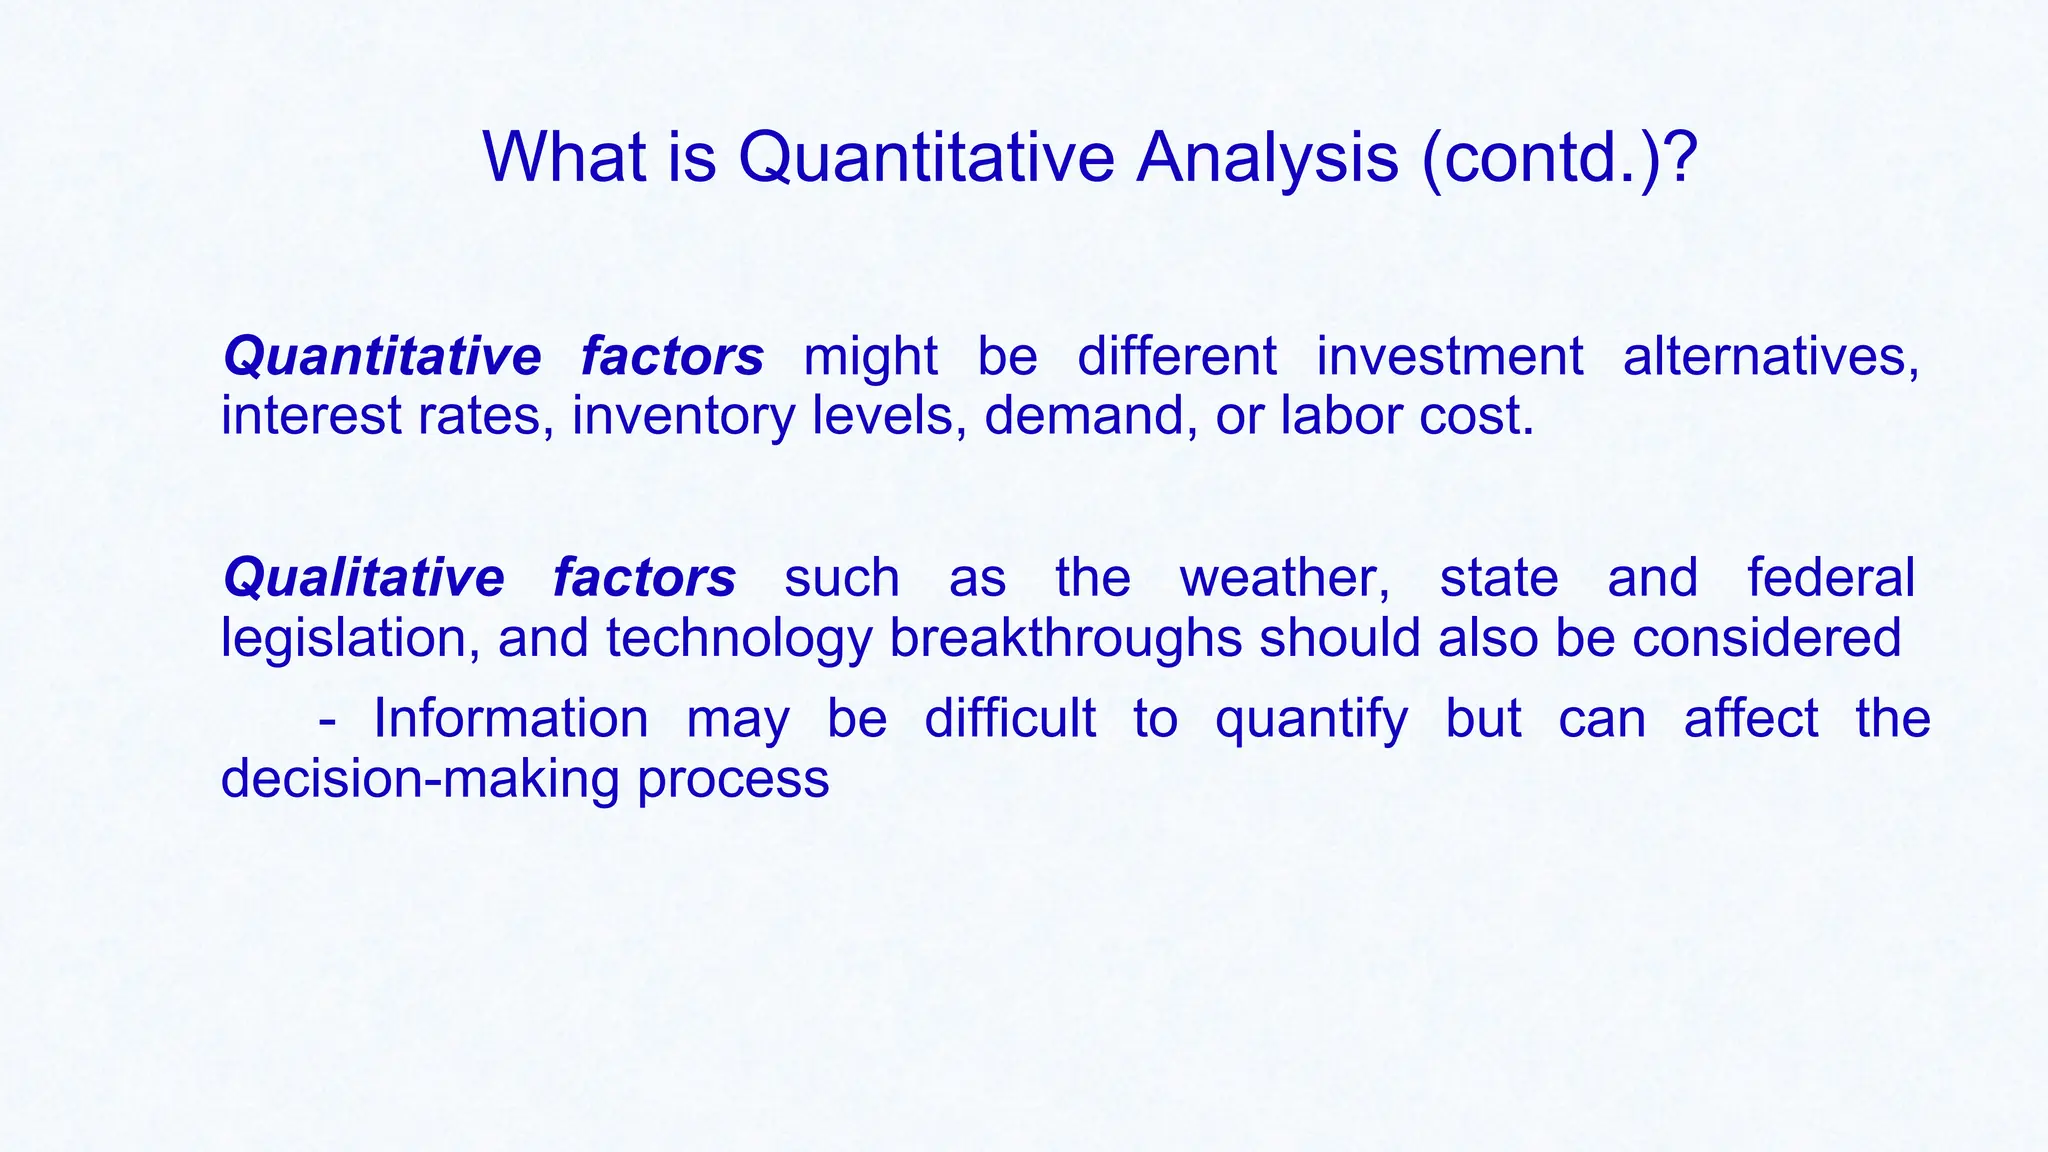
What is QuantitativeAnalysis (contd.)?
Quantitative factors might be different investment alternatives,
interest rates, inventory levels, demand, or labor cost.
Qualitative factors such as the weather, state and federal
legislation, and technology breakthroughs should also be considered
- Information may be difficult to quantify but can affect the
decision-making process
38.
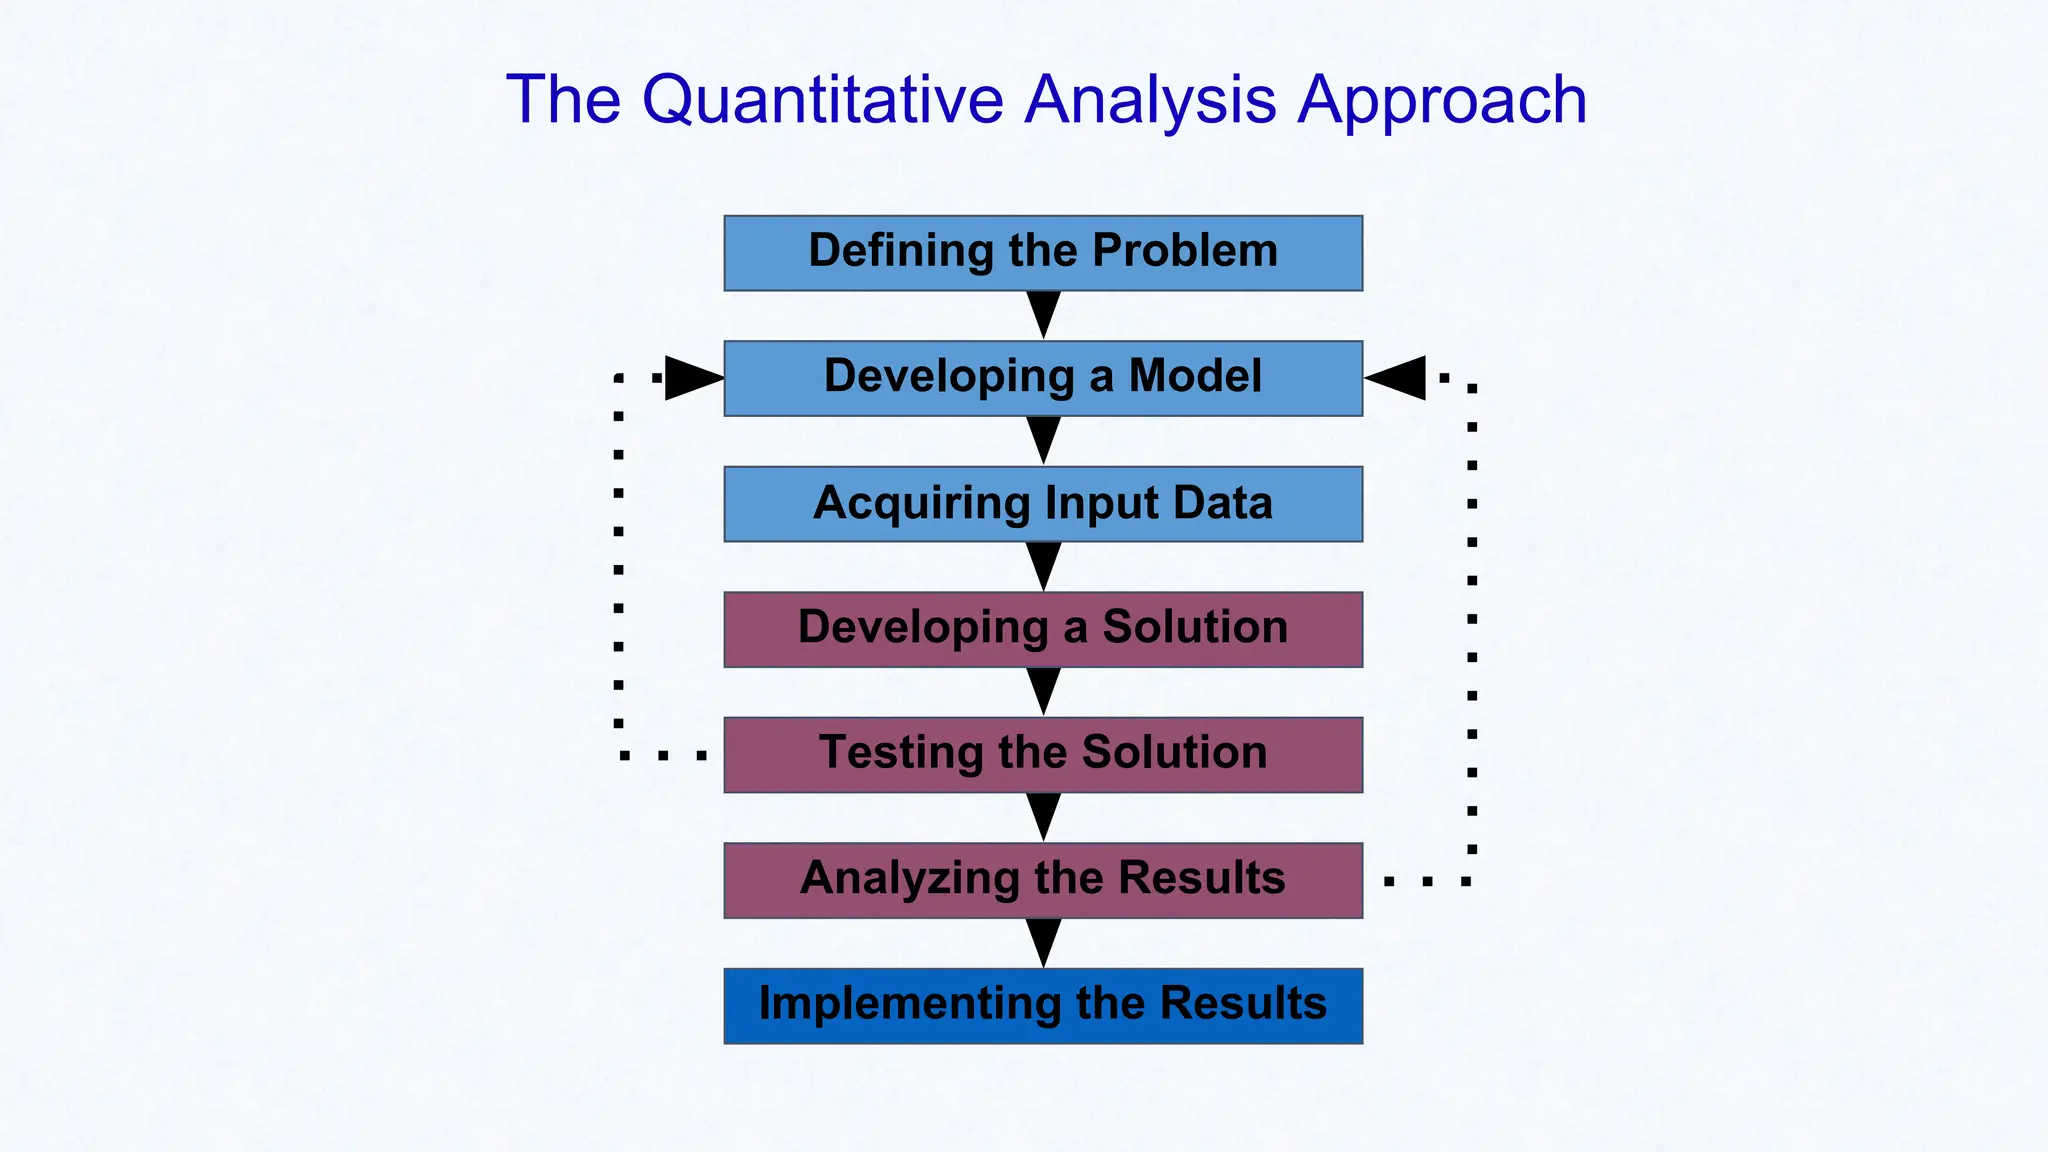
Implementing the Results
Analyzingthe Results
Testing the Solution
Developing a Solution
Acquiring Input Data
Developing a Model
The Quantitative Analysis Approach
Defining the Problem
39.
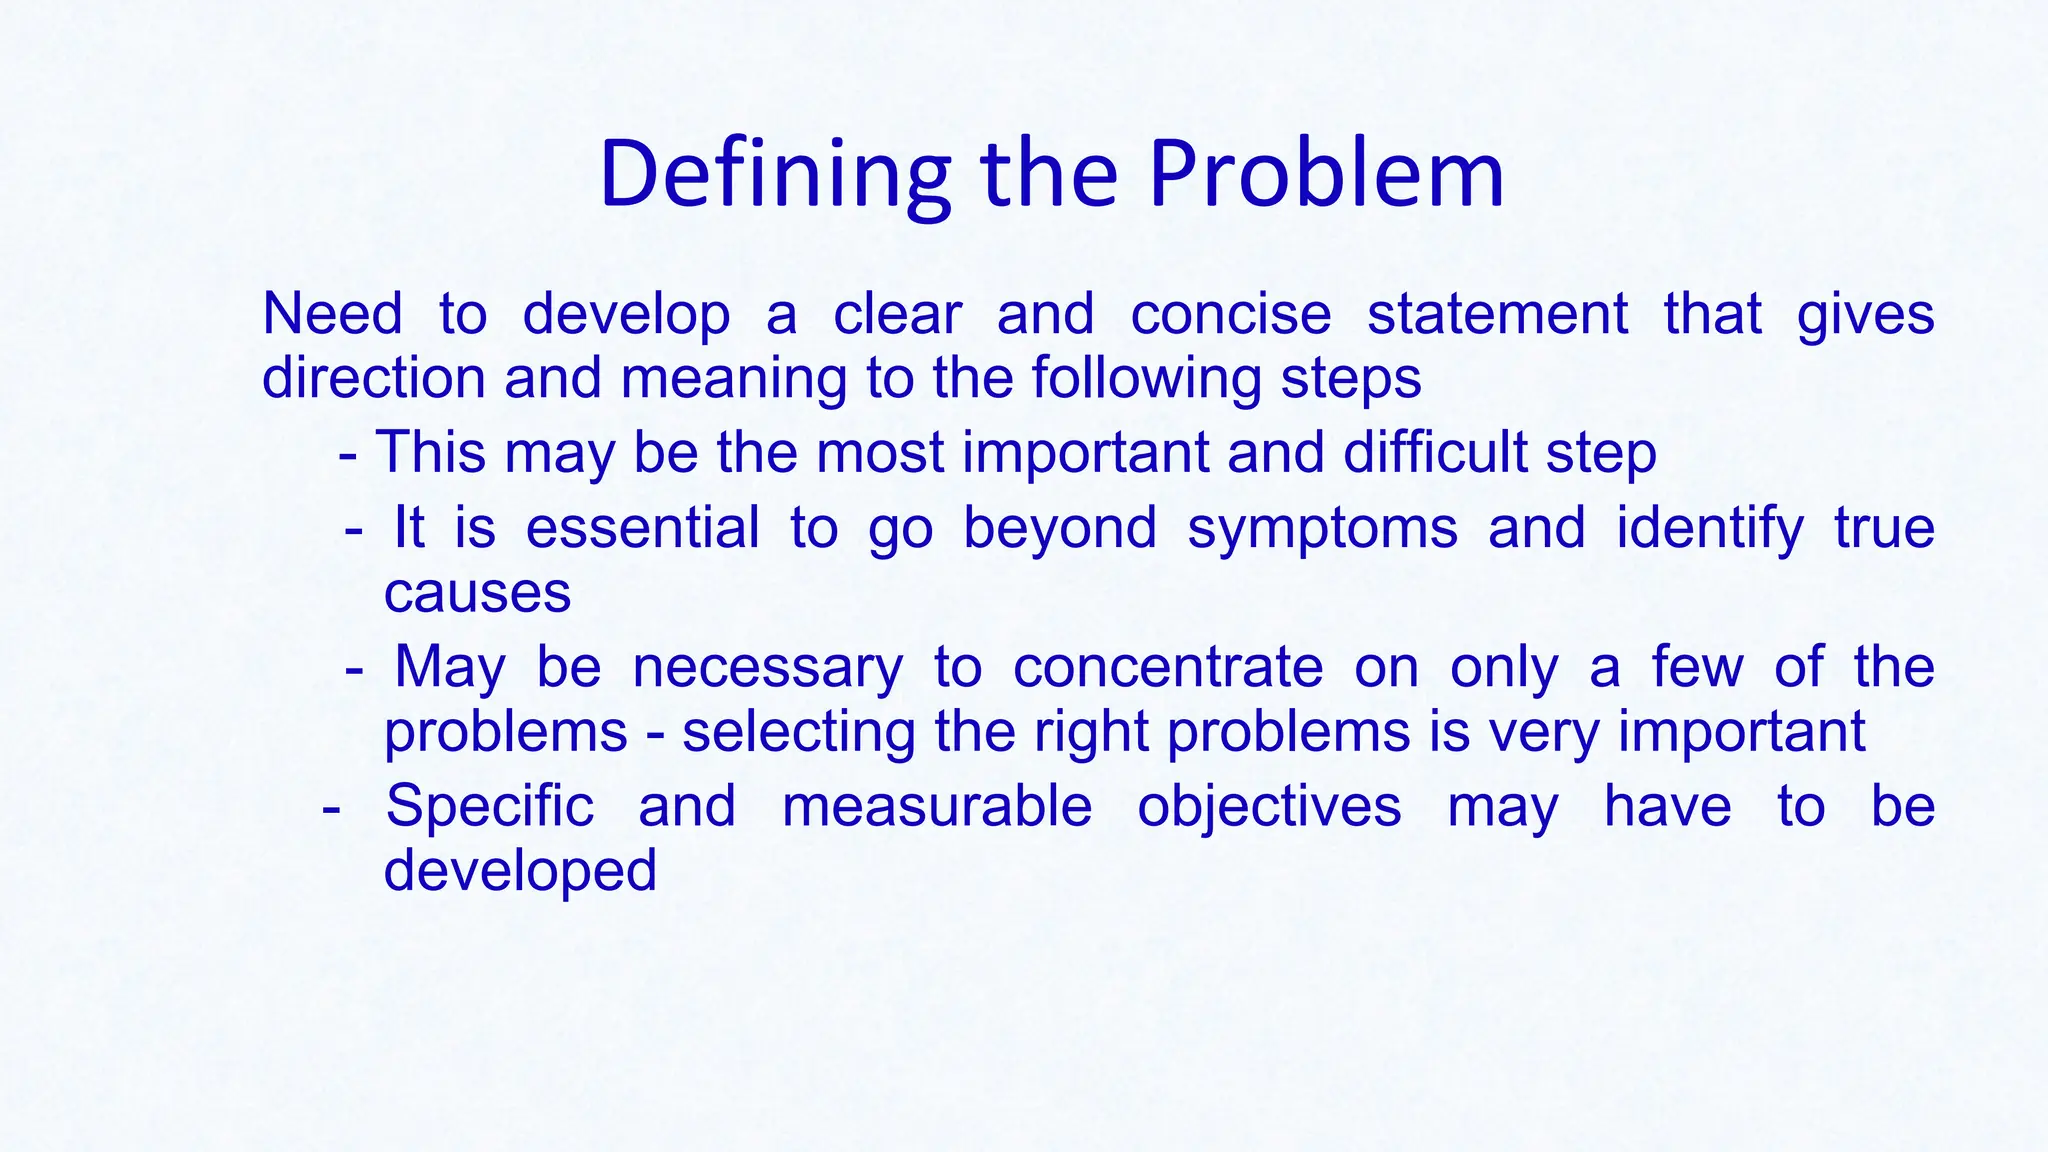
Defining the Problem
Needto develop a clear and concise statement that gives
direction and meaning to the following steps
- This may be the most important and difficult step
- It is essential to go beyond symptoms and identify true
causes
- May be necessary to concentrate on only a few of the
problems - selecting the right problems is very important
- Specific and measurable objectives may have to be
developed
40.
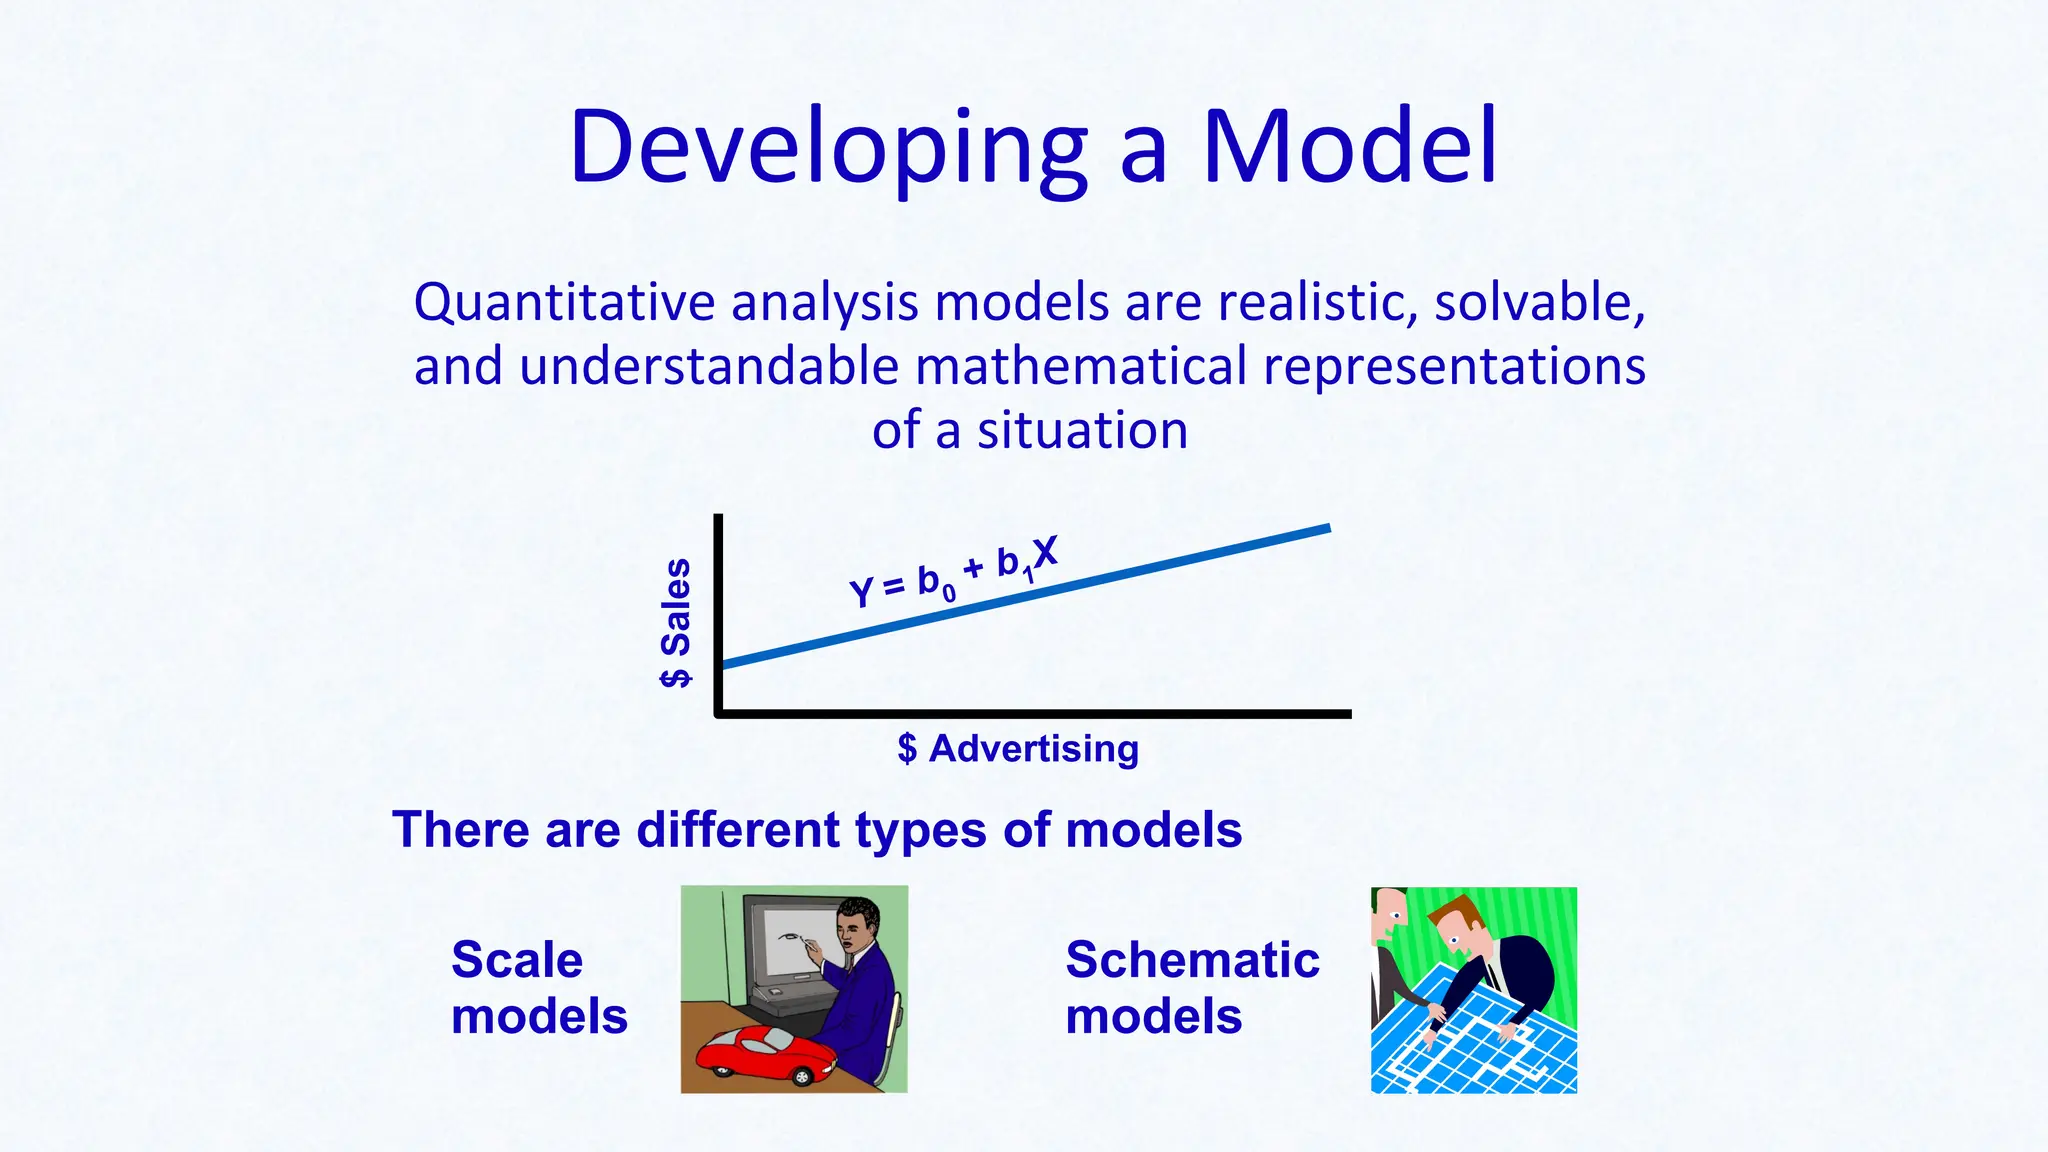
Developing a Model
Quantitativeanalysis models are realistic, solvable,
and understandable mathematical representations
of a situation
There are different types of models
$ Advertising
$
Sales
Y = b0
+ b1
X
Schematic
models
Scale
models
41.
Developing a Model
Modelsgenerally contain variables (controllable and
uncontrollable) and parameters.
Controllable variables are generally the decision
variables and are generally unknown.
Parameters are known quantities that are a part of the
problem.
42.
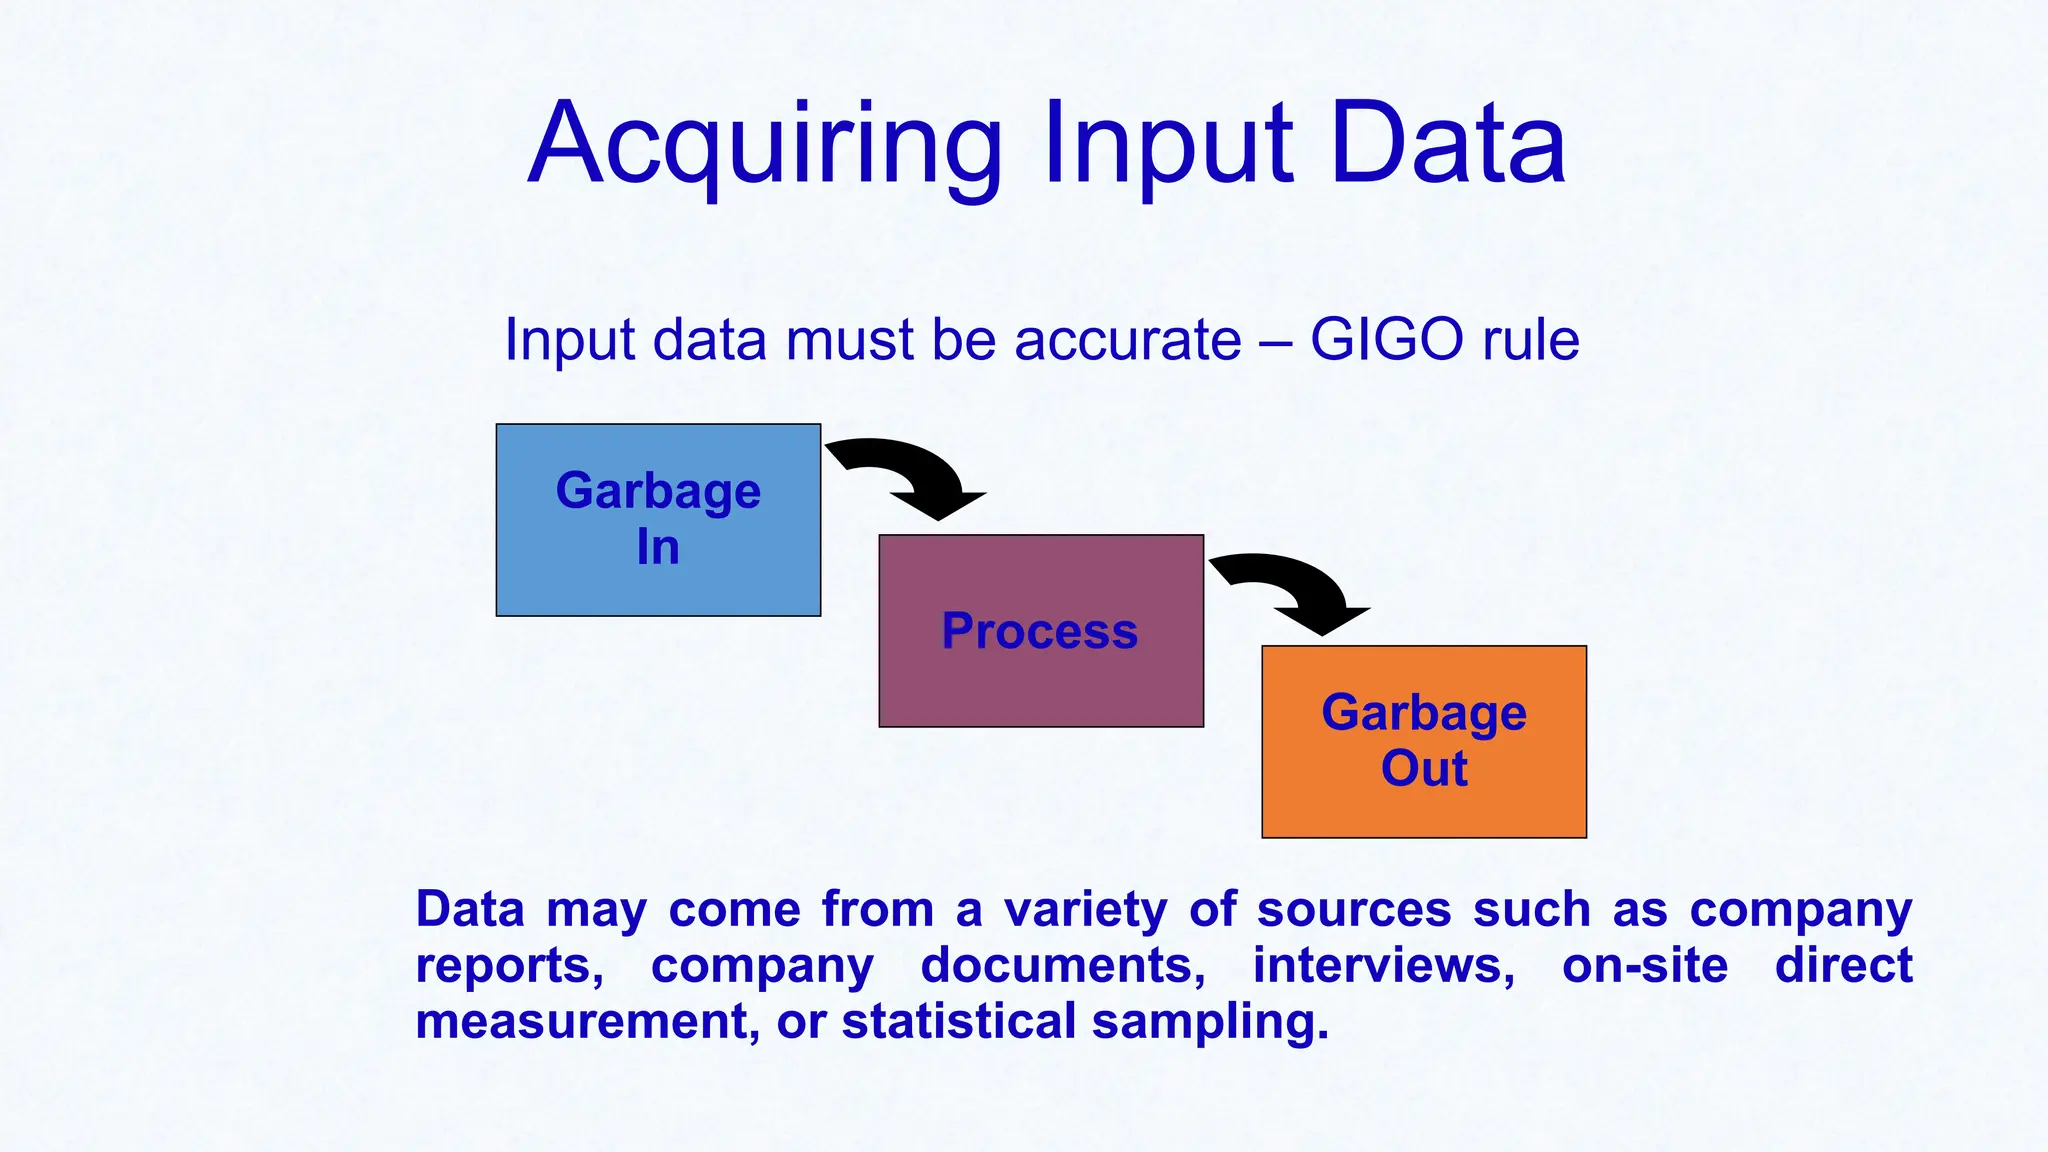
Acquiring Input Data
Inputdata must be accurate – GIGO rule
Data may come from a variety of sources such as company
reports, company documents, interviews, on-site direct
measurement, or statistical sampling.
Garbage
In
Process
Garbage
Out
43.
Developing a Solution
▪The best (optimal) solution to a problem is found by
manipulating the model variables until a solution is found
that is practical and can be implemented
▪ Common techniques are
Solving equations
Trial and error – trying various approaches and picking
the best result
Complete enumeration – trying all possible values
Using an algorithm – a series of repeating steps to reach
a solution
44.
Testing the Solution
Bothinput data and the model should be tested for
accuracy before analysis and implementation
- New data can be collected to test the model.
- Results should be logical, consistent, and represent
the real situation.
45.
Analyzing the Results
Determinethe implications of the solution
▪ Implementing results often requires change in an
organization.
▪ The impact of actions or changes needs to be studied
and understood before implementation.
Sensitivity analysis determines how much the results of
the analysis will change if the model or input data
changes.
■ Sensitive models should be very thoroughly tested.
46.
Implementing the Results
Implementationincorporates the solution into the
company.
▪ Implementation can be very difficult.
▪ People can resist changes.
▪ Many quantitative analysis efforts have failed
because a good, workable solution was not
properly implemented.
Changes occur over time, so even successful
implementations must be monitored to determine if
modifications are necessary.
47.
Modeling in theReal World
Quantitative analysis models are used extensively by
real organizations to solve real problems
▪ In the real world, quantitative analysis models can
be complex, expensive, and difficult to sell
▪ Following the steps in the process is an important
component of success
48.
Advantages of MathematicalModeling
1. Models can accurately represent reality.
2. Models can help a decision maker formulate problems.
3. Models can give us insight and information.
4. Models can save time and money in decision making and
problem solving.
5. A model may be the only way to solve large or complex
problems in a timely fashion.
6. A model can be used to communicate problems and
solutions to others.
49.
Models Categorized byRisk
▪ Mathematical models that do not involve risk are called
deterministic models.
▪ We know all the values used in the model with
complete certainty.
▪ Mathematical models that involve risk, chance, or
uncertainty are called probabilistic models.
▪ Values used in the model are estimates based on
probabilities.
50.
Possible Problems inthe Quantitative Analysis Approach
Defining the problem
Problems are not easily identified.
Conflicting viewpoints.
Impact on other departments.
Beginning assumptions.
Solution outdated.
Developing a model
Fitting the textbook models.
Understanding the model.
51.
Possible Problems inthe Quantitative Analysis Approach
Acquiring input data
Using accounting data
Validity of data
Developing a solution
Hard-to-understand mathematics
Only one answer is limiting
Testing the solution
Analyzing the results
52.
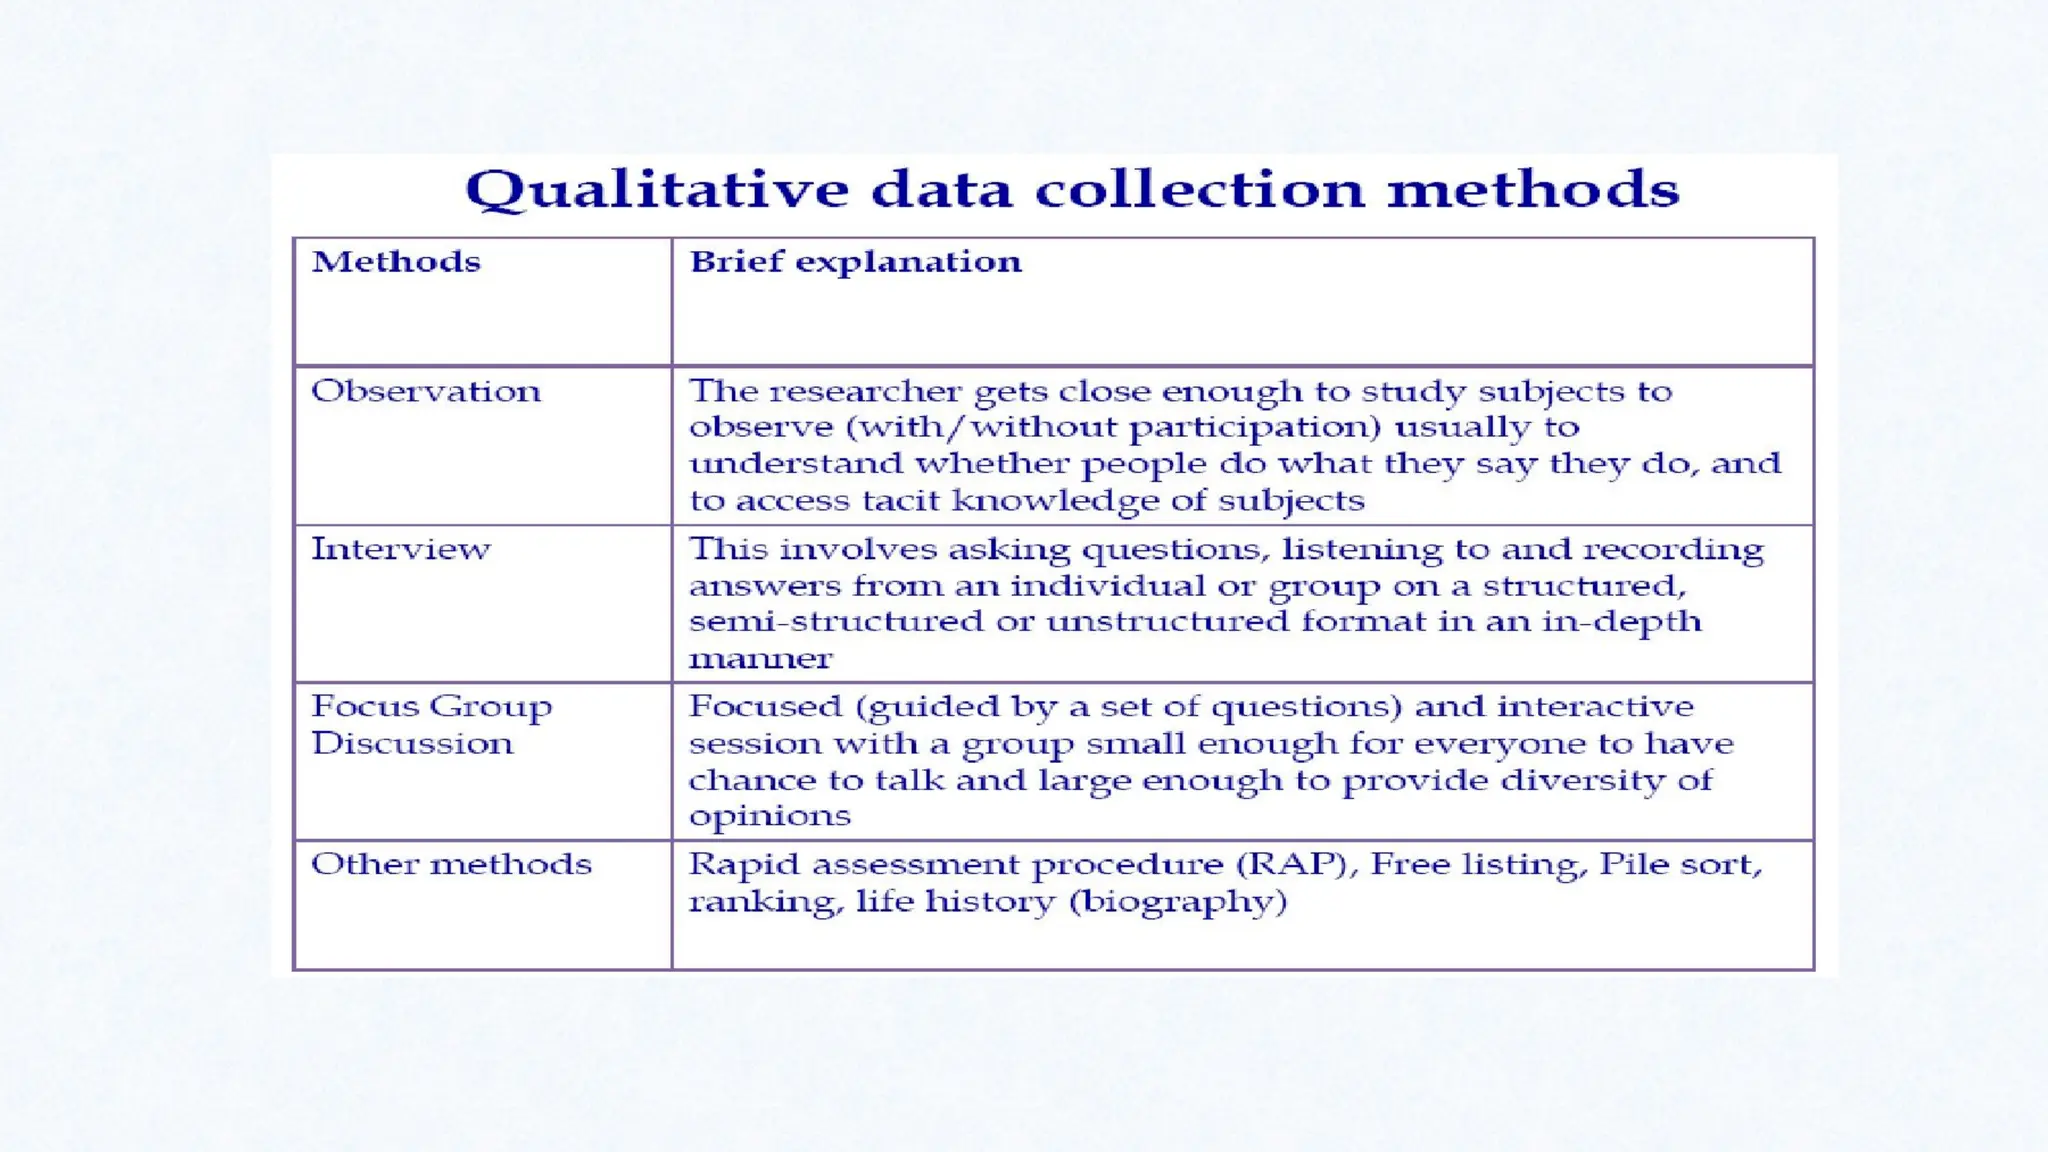
What is QualitativeData Analysis?
Qualitative Data Analysis (QDA) is the range of processes
and procedures whereby we move from the qualitative data
that have been collected into some form of explanation,
understanding or interpretation of the people and situations
we are investigating.
QDA is usually based on an interpretative philosophy. The
idea is to examine the meaningful and symbolic content of
qualitative data.
53.
What is qualitativedata?
Data that are not easily reduced to numbers.
Data that are related to concepts, opinions, values and
behaviours of people in social context.
Transcripts of individual interviews and focus groups,
field notes from observation of certain activities, copies
of documents, audio/video recordings.
54.
Types of QualitativeData
Structured text, (writings, stories, survey comments,
news articles, books etc.).
Unstructured text (transcription, interviews, focus
groups, conversation) .
Audio recordings, music .
Video recordings (graphics, art, pictures, visuals).
55.
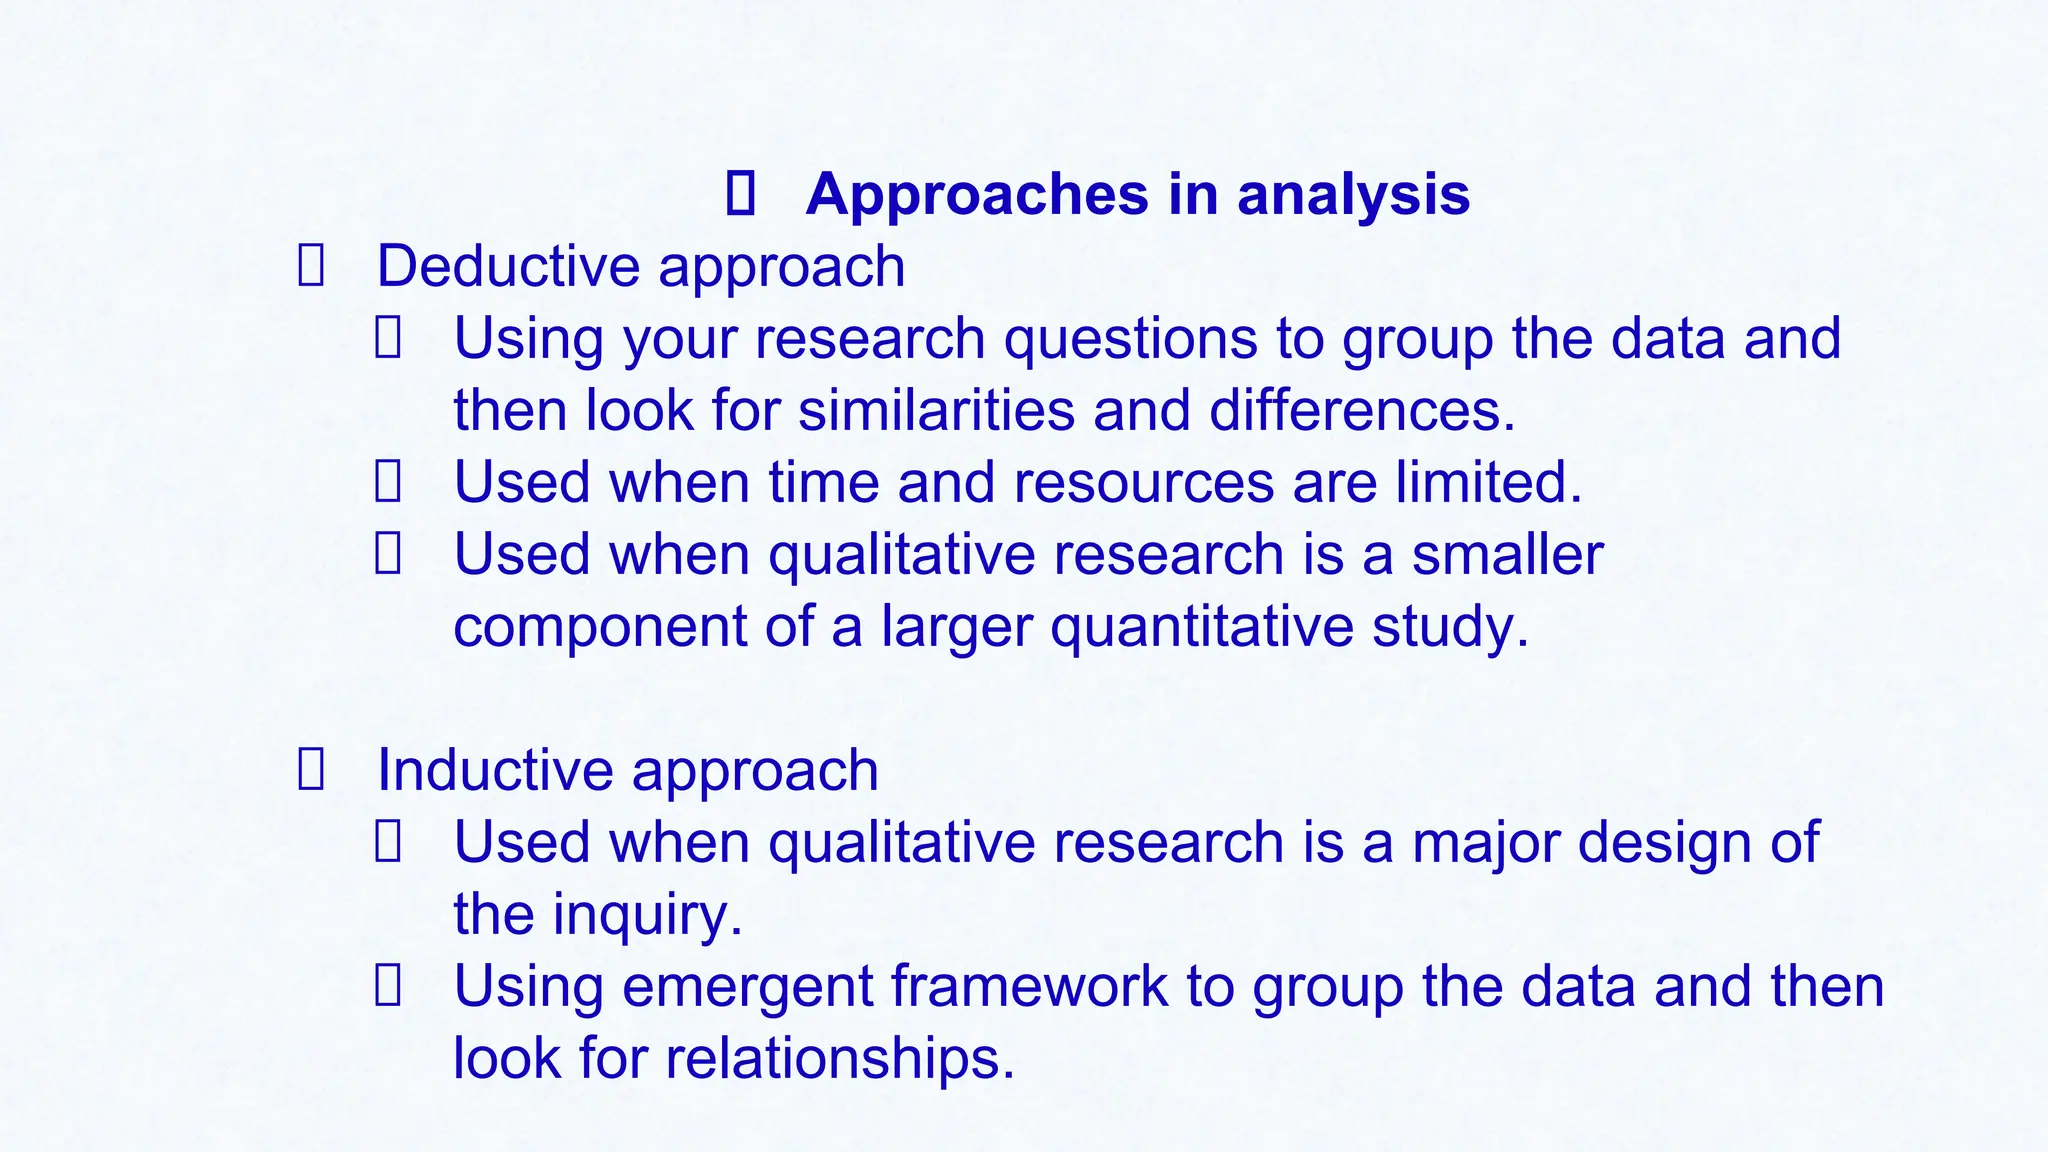
Approaches in analysis
Deductiveapproach
Using your research questions to group the data and
then look for similarities and differences.
Used when time and resources are limited.
Used when qualitative research is a smaller
component of a larger quantitative study.
Inductive approach
Used when qualitative research is a major design of
the inquiry.
Using emergent framework to group the data and then
look for relationships.
56.
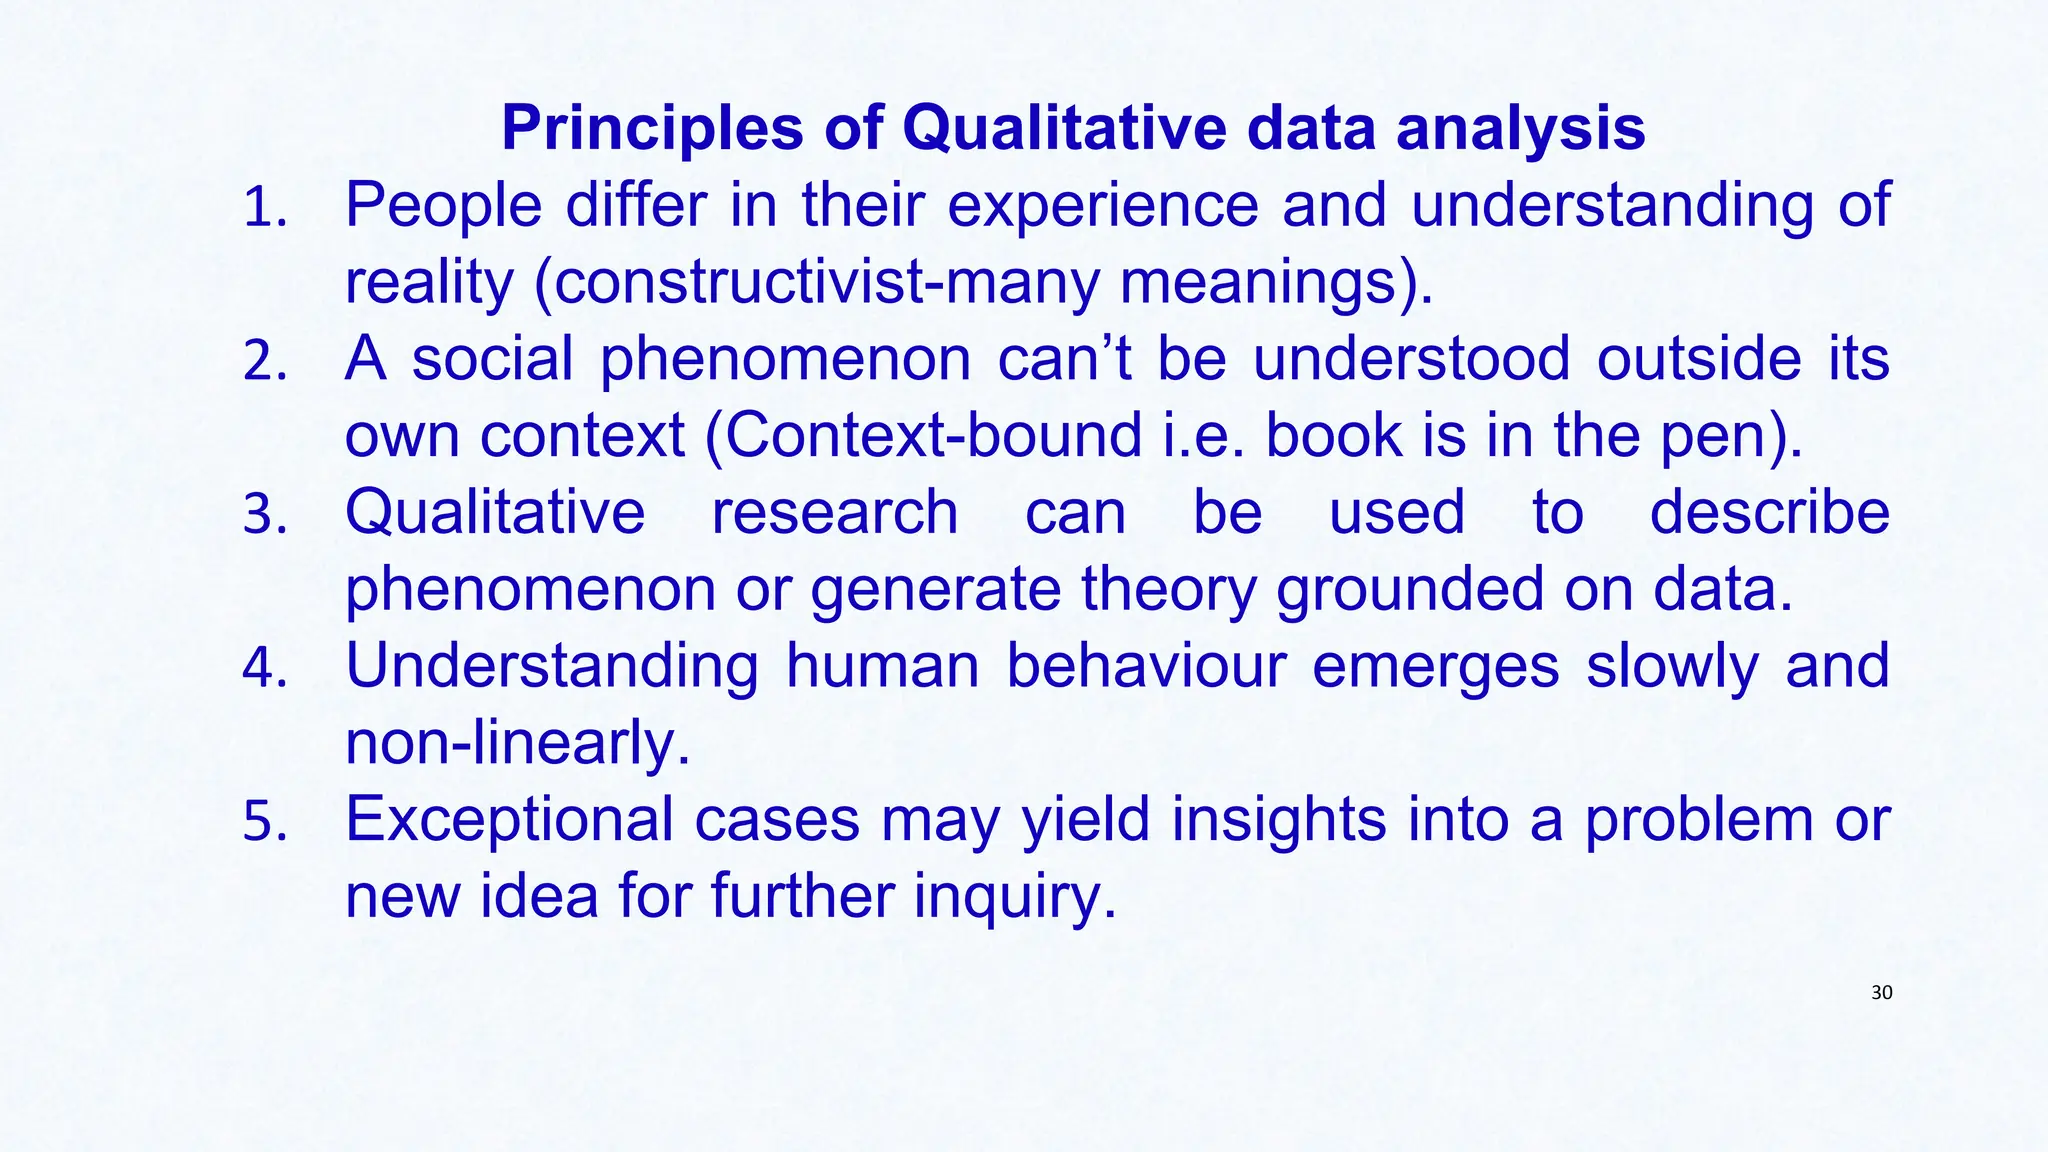
Principles of Qualitativedata analysis
1. People differ in their experience and understanding of
reality (constructivist-many meanings).
2. A social phenomenon can’t be understood outside its
own context (Context-bound i.e. book is in the pen).
3. Qualitative research can be used to describe
phenomenon or generate theory grounded on data.
4. Understanding human behaviour emerges slowly and
non-linearly.
5. Exceptional cases may yield insights into a problem or
new idea for further inquiry.
30
57.
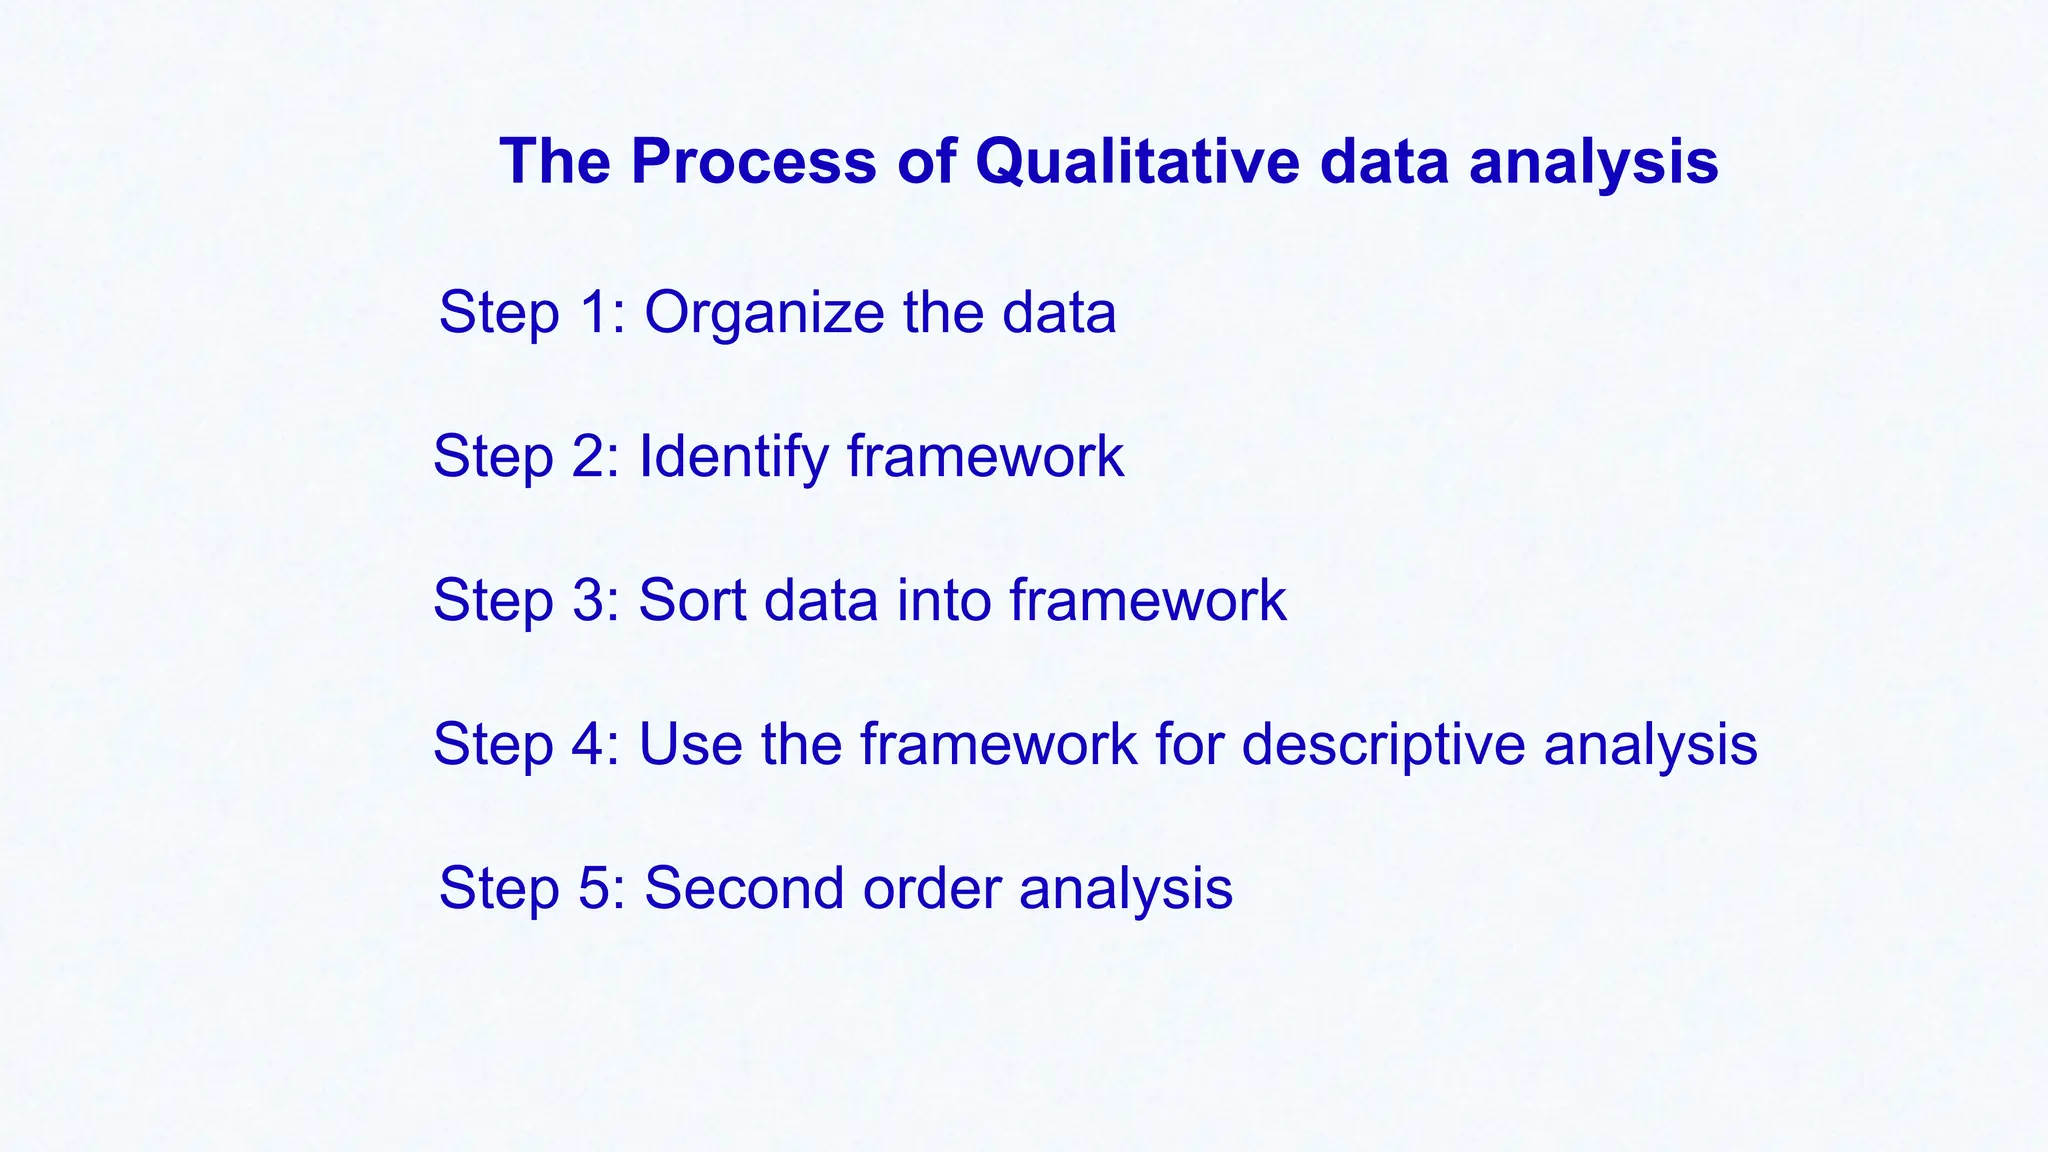
The Process ofQualitative data analysis
Step 1: Organize the data
Step 2: Identify framework
Step 3: Sort data into framework
Step 4: Use the framework for descriptive analysis
Step 5: Second order analysis
58.
Step 1: Organizethe data
Transcribe the data
Translate the data
Data cleaning
Label the data
Structuring
Familiarizing
59.
Step 2: Identifya Framework
•Read, Read, Read...
Identify a Framework
- Explanatory –Guided by the research question
- Exploratory-Guided by the data
Framework will structure, label and define data
60.
Step 3: Sortdata into Framework
Code the data
Modify the Framework
Data entry if use computer packages
36
61.
Step 4: UseFramework in descriptive analysis
Descriptive analysis
- Range of responses in categories
- Identify recurrent themes
Stop here if exploratory research
62.
Step 5: Secondorder analysis
Identify recurrent themes
Notice patterns in the data
- Identify respondent clusters Search for causality
- Identify related themes
Build sequence of events
Search data to answer research questions
Develop hypothesis and test
63.
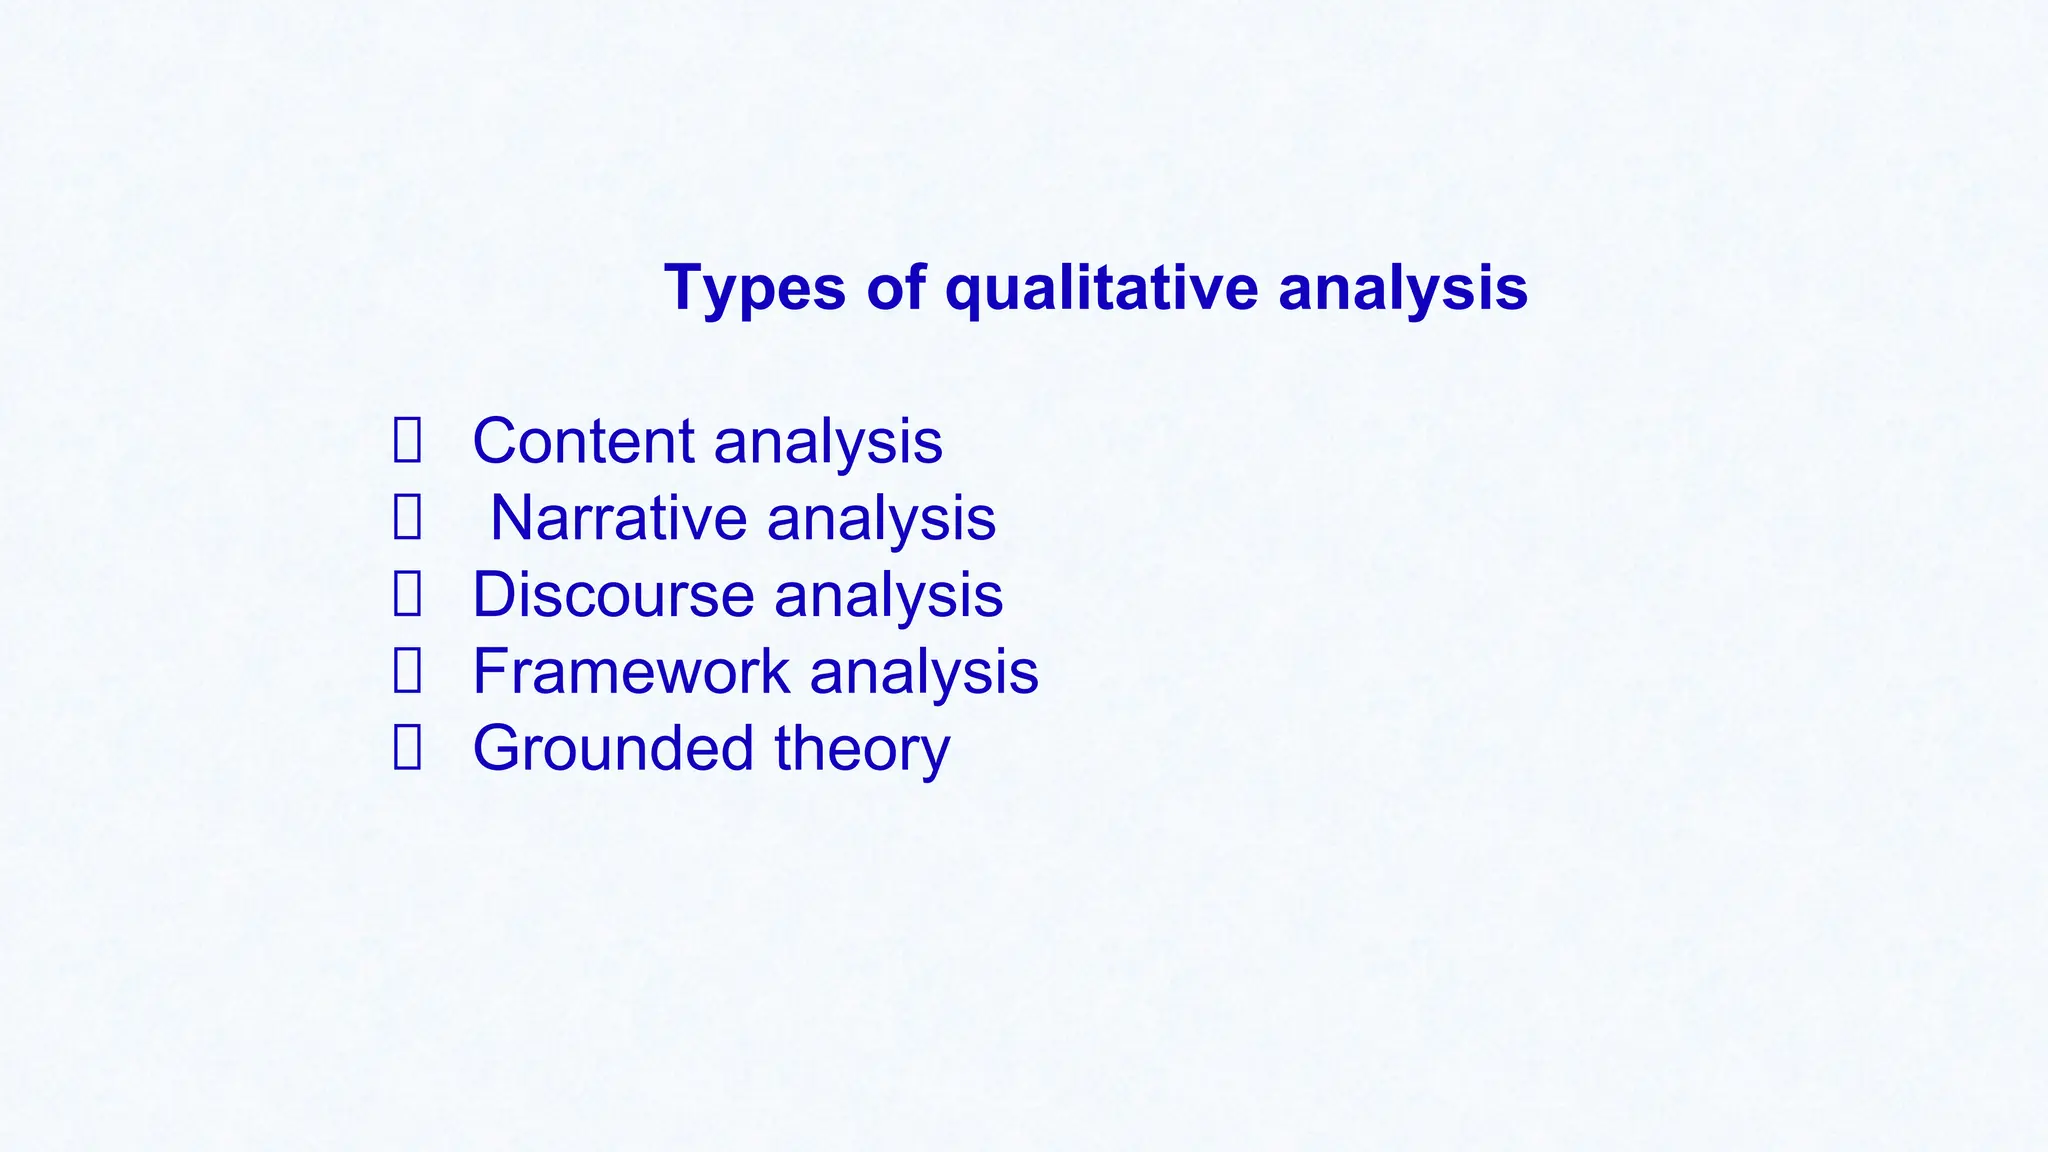
Types of qualitativeanalysis
Content analysis
Narrative analysis
Discourse analysis
Framework analysis
Grounded theory
64.
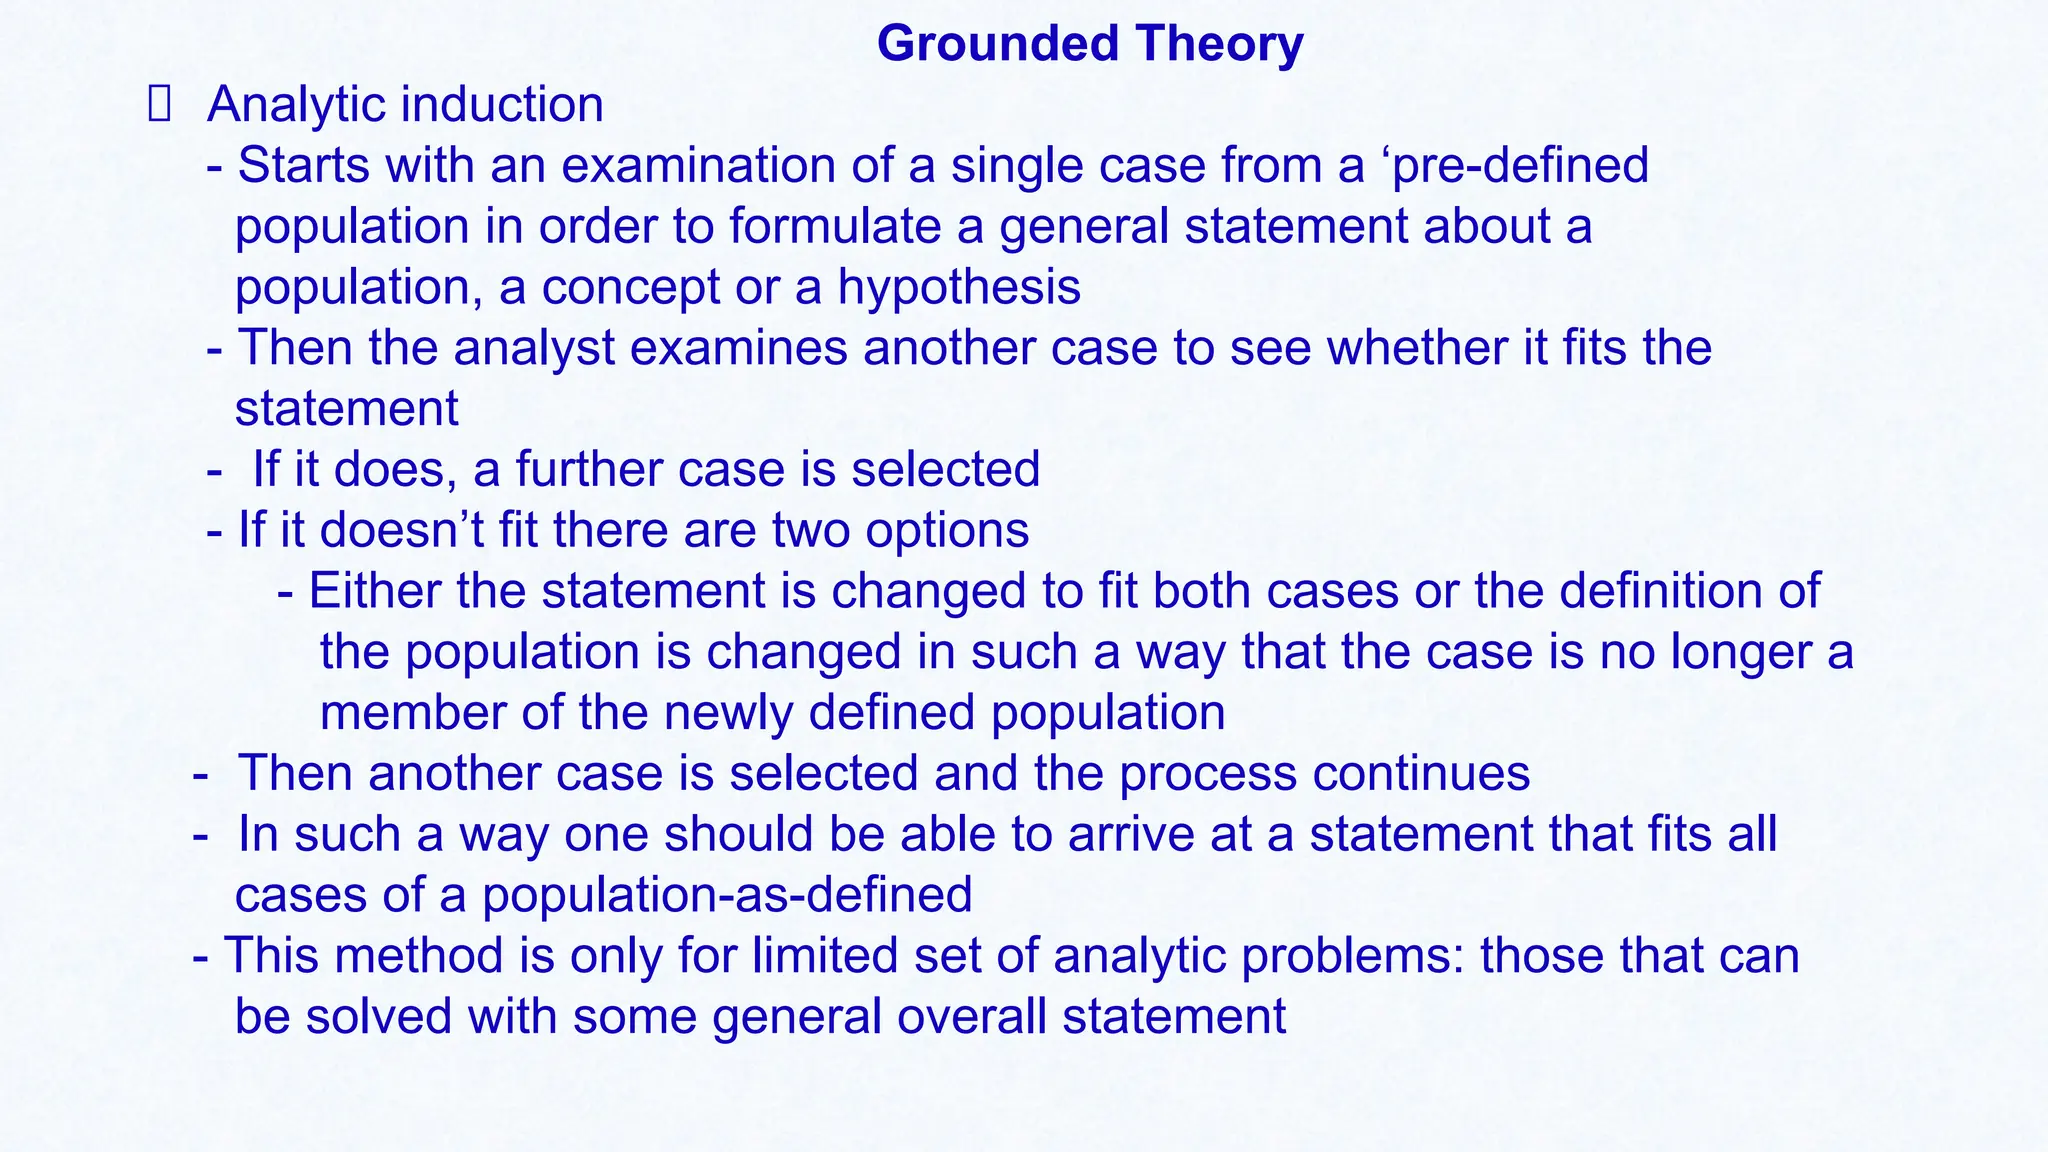
Grounded Theory
Analytic induction
-Starts with an examination of a single case from a ‘pre-defined
population in order to formulate a general statement about a
population, a concept or a hypothesis
- Then the analyst examines another case to see whether it fits the
statement
- If it does, a further case is selected
- If it doesn’t fit there are two options
- Either the statement is changed to fit both cases or the definition of
the population is changed in such a way that the case is no longer a
member of the newly defined population
- Then another case is selected and the process continues
- In such a way one should be able to arrive at a statement that fits all
cases of a population-as-defined
- This method is only for limited set of analytic problems: those that can
be solved with some general overall statement