SlideShare a Scribd company logo
Logistics
                                                                                           Management Meet Note | Logistics
                                                                                                                     June 23, 2010


 Container Corporation of India                                                         REDUCE
                                                                                        CMP                                Rs1,306
 Margins to drag                                                                        Target Price                       Rs1,194
 Key Takeaways                                                                          Investment Period             12 Months
 Export revival yet to happen: Export volumes continue to remain lacklustre in turn     Stock Info
 driving empty running. For first two months of FY2011, the company recorded
                                                                                        Sector                               Logistics
 147,000TEU of exports as against 181,000TEU of imports leading to 18.5% empty
 running. Going ahead, export growth rates may be further impacted by the uncertain     Market Cap (Rs cr)                   16,977

 outlook in Europe. Pertinently, management indicated that the government's ban         Beta                                      0.4
 on export of non-basmati rice has impacted volumes to a large extent.                  52 Week High / Low                 1,500/907
 Volume guidance: Container Corporation of India (Concor) has guided modest             Avg. Daily Volume                    14,689
 Exim volume of 10-12% in FY2011E largely on account of the low base in 1HFY2010
                                                                                        Face Value (Rs)                            10
 and higher imports. Concor registered 9-10% yoy growth in Exim volume for the
                                                                                        BSE Sensex                           17,756
 first two months of FY2011 in spite of the 21% yoy growth at major ports. The
 company has guided 12-15% growth in domestic volumes with increased focus              Nifty                                  5,223
 and strong revival in domestic consumption. Thus, it indicated that the share of       Reuters Code                        CCRI.BO
 domestic volumes would increase to 25% by FY2012E from current levels of 22%.          Bloomberg Code                      CCRI@IN
 Expects hike in haulage charges: Management stated that talks about Indian
 Railways (IR) increasing haulage charges on certain routes could come through in       Shareholding Pattern (%)
 the near term. The recent hike in petroleum products has also led to increase in       Promoters                               63.1
 road freight rates. Management believes that it should be able to pass on any
                                                                                        MF / Banks / Indian FIIs                10.1
 further increase in haulage charges, in absolute terms. However, we believe that
 any increase in haulage charges will be detrimental for Concor volumes. Further, if    FII / NRIs / OCBs                       25.7
 the haulage rates are increased in absolute terms it would impact margins.             Indian Public / Others                    1.1

 Margin pressure to persist: FY2010 OPM fell by 80bp yoy to 26.4% on lower
 ground rent revenues, the company’s inability to pass on the entire hike in haulage    Abs. (%)             3m      1yr         3yr
 charges and rebates which pulled down Exim performance. Management has                 Sensex               1.7    24.0        22.7
 indicated OPMs to remain range bound in FY2011E. However, we estimate 50bp             Concor               3.0    38.9        19.3
 decline in OPM in FY2011E on account of increased contribution from the
 low-margin domestic business and higher empties in 1HFY2011E.

Key Financials (Consolidated)
 Y/E March (Rs cr)              FY2009           FY2010           FY2011E   FY2012E
 Net Sales                         3,452           3,702            4,130     4,714
 % chg                               2.6              7.2            11.6      14.1
 Net Profit
     Profit                         779              779             842       944
 % chg                               6.1            (0.1)             8.2      12.1
 FDEPS (Rs)                         59.9            59.9             64.8      72.6
 EBITDA Margin (%)                  26.8            26.4             25.8      25.1
 P/E (x)                            21.8            21.8             20.2      18.0
                                                                                       Param Desai
 RoE (%)                            22.6            19.4             18.4      18.1
                                                                                       +91 22 4040 3800 Ext: 310
 RoCE (%)                           18.9            17.4             17.0      17.0
                                                                                       Email: paramv.desai@angeltrade.com
 P/BV (x)                            4.9             4.2              3.7       3.3
                                                                                       Mihir Salot
 EV/Sales (x)                        4.4             4.1              3.6       3.1
                                                                                       +91 22 4040 3800 Ext: 307
 EV/EBITDA (x)                      16.5            15.4             13.9      12.2
                                                                                       Email:mihirr.salot@angeltrade.com
 Source: Company, Angel Research


Please refer to important disclosures at the end of this report
Container Corporation of India| Management Meet Note


Exhibit 1: Domestic Volume Growth Trend                                                                 Exhibit 2: EXIM Volume Growth Trend
            800                                                                           25.0                      2,500                                                                 20.0

            700                    20.7                                                   20.0                                           15.3                                             15.0
                                                            18.9                                                    2,000
            600
                                                                                          15.0                                 10.2                                                   9.9 10.0
            500                                                                    14.0                                                                                    9.9


                                                                                                        '000 TEUs
                                                                                                                    1,500
'000 TEUs


                                                                       12.0


                                                                                                                                                                                                   (%)
                                                                                                  (%)
            400                                                                           10.0                                                                                            5.0
                                                                                                                    1,000                                      1.5
            300
                                                                                          5.0                                                                                             0.0
                         4.2
            200
                                                                                                                     500
                                                                                          0.0                                                                                             (5.0)
            100                                                                                                                                     (6.2)
                                                 (3.6)
             0                                                                            (5.0)                        0                                                                  (10.0)
                  FY07         FY08       FY09           FY10      FY11E      FY12E                                         FY07      FY08      FY09        FY10      FY11E      FY12E
                           Domestic Containers (LHS)            yoy change (RHS)                                                   Exim Containers (LHS)           yoy change (RHS)
  Source: Company, Angel Research                                                                       Source: Company, Angel Research


                                                                           FY2010 performance hit by lower other income and ground rent

                                                                           Concor had healthy cash balance of Rs2,000cr as on March 2010. For FY2010, the
                                                                           company reported a 23.5% yoy dip in other income to Rs162cr primarily due to lower
                                                                           interest income. Management indicated that it was mandated to divert its funds to
                                                                           certain nominated investments with a low yield of around 6%, which resulted lower
                                                                           other income. Going ahead too, management stated that other income would continue
                                                                           to register similar yield as in FY2010. Ground rent revenue also fell by Rs Rs200/TEU
                                                                           in FY2010 resulting in lower overall ground rent income of Rs246cr (Rs273cr). The
                                                                           higher ground rent in FY2009 was an aberration as importers were avoiding taking
                                                                           delivery of goods owing to recession. Consequently, Concor reported flat net income
                                                                           in FY2010.

                                                                           Deteriorating Exim market share remains a concern

                                                                           Concor is in a commanding position owing to its mammoth infrastructure - 237 rakes
                                                                           and 60 terminals - built over 20 years. The company plans to add another 40-45
                                                                           rakes and four terminals over FY2010-12E. Currently, Concor is the preferred
                                                                           transporter via Rail among the shipping lines on account of being the lowest-cost
                                                                           service provider in the segment and due to the strategic location of its container depots.
                                                                           However, during FY2006-10, Concor conceded market share by 620bp to 27.4%
                                                                           from its peak of 33.7% to the Road segment and private players. In FY2007, Concor
                                                                           was impacted by higher IR tariffs and opening up of Rail containerisation to the private
                                                                           players. Over the next four-five years too, we expect Concor to record further drop in
                                                                           market share to around 25% on the back of higher haulage charges, which would
                                                                           render it uncompetitive in the FEU segment, and the private players would gradually
                                                                           increase their presence.


June 23, 2010                                                                                                                                                                                      2
Container Corporation of India | Management Meet Note


Exhibit 3: Declining Exim Market share3:                                                                           Exhibit 4: Declining Operating Margins
                                                                                                                         35
            9,000                                                                              36.0
                              33.7
            8,000   32.5
                                       31.0                                                    33.0                                    31.5
            7,000                                                                                                        32
                                               29.5
                                                                                               30.0
            6,000                                         28.2                                                                                                               29.1
                                                                    27.8                                                                                   28.7
'000 TEUs


            5,000                                                                              27.0                      29


                                                                                                         (%)
                                                                                                                                                                                                                27.2


                                                                                                                   (%)
            4,000                                                                                                                                                                              26.6                              26.4
                                                                        25.0                   24.0                                                                                                                                                 25.8
            3,000                                                                                                        26                                                                                                                                           25.1
                                                                                               21.0
            2,000
                                                                                               18.0                      23
            1,000
               0                                                                               15.0
                    FY05      FY06    FY07     FY08    FY09      FY10    FY12E                                           20
                           Domestic Containers (LHS)          yoy change (RHS)                                                         FY05                FY06             FY07               FY08             FY09             FY10             FY11E             FY12E
 Source: Company, Angel Research                                                                                    Source: Company, Angel Research


                                                                  Outlook and Valuation

                                                                  Concor is gradually losing its pricing power in the Exim Segment, which could be a
                                                                  further threat once more Rail-linked ICDs from the private players come up. However,
                                                                  we remain bullish on the Container sector in the long term, which is the core driver of
                                                                  Concor's business. Nonetheless, higher IR tariffs and opening up of the Container
                                                                  industry to the private players will impact the company's market share in the long run.
                                                                  We also believe that the company's growth trajectory will be lower than its historical
                                                                  trend. Thus, key risk to our recommendation will be Concor maintaining its market
                                                                  share and accelerated construction of the dedicated Rail-freight corridor, which could
                                                                  help it wrest market share from the Road segment.

                                                                  We estimate Concor to post muted Earnings CAGR of 10.1% over FY2010-12E, as
                                                                  against the 17.6% CAGR registered during FY2005-09. At the current market price,
                                                                  the stock is trading at 18.0x FY2012E Earnings and at 12.2x FY2012E EV/EBITDA.
                                                                  We maintain our Reduce rating on stock, with a Target Price of Rs1,194.
                                                                                                                 Target Price

                                                                  Exhibit 5: One Year Forward P/E
                                                                        25


                                                                        20
                                                                                                                                                                                                      Trading at premium to
                                                                                                                                                                                                      its five yr average
                                                                        15
                                                                  (x)


                                                                        10


                                                                         5


                                                                         0
                                                                             Jun-05

                                                                                      Sep-05

                                                                                                Dec-05


                                                                                                                                                                                                                              Mar-09

                                                                                                                                                                                                                                        Jun-09

                                                                                                                                                                                                                                                 Sep-09

                                                                                                                                                                                                                                                           Dec-09
                                                                                                          Mar-06

                                                                                                                    Jun-06

                                                                                                                              Sep-06

                                                                                                                                         Dec-06


                                                                                                                                                                                          Mar-08

                                                                                                                                                                                                   Jun-08

                                                                                                                                                                                                            Sep-08

                                                                                                                                                                                                                     Dec-08
                                                                                                                                                  Mar-07

                                                                                                                                                              Jun-07

                                                                                                                                                                        Sep-07

                                                                                                                                                                                 Dec-07


                                                                                                                                                                                                                                                                    Mar-10

                                                                                                                                                                                                                                                                             Jun-10


                                                                                                                                                                       P/E                Average

                                                                  Source: Bloomberg, Angel Research


June 23, 2010                                                                                                                                                                                                                                                                   3
Container Corporation of India| Management Meet Note


                Profit & Loss Statement (Consolidated)                                    Rs crore
                Y/E March                         FY2008    FY2009    FY2010    FY2011E   FY2012E

                Gross sales                        3,364     3,452     3,702      4,130     4,714
                Less: Excise duty                       -         -         -         -         -
                Net Sales                          3,364     3,452     3,702      4,130     4,714
                Other operating income                  -         -         -         -         -
                Total operating income             3,364     3,452     3,702      4,130     4,714
                % chg                                9.8       2.6       7.2       11.6      14.1
                Total Expenditure                  2,487     2,526     2,726      3,065     3,530
                Terminal & other Service Charges 2,320       2,286     2,462      2,755     3,158
                Other Expenses                      111       157       185        223       273
                Personnel                             56        83        79        87        99
                Other                                   -         -         -         -         -
                EBITDA
                EBITDA                              876       927       976       1,066     1,183
                % chg                               (1.6)      5.8       5.3        9.1      11.0
                (% of Net Sales)                    26.1      26.8      26.4       25.8      25.1
                Depreciation& Amortisation         108.6     119.5     134.3      144.9     148.4
                EBIT                                768       807       842        921      1,035
                % chg                               (3.7)      5.1       4.3        9.3      12.4
                (% of Net Sales)                    22.8      23.4      22.7       22.3      22.0
                Interest & other Charges               3         4          -         -         -
                Other Income                        165       211       162        166       183
                (% of PBT)                          17.8      20.8      16.1       15.3      15.0
                Recurring PBT                       930      1,014     1,004      1,087     1,218
                % chg                                5.5       9.0      (1.0)       8.3      12.1
                Extraordinary Expense/(Inc.)            -         -         -         -         -
                PBT (reported)                      930      1,014     1,004      1,087     1,218
                Tax                                 198       235       225        245       274
                (% of PBT)                          21.3      23.1      22.4       22.5      22.5
                PAT (reported)                      732       779       779        842       944
                Tax Adjustments of prior period      1.9      (0.5)         -         -         -
                Minority Interest                       -         -         -         -         -
                Prior period items                  (0.2)      0.2          -         -         -
                PAT after MI (reported)             732       779       779        842       944
                ADJ. PAT
                ADJ. PA                             734       779       779        842       944
                % chg                                4.3       6.1      (0.1)       8.2      12.1
                (% of Net Sales)                    21.8      22.6      21.0       20.4      20.0
                Basic EPS (Rs)                      56.5      59.9      59.9       64.8      72.6
                Fully Diluted EPS (Rs)              56.5      59.9      59.9       64.8      72.6
                % chg                                4.3       6.1      (0.1)       8.2      12.1


June 23, 2010                                                                                       4
Container Corporation of India | Management Meet Note


                Balance Sheet (Consolidated)                                            Rs crore
                Y/E March                          FY2008   FY2009   FY2010   FY2011E   FY2012E

                SOURCES OF FUNDS
                Equity Share Capital                 130      130      130       130       130
                Preference Capital                      -        -        -         -         -
                Reserves& Surplus                   3,036    3,602    4,159     4,753     5,423
                             Funds
                Shareholders Funds                  3,166    3,732    4,289     4,883     5,553
                Minority Interest                       -        -        -         -         -
                Total Loans                           50       49       49        49        49
                Deferred Tax Liability               174      194      194       194       194
                Total Liabilities                   3,390    3,974    4,531     5,126     5,796

                APPLICATION OF FUNDS
                APPLICATION
                Gross Block                         2,327    2,722    3,122     3,622     4,122
                Less: Acc. Depreciation              581      698      832       977      1,125
                Net Block                           1,746    2,025    2,290     2,645     2,997
                Capital Work-in-Progress             172      246      246       246       246
                Goodwill                                -        -        -         -         -
                Investments                          120      168      168       168       168
                Current Assets                      1,900    2,159    2,401     2,679     3,046
                  Cash                              1,523    1,767    2,004     2,216     2,550
                  Loans & Advances                   282      276      292       342       381
                  Other                               95      116      105       121       115
                Current liabilities & Provisions     549      623      573       612       661
                Net Current Assets                  1,351    1,536    1,827     2,067     2,385
                Mis. Exp. not written off              0        0        0         0         0
                Total Assets                        3,390    3,974    4,531     5,126     5,796


June 23, 2010                                                                                     5
Container Corporation of India| Management Meet Note


                Cash Flow Statement (Consolidated)                                         Rs crore
                Y/E March                        FY2008      FY2009    FY2010    FY2011E   FY2012E

                Profit before tax                     930     1,014     1,004      1,087     1,218
                Depreciation                          109      120       134        145       148
                Change in Working Capital             (14)       39       (43)      (40)        3
                Less: Other Adjustments              (136)    (175)          -         -         -
                Direct taxes paid                    (191)    (204)     (225)      (245)     (274)
                Cash Flow from Operations             697      793       870        947      1,095
                (Inc.)/ Dec. in Fixed Assets         (303)    (388)     (400)      (500)     (500)
                (Inc)./ Dec. in Investments           (24)      (48)         -         -         -
                (Inc)./ Dec. in loans and advances     85       (74)         -         -         -
                Other income                          139      172           -         -         -
                Cash Flow from Investing             (102)    (338)     (400)      (500)     (500)
                Issue of Equity                          -         -         -         -         -
                Inc./(Dec). in loans                   20        (2)         -         -         -
                Dividend Paid (Incl. Tax)            (167)    (205)     (232)      (235)     (261)
                Others                                 (3)       (4)         -         -         -
                               Financing
                Cash Flow from Financing             (150)    (211)     (232)      (235)     (261)
                Inc./(Dec.) in Cash                   445      244       237        212       334
                Opening Cash balances                1,078    1,523     1,767      2,004     2,216
                Closing Cash balances                1,523    1,767     2,004      2,216     2,550


June 23, 2010                                                                                        6
Container Corporation of India | Management Meet Note


                Key Ratios
                Y/E March                         FY2008      FY2009    FY2010    FY2011E    FY2012E

                Valuation Ratio (x)
                P/E (on FDEPS)                        23.1      21.8      21.8       20.2       18.0
                P/CEPS                                19.9      18.5      18.6       17.2       15.5
                P/BV                                   5.9       4.9       4.2        3.7        3.3
                Dividend yield (%)                     5.4       4.5       4.0        3.5        3.1
                EV/Sales                               4.6       4.4       4.1        3.6        3.1
                EV/EBITDA                             17.7      16.5      15.4       13.9       12.2
                EV / Total Assets                      3.9       3.3       2.9        2.6        2.2
                Per Share Data (Rs)
                EPS (Basic)                           56.5      59.9      59.9       64.8       72.6
                EPS (fully diluted)                   56.5      59.9      59.9       64.8       72.6
                Cash EPS                              65.7      70.7      70.2       75.9       84.0
                DPS                                   13.0      14.0      17.0       19.0       21.0
                Book Value                          243.5      287.1     330.0      375.7      427.2
                Dupont Analysis
                EBIT margin                           22.8      23.4      22.7       22.3       22.0
                Tax retention ratio                    0.8       0.8       0.8        0.8        0.8
                Asset turnover (x)                     1.5       1.3       1.2        1.2        1.3
                ROIC (Post-tax)                       26.1      23.7      22.0       21.5       21.6
                Cost of Debt (Post Tax)                0.0       0.1          -          -          -
                Operating ROE                         26.1      23.7      22.0       21.5       21.6
                Returns (%)
                ROCE (Pre-tax)                        21.2      18.9      17.4       17.0       17.0
                Angel ROIC (Pre-tax)                  36.6      33.4      31.0       30.0       29.8
                ROE                                   25.3      22.6      19.4       18.4       18.1
                Turnover ratios (x)
                Asset Turnover (Gross Block)           1.5       1.4       1.3        1.2        1.2
                Inventory / Sales (days)                 1         2         2          2          2
                Receivables (days)                       1         2         2          2          2
                Payables (days)                         59        66        62         54         50
                Working capital cycle (ex-cash) (days) (18)     (21)       (20)      (14)       (12)
                Solvency ratios (x)
                Net debt to equity                    (0.5)     (0.5)     (0.5)      (0.4)      (0.5)
                Net debt to EBITDA                    (1.7)     (1.9)     (2.0)      (2.0)      (2.1)
                Interest Coverage (EBIT / Interest) 301.1      191.3       NA         NA         NA


June 23, 2010                                                                                           7
Container Corporation of India


Disclaimer
This document is solely for the personal information of the recipient, and must not be singularly used as the basis of any investment
decision. Nothing in this document should be construed as investment or financial advice. Each recipient of this document should make
such investigations as they deem necessary to arrive at an independent evaluation of an investment in the securities of the companies
referred to in this document (including the merits and risks involved), and should consult their own advisors to determine the merits and
risks of such an investment.

Angel Securities Limited, its affiliates, directors, its proprietary trading and investment businesses may, from time to time, make investment
decisions that are inconsistent with or contradictory to the recommendations expressed herein. The views contained in this document are
those of the analyst, and the company may or may not subscribe to all the views expressed within.

Reports based on technical and derivative analysis center on studying charts of a stock's price movement, outstanding positions and trading
volume, as opposed to focusing on a company's fundamentals and, as such, may not match with a report on a company's fundamentals.

The information in this document has been printed on the basis of publicly available information, internal data and other reliable sources
believed to be true, and is for general guidance only. Angel Securities Limited has not independently verified all the information contained
within this document. Accordingly, we cannot testify, nor make any representation or warranty, express or implied, to the accuracy, contents
or data contained within this document. While Angel Securities Limited endeavours to update on a reasonable basis the information
discussed in this material, there may be regulatory, compliance, or other reasons that prevent us from doing so.

This document is being supplied to you solely for your information, and its contents, information or data may not be reproduced, redistributed
or passed on, directly or indirectly.

Angel Securities Limited and its affiliates may seek to provide or have engaged in providing corporate finance, investment banking or other
advisory services in a merger or specific transaction to the companies referred to in this report, as on the date of this report or in the past.

Neither Angel Securities Limited, nor its directors, employees or affiliates shall be liable for any loss or damage that may arise from or in
connection with the use of this information.

Note: Please refer to the important `Stock Holding Disclosure' report on the Angel website (Research Section).


  Disclosure of Interest Statement                                     Container Corporation of India
  1. Analyst ownership of the stock                                                 No
  2. Angel and its Group companies ownership of the stock                           No
  3. Angel and its Group companies' Directors ownership of the stock                No
  4. Broking relationship with company covered                                      No

 Note: We have not considered any Exposure below Rs 1 lakh for Angel, its Group companies and Directors.


  Ratings (Returns) :             Buy (> 15%)                              Accumulate (5% to 15%)                      Neutral (-5 to 5%)
                                  Reduce (-5% to -15%)                     Sell (< -15%)
Container Corporation of India


               Address: Acme Plaza, ‘A’ Wing, 3rd Floor, M.V. Road, Opp. Sangam Cinema, Andheri (E), Mumbai - 400 059.
                                                        Tel : (022) 3952 4568 / 4040 3800


Research Team
Fundamental:
Sarabjit Kour Nangra                                                                               VP-Research, Pharmaceutical                                                            sarabjit@angeltrade.com
Vaibhav Agrawal                                                                                    VP-Research, Banking                                                                   vaibhav.agrawal@angeltrade.com
Vaishali Jajoo                                                                                     Automobile                                                                             vaishali.jajoo@angeltrade.com
Shailesh Kanani                                                                                    Infrastructure, Real Estate                                                            shailesh.kanani@angeltrade.com
Anand Shah                                                                                         FMCG , Media                                                                           anand.shah@angeltrade.com
Deepak Pareek                                                                                      Oil & Gas                                                                              deepak.pareek@angeltrade.com
Puneet Bambha                                                                                      Capital Goods, Engineering                                                             puneet.bambha@angeltrade.com
Sushant Dalmia                                                                                     Pharmaceutical                                                                         sushant.dalmia@angeltrade.com
Rupesh Sankhe                                                                                      Cement, Power                                                                          rupeshd.sankhe@angeltrade.com
Param Desai                                                                                        Real Estate, Logistics, Shipping                                                       paramv.desai@angeltrade.com
Sageraj Bariya                                                                                     Fertiliser, Mid-cap                                                                    sageraj.bariya@angeltrade.com
Viraj Nadkarni                                                                                     Retail, Hotels, Mid-cap                                                                virajm.nadkarni@angeltrade.com
Paresh Jain                                                                                        Metals & Mining                                                                        pareshn.jain@angeltrade.com
Amit Rane                                                                                          Banking                                                                                amitn.rane@angeltrade.com
Rahul Jain                                                                                         IT, Telecom                                                                            rahul.j@angeltrade.com
Jai Sharda                                                                                         Mid-cap                                                                                jai.sharda@angeltrade.com
Sharan Lillaney                                                                                    Mid-cap                                                                                sharanb.lillaney@angeltrade.com

Amit Vora                                                                                          Research Associate (Oil & Gas)                                                         amit.vora@angeltrade.com
V Srinivasan                                                                                       Research Associate (Cement, Power)                                                     v.srinivasan@angeltrade.com
Aniruddha Mate                                                                                     Research Associate (Infra, Real Estate)                                                aniruddha.mate@angeltrade.com
Mihir Salot                                                                                        Research Associate (Logistics, Shipping)                                               mihirr.salot@angeltrade.com
Chitrangda Kapur                                                                                   Research Associate (FMCG, Media)                                                       chitrangdar.kapur@angeltrade.com
Vibha Salvi                                                                                        Research Associate (IT, Telecom)                                                       vibhas.salvi@angeltrade.com
Pooja Jain                                                                                         Research Associate (Metals & Mining)                                                   pooja.j@angeltrade.com

Technicals:
Shardul Kulkarni                                                                                   Sr. Technical Analyst                                                                  shardul.kulkarni@angeltrade.com
Mileen Vasudeo                                                                                     Technical Analyst                                                                      vasudeo.kamalakant@angeltrade.com
Derivatives:
Siddarth Bhamre                                                                                    Head - Derivatives                                                                     siddarth.bhamre@angeltrade.com
Jaya Agarwal                                                                                       Derivative Analyst                                                                     jaya.agarwal@angeltrade.com


Institutional Sales Team:
Mayuresh Joshi                                                                                     VP - Institutional Sales                                                               mayuresh.joshi@angeltrade.com
Abhimanyu Sofat                                                                                    AVP - Institutional Sales                                                              abhimanyu.sofat@angeltrade.com
Nitesh Jalan                                                                                       Sr. Manager                                                                            niteshk.jalan@angeltrade.com
Pranav Modi                                                                                        Sr. Manager                                                                            pranavs.modi@angeltrade.com
Sandeep Jangir                                                                                     Sr. Manager                                                                            sandeepp.jangir@angeltrade.com
Ganesh Iyer                                                                                        Sr. Manager                                                                            ganeshb.Iyer@angeltrade.com
Jay Harsora                                                                                        Sr. Dealer                                                                             jayr.harsora@angeltrade.com
Meenakshi Chavan                                                                                   Dealer                                                                                 meenakshis.chavan@angeltrade.com
Gaurang Tisani                                                                                     Dealer                                                                                 gaurangp.tisani@angeltrade.com


Production Team:
Bharathi Shetty                                                                                    Research Editor                                                                        bharathi.shetty@angeltrade.com
Bharat Patil                                                                                       Production                                                                             bharat.patil@angeltrade.com
Dilip Patel                                                                                        Production                                                                             dilipm.patel@angeltrade.com


Angel Broking Ltd: BSE Sebi Regn No : INB 010996539 / CDSL Regn No: IN - DP - CDSL - 234 - 2004 / PMS Regn Code: PM/INP000001546 Angel Securities Ltd:BSE: INB010994639/INF010994639 NSE: INB230994635/INF230994635 Membership numbers: BSE 028/NSE:09946
Angel Capital & Debt Market Ltd: INB 231279838 / NSE FNO: INF 231279838 / NSE Member code -12798 Angel Commodities Broking (P) Ltd: MCX Member ID: 12685 / FMC Regn No: MCX / TCM / CORP / 0037 NCDEX : Member ID 00220 / FMC Regn No: NCDEX / TCM / CORP / 0302

More Related Content

What's hot

Asian Paints
Asian PaintsAsian Paints
Asian Paints
Angel Broking
 
RIL Result Update
RIL Result UpdateRIL Result Update
RIL Result Update
Angel Broking
 
Asian paints ru4 qfy2010-280510
Asian paints ru4 qfy2010-280510Asian paints ru4 qfy2010-280510
Asian paints ru4 qfy2010-280510
Angel Broking
 
Rallis India - RU2QFY2011
Rallis India - RU2QFY2011Rallis India - RU2QFY2011
Rallis India - RU2QFY2011
Angel Broking
 
Shoppers stop result update 4 qfy2010 040510
Shoppers stop result update 4 qfy2010 040510Shoppers stop result update 4 qfy2010 040510
Shoppers stop result update 4 qfy2010 040510
Angel Broking
 
Cccl ru4 qfy2010-100510
Cccl  ru4 qfy2010-100510Cccl  ru4 qfy2010-100510
Cccl ru4 qfy2010-100510
Angel Broking
 
Concor ru2 qfy2011-201010
Concor ru2 qfy2011-201010Concor ru2 qfy2011-201010
Concor ru2 qfy2011-201010
Angel Broking
 
Marico Result Update
Marico Result UpdateMarico Result Update
Marico Result Update
Angel Broking
 
Jyoti structures ru4 qfy2010-240510
Jyoti structures ru4 qfy2010-240510Jyoti structures ru4 qfy2010-240510
Jyoti structures ru4 qfy2010-240510
Angel Broking
 
CCCl
CCClCCCl
Exide
Exide Exide
Tajgvk result update - 290410
Tajgvk  result update - 290410Tajgvk  result update - 290410
Tajgvk result update - 290410
Angel Broking
 
GDL
GDLGDL
Graphite india ru4 qfy2010-140510
Graphite india ru4 qfy2010-140510Graphite india ru4 qfy2010-140510
Graphite india ru4 qfy2010-140510
Angel Broking
 
Igl ru4 qfy2010-260510
Igl ru4 qfy2010-260510Igl ru4 qfy2010-260510
Igl ru4 qfy2010-260510
Angel Broking
 
Gammon india ru4 qfy2010-190510
Gammon india ru4 qfy2010-190510Gammon india ru4 qfy2010-190510
Gammon india ru4 qfy2010-190510
Angel Broking
 
Crompton greaves ru4 qfy2010-180510
Crompton greaves ru4 qfy2010-180510Crompton greaves ru4 qfy2010-180510
Crompton greaves ru4 qfy2010-180510
Angel Broking
 
JISL Result Update 4 qfy2010-120510
JISL Result Update 4 qfy2010-120510JISL Result Update 4 qfy2010-120510
JISL Result Update 4 qfy2010-120510
Angel Broking
 
L&t ru4 qfy2010-170510
L&t ru4 qfy2010-170510L&t ru4 qfy2010-170510
L&t ru4 qfy2010-170510
Angel Broking
 

What's hot (19)

Asian Paints
Asian PaintsAsian Paints
Asian Paints
 
RIL Result Update
RIL Result UpdateRIL Result Update
RIL Result Update
 
Asian paints ru4 qfy2010-280510
Asian paints ru4 qfy2010-280510Asian paints ru4 qfy2010-280510
Asian paints ru4 qfy2010-280510
 
Rallis India - RU2QFY2011
Rallis India - RU2QFY2011Rallis India - RU2QFY2011
Rallis India - RU2QFY2011
 
Shoppers stop result update 4 qfy2010 040510
Shoppers stop result update 4 qfy2010 040510Shoppers stop result update 4 qfy2010 040510
Shoppers stop result update 4 qfy2010 040510
 
Cccl ru4 qfy2010-100510
Cccl  ru4 qfy2010-100510Cccl  ru4 qfy2010-100510
Cccl ru4 qfy2010-100510
 
Concor ru2 qfy2011-201010
Concor ru2 qfy2011-201010Concor ru2 qfy2011-201010
Concor ru2 qfy2011-201010
 
Marico Result Update
Marico Result UpdateMarico Result Update
Marico Result Update
 
Jyoti structures ru4 qfy2010-240510
Jyoti structures ru4 qfy2010-240510Jyoti structures ru4 qfy2010-240510
Jyoti structures ru4 qfy2010-240510
 
CCCl
CCClCCCl
CCCl
 
Exide
Exide Exide
Exide
 
Tajgvk result update - 290410
Tajgvk  result update - 290410Tajgvk  result update - 290410
Tajgvk result update - 290410
 
GDL
GDLGDL
GDL
 
Graphite india ru4 qfy2010-140510
Graphite india ru4 qfy2010-140510Graphite india ru4 qfy2010-140510
Graphite india ru4 qfy2010-140510
 
Igl ru4 qfy2010-260510
Igl ru4 qfy2010-260510Igl ru4 qfy2010-260510
Igl ru4 qfy2010-260510
 
Gammon india ru4 qfy2010-190510
Gammon india ru4 qfy2010-190510Gammon india ru4 qfy2010-190510
Gammon india ru4 qfy2010-190510
 
Crompton greaves ru4 qfy2010-180510
Crompton greaves ru4 qfy2010-180510Crompton greaves ru4 qfy2010-180510
Crompton greaves ru4 qfy2010-180510
 
JISL Result Update 4 qfy2010-120510
JISL Result Update 4 qfy2010-120510JISL Result Update 4 qfy2010-120510
JISL Result Update 4 qfy2010-120510
 
L&t ru4 qfy2010-170510
L&t ru4 qfy2010-170510L&t ru4 qfy2010-170510
L&t ru4 qfy2010-170510
 

Similar to Concor management meet note-230610

Nestle ru2 qcy2010-02-08-10
Nestle  ru2 qcy2010-02-08-10Nestle  ru2 qcy2010-02-08-10
Nestle ru2 qcy2010-02-08-10
Angel Broking
 
Hdil ru4 qfy2010-28052010
Hdil ru4 qfy2010-28052010Hdil ru4 qfy2010-28052010
Hdil ru4 qfy2010-28052010
Angel Broking
 
R com ru4-qfy2010-180510
R com ru4-qfy2010-180510R com ru4-qfy2010-180510
R com ru4-qfy2010-180510
Angel Broking
 
Hindalco Novelis
Hindalco Novelis Hindalco Novelis
Hindalco Novelis
Angel Broking
 
Dishman ru4 qfy2010-310510
Dishman ru4 qfy2010-310510Dishman ru4 qfy2010-310510
Dishman ru4 qfy2010-310510
Angel Broking
 
RIL - result Update
RIL - result UpdateRIL - result Update
RIL - result Update
Angel Broking
 
Asian Paints
Asian PaintsAsian Paints
Asian Paints
Angel Broking
 
61107576 rallis-india
61107576 rallis-india61107576 rallis-india
61107576 rallis-india
jeetay
 
Ashok leyland ru4 qfy2010-300410
Ashok leyland ru4 qfy2010-300410Ashok leyland ru4 qfy2010-300410
Ashok leyland ru4 qfy2010-300410
Angel Broking
 
Tcs Result Update
Tcs  Result UpdateTcs  Result Update
Tcs Result Update
Angel Broking
 
Ge shipping ru4 qfy2010-240510
Ge shipping ru4 qfy2010-240510Ge shipping ru4 qfy2010-240510
Ge shipping ru4 qfy2010-240510
Angel Broking
 
Bosch
BoschBosch
Colgate Palmolive
Colgate PalmoliveColgate Palmolive
Colgate Palmolive
Angel Broking
 
Infosys ru2 qfy2011-151010
Infosys  ru2 qfy2011-151010Infosys  ru2 qfy2011-151010
Infosys ru2 qfy2011-151010
Angel Broking
 
Infosys Result Updated
Infosys Result UpdatedInfosys Result Updated
Infosys Result Updated
Angel Broking
 
E72 f1fc5d01
E72 f1fc5d01E72 f1fc5d01
E72 f1fc5d01
Angel Broking
 
E72 f1fc5d01
E72 f1fc5d01E72 f1fc5d01
E72 f1fc5d01
Angel Broking
 
Infosys 1 qfy2012ru-12072011
Infosys 1 qfy2012ru-12072011Infosys 1 qfy2012ru-12072011
Infosys 1 qfy2012ru-12072011
aatulsb
 
TCS 4QFY2010 Results Update
TCS 4QFY2010 Results UpdateTCS 4QFY2010 Results Update
TCS 4QFY2010 Results Update
Angel Broking
 
Exide 2 qfy2011ru-121010
Exide 2 qfy2011ru-121010Exide 2 qfy2011ru-121010
Exide 2 qfy2011ru-121010
Angel Broking
 

Similar to Concor management meet note-230610 (20)

Nestle ru2 qcy2010-02-08-10
Nestle  ru2 qcy2010-02-08-10Nestle  ru2 qcy2010-02-08-10
Nestle ru2 qcy2010-02-08-10
 
Hdil ru4 qfy2010-28052010
Hdil ru4 qfy2010-28052010Hdil ru4 qfy2010-28052010
Hdil ru4 qfy2010-28052010
 
R com ru4-qfy2010-180510
R com ru4-qfy2010-180510R com ru4-qfy2010-180510
R com ru4-qfy2010-180510
 
Hindalco Novelis
Hindalco Novelis Hindalco Novelis
Hindalco Novelis
 
Dishman ru4 qfy2010-310510
Dishman ru4 qfy2010-310510Dishman ru4 qfy2010-310510
Dishman ru4 qfy2010-310510
 
RIL - result Update
RIL - result UpdateRIL - result Update
RIL - result Update
 
Asian Paints
Asian PaintsAsian Paints
Asian Paints
 
61107576 rallis-india
61107576 rallis-india61107576 rallis-india
61107576 rallis-india
 
Ashok leyland ru4 qfy2010-300410
Ashok leyland ru4 qfy2010-300410Ashok leyland ru4 qfy2010-300410
Ashok leyland ru4 qfy2010-300410
 
Tcs Result Update
Tcs  Result UpdateTcs  Result Update
Tcs Result Update
 
Ge shipping ru4 qfy2010-240510
Ge shipping ru4 qfy2010-240510Ge shipping ru4 qfy2010-240510
Ge shipping ru4 qfy2010-240510
 
Bosch
BoschBosch
Bosch
 
Colgate Palmolive
Colgate PalmoliveColgate Palmolive
Colgate Palmolive
 
Infosys ru2 qfy2011-151010
Infosys  ru2 qfy2011-151010Infosys  ru2 qfy2011-151010
Infosys ru2 qfy2011-151010
 
Infosys Result Updated
Infosys Result UpdatedInfosys Result Updated
Infosys Result Updated
 
E72 f1fc5d01
E72 f1fc5d01E72 f1fc5d01
E72 f1fc5d01
 
E72 f1fc5d01
E72 f1fc5d01E72 f1fc5d01
E72 f1fc5d01
 
Infosys 1 qfy2012ru-12072011
Infosys 1 qfy2012ru-12072011Infosys 1 qfy2012ru-12072011
Infosys 1 qfy2012ru-12072011
 
TCS 4QFY2010 Results Update
TCS 4QFY2010 Results UpdateTCS 4QFY2010 Results Update
TCS 4QFY2010 Results Update
 
Exide 2 qfy2011ru-121010
Exide 2 qfy2011ru-121010Exide 2 qfy2011ru-121010
Exide 2 qfy2011ru-121010
 

More from Angel Broking

Market outlook 110612
Market outlook 110612Market outlook 110612
Market outlook 110612
Angel Broking
 
Axis%20 bank ru1qfy2012-220711
Axis%20 bank ru1qfy2012-220711Axis%20 bank ru1qfy2012-220711
Axis%20 bank ru1qfy2012-220711
Angel Broking
 
Electrosteel castings
Electrosteel castingsElectrosteel castings
Electrosteel castings
Angel Broking
 
Persistent systems
Persistent systemsPersistent systems
Persistent systems
Angel Broking
 
Ht media
Ht mediaHt media
Ht media
Angel Broking
 
Derivative report 19th July 2011
Derivative report 19th July 2011Derivative report 19th July 2011
Derivative report 19th July 2011
Angel Broking
 
Market outlook 19th July 2011
Market outlook 19th July 2011Market outlook 19th July 2011
Market outlook 19th July 2011
Angel Broking
 
Telecom sector
Telecom sectorTelecom sector
Telecom sector
Angel Broking
 
Weekly Report 18th July 2011
Weekly Report 18th July 2011Weekly Report 18th July 2011
Weekly Report 18th July 2011
Angel Broking
 
Derivative Report 18th July 2011
Derivative Report 18th July 2011Derivative Report 18th July 2011
Derivative Report 18th July 2011
Angel Broking
 
Technical Report 18th July 2011
Technical Report 18th July 2011Technical Report 18th July 2011
Technical Report 18th July 2011
Angel Broking
 
Market Outlook 18th July 2011
Market Outlook 18th July 2011Market Outlook 18th July 2011
Market Outlook 18th July 2011
Angel Broking
 
South Indian Bank
 South Indian Bank South Indian Bank
South Indian Bank
Angel Broking
 
Bajaj auto Result Updated
Bajaj auto Result UpdatedBajaj auto Result Updated
Bajaj auto Result Updated
Angel Broking
 
Tata consultancy services
Tata consultancy services Tata consultancy services
Tata consultancy services
Angel Broking
 
Fc4 e63c4d01
Fc4 e63c4d01Fc4 e63c4d01
Fc4 e63c4d01
Angel Broking
 
Derivatives Report 15th July 2011
Derivatives Report 15th July 2011Derivatives Report 15th July 2011
Derivatives Report 15th July 2011
Angel Broking
 
Technical Report 15th July 2011
Technical Report 15th July 2011Technical Report 15th July 2011
Technical Report 15th July 2011
Angel Broking
 
Derivative Report 13th July 2011
Derivative Report 13th July 2011Derivative Report 13th July 2011
Derivative Report 13th July 2011
Angel Broking
 
Technical Report 13th July 2011
Technical Report 13th July 2011Technical Report 13th July 2011
Technical Report 13th July 2011
Angel Broking
 

More from Angel Broking (20)

Market outlook 110612
Market outlook 110612Market outlook 110612
Market outlook 110612
 
Axis%20 bank ru1qfy2012-220711
Axis%20 bank ru1qfy2012-220711Axis%20 bank ru1qfy2012-220711
Axis%20 bank ru1qfy2012-220711
 
Electrosteel castings
Electrosteel castingsElectrosteel castings
Electrosteel castings
 
Persistent systems
Persistent systemsPersistent systems
Persistent systems
 
Ht media
Ht mediaHt media
Ht media
 
Derivative report 19th July 2011
Derivative report 19th July 2011Derivative report 19th July 2011
Derivative report 19th July 2011
 
Market outlook 19th July 2011
Market outlook 19th July 2011Market outlook 19th July 2011
Market outlook 19th July 2011
 
Telecom sector
Telecom sectorTelecom sector
Telecom sector
 
Weekly Report 18th July 2011
Weekly Report 18th July 2011Weekly Report 18th July 2011
Weekly Report 18th July 2011
 
Derivative Report 18th July 2011
Derivative Report 18th July 2011Derivative Report 18th July 2011
Derivative Report 18th July 2011
 
Technical Report 18th July 2011
Technical Report 18th July 2011Technical Report 18th July 2011
Technical Report 18th July 2011
 
Market Outlook 18th July 2011
Market Outlook 18th July 2011Market Outlook 18th July 2011
Market Outlook 18th July 2011
 
South Indian Bank
 South Indian Bank South Indian Bank
South Indian Bank
 
Bajaj auto Result Updated
Bajaj auto Result UpdatedBajaj auto Result Updated
Bajaj auto Result Updated
 
Tata consultancy services
Tata consultancy services Tata consultancy services
Tata consultancy services
 
Fc4 e63c4d01
Fc4 e63c4d01Fc4 e63c4d01
Fc4 e63c4d01
 
Derivatives Report 15th July 2011
Derivatives Report 15th July 2011Derivatives Report 15th July 2011
Derivatives Report 15th July 2011
 
Technical Report 15th July 2011
Technical Report 15th July 2011Technical Report 15th July 2011
Technical Report 15th July 2011
 
Derivative Report 13th July 2011
Derivative Report 13th July 2011Derivative Report 13th July 2011
Derivative Report 13th July 2011
 
Technical Report 13th July 2011
Technical Report 13th July 2011Technical Report 13th July 2011
Technical Report 13th July 2011
 

Recently uploaded

Satta Matka Dpboss Kalyan Matka Results Kalyan Chart
Satta Matka Dpboss Kalyan Matka Results Kalyan ChartSatta Matka Dpboss Kalyan Matka Results Kalyan Chart
Satta Matka Dpboss Kalyan Matka Results Kalyan Chart
Satta Matka Dpboss Kalyan Matka Results
 
PM Surya Ghar Muft Bijli Yojana: Online Application, Eligibility, Subsidies &...
PM Surya Ghar Muft Bijli Yojana: Online Application, Eligibility, Subsidies &...PM Surya Ghar Muft Bijli Yojana: Online Application, Eligibility, Subsidies &...
PM Surya Ghar Muft Bijli Yojana: Online Application, Eligibility, Subsidies &...
Ksquare Energy Pvt. Ltd.
 
Enhancing Adoption of AI in Agri-food: Introduction
Enhancing Adoption of AI in Agri-food: IntroductionEnhancing Adoption of AI in Agri-food: Introduction
Enhancing Adoption of AI in Agri-food: Introduction
Cor Verdouw
 
❼❷⓿❺❻❷❽❷❼❽ Dpboss Matka Result Satta Matka Guessing Satta Fix jodi Kalyan Fin...
❼❷⓿❺❻❷❽❷❼❽ Dpboss Matka Result Satta Matka Guessing Satta Fix jodi Kalyan Fin...❼❷⓿❺❻❷❽❷❼❽ Dpboss Matka Result Satta Matka Guessing Satta Fix jodi Kalyan Fin...
❼❷⓿❺❻❷❽❷❼❽ Dpboss Matka Result Satta Matka Guessing Satta Fix jodi Kalyan Fin...
❼❷⓿❺❻❷❽❷❼❽ Dpboss Kalyan Satta Matka Guessing Matka Result Main Bazar chart
 
Satta Matka Dpboss Kalyan Matka Results Kalyan Chart
Satta Matka Dpboss Kalyan Matka Results Kalyan ChartSatta Matka Dpboss Kalyan Matka Results Kalyan Chart
Satta Matka Dpboss Kalyan Matka Results Kalyan Chart
Satta Matka Dpboss Kalyan Matka Results
 
Kirill Klip GEM Royalty TNR Gold Lithium Presentation
Kirill Klip GEM Royalty TNR Gold Lithium PresentationKirill Klip GEM Royalty TNR Gold Lithium Presentation
Kirill Klip GEM Royalty TNR Gold Lithium Presentation
Kirill Klip
 
欧洲杯投注-欧洲杯投注外围盘口-欧洲杯投注盘口app|【​网址​🎉ac22.net🎉​】
欧洲杯投注-欧洲杯投注外围盘口-欧洲杯投注盘口app|【​网址​🎉ac22.net🎉​】欧洲杯投注-欧洲杯投注外围盘口-欧洲杯投注盘口app|【​网址​🎉ac22.net🎉​】
欧洲杯投注-欧洲杯投注外围盘口-欧洲杯投注盘口app|【​网址​🎉ac22.net🎉​】
concepsionchomo153
 
High-Quality IPTV Monthly Subscription for $15
High-Quality IPTV Monthly Subscription for $15High-Quality IPTV Monthly Subscription for $15
High-Quality IPTV Monthly Subscription for $15
advik4387
 
Sustainable Logistics for Cost Reduction_ IPLTech Electric's Eco-Friendly Tra...
Sustainable Logistics for Cost Reduction_ IPLTech Electric's Eco-Friendly Tra...Sustainable Logistics for Cost Reduction_ IPLTech Electric's Eco-Friendly Tra...
Sustainable Logistics for Cost Reduction_ IPLTech Electric's Eco-Friendly Tra...
IPLTech Electric
 
Satta Matka Dpboss Kalyan Matka Results Kalyan Chart
Satta Matka Dpboss Kalyan Matka Results Kalyan ChartSatta Matka Dpboss Kalyan Matka Results Kalyan Chart
Satta Matka Dpboss Kalyan Matka Results Kalyan Chart
Satta Matka Dpboss Kalyan Matka Results
 
deft. 2024 pricing guide for onboarding
deft.  2024 pricing guide for onboardingdeft.  2024 pricing guide for onboarding
deft. 2024 pricing guide for onboarding
hello960827
 
DearbornMusic-KatherineJasperFullSailUni
DearbornMusic-KatherineJasperFullSailUniDearbornMusic-KatherineJasperFullSailUni
DearbornMusic-KatherineJasperFullSailUni
katiejasper96
 
Discover the Beauty and Functionality of The Expert Remodeling Service
Discover the Beauty and Functionality of The Expert Remodeling ServiceDiscover the Beauty and Functionality of The Expert Remodeling Service
Discover the Beauty and Functionality of The Expert Remodeling Service
obriengroupinc04
 
The Steadfast and Reliable Bull: Taurus Zodiac Sign
The Steadfast and Reliable Bull: Taurus Zodiac SignThe Steadfast and Reliable Bull: Taurus Zodiac Sign
The Steadfast and Reliable Bull: Taurus Zodiac Sign
my Pandit
 
The latest Heat Pump Manual from Newentide
The latest Heat Pump Manual from NewentideThe latest Heat Pump Manual from Newentide
The latest Heat Pump Manual from Newentide
JoeYangGreatMachiner
 
Registered-Establishment-List-in-Uttarakhand-pdf.pdf
Registered-Establishment-List-in-Uttarakhand-pdf.pdfRegistered-Establishment-List-in-Uttarakhand-pdf.pdf
Registered-Establishment-List-in-Uttarakhand-pdf.pdf
dazzjoker
 
Best Competitive Marble Pricing in Dubai - ☎ 9928909666
Best Competitive Marble Pricing in Dubai - ☎ 9928909666Best Competitive Marble Pricing in Dubai - ☎ 9928909666
Best Competitive Marble Pricing in Dubai - ☎ 9928909666
Stone Art Hub
 
Adani Group's Active Interest In Increasing Its Presence in the Cement Manufa...
Adani Group's Active Interest In Increasing Its Presence in the Cement Manufa...Adani Group's Active Interest In Increasing Its Presence in the Cement Manufa...
Adani Group's Active Interest In Increasing Its Presence in the Cement Manufa...
Adani case
 
CULR Spring 2024 Journal.pdf testing for duke
CULR Spring 2024 Journal.pdf testing for dukeCULR Spring 2024 Journal.pdf testing for duke
CULR Spring 2024 Journal.pdf testing for duke
ZevinAttisha
 
AI Transformation Playbook: Thinking AI-First for Your Business
AI Transformation Playbook: Thinking AI-First for Your BusinessAI Transformation Playbook: Thinking AI-First for Your Business
AI Transformation Playbook: Thinking AI-First for Your Business
Arijit Dutta
 

Recently uploaded (20)

Satta Matka Dpboss Kalyan Matka Results Kalyan Chart
Satta Matka Dpboss Kalyan Matka Results Kalyan ChartSatta Matka Dpboss Kalyan Matka Results Kalyan Chart
Satta Matka Dpboss Kalyan Matka Results Kalyan Chart
 
PM Surya Ghar Muft Bijli Yojana: Online Application, Eligibility, Subsidies &...
PM Surya Ghar Muft Bijli Yojana: Online Application, Eligibility, Subsidies &...PM Surya Ghar Muft Bijli Yojana: Online Application, Eligibility, Subsidies &...
PM Surya Ghar Muft Bijli Yojana: Online Application, Eligibility, Subsidies &...
 
Enhancing Adoption of AI in Agri-food: Introduction
Enhancing Adoption of AI in Agri-food: IntroductionEnhancing Adoption of AI in Agri-food: Introduction
Enhancing Adoption of AI in Agri-food: Introduction
 
❼❷⓿❺❻❷❽❷❼❽ Dpboss Matka Result Satta Matka Guessing Satta Fix jodi Kalyan Fin...
❼❷⓿❺❻❷❽❷❼❽ Dpboss Matka Result Satta Matka Guessing Satta Fix jodi Kalyan Fin...❼❷⓿❺❻❷❽❷❼❽ Dpboss Matka Result Satta Matka Guessing Satta Fix jodi Kalyan Fin...
❼❷⓿❺❻❷❽❷❼❽ Dpboss Matka Result Satta Matka Guessing Satta Fix jodi Kalyan Fin...
 
Satta Matka Dpboss Kalyan Matka Results Kalyan Chart
Satta Matka Dpboss Kalyan Matka Results Kalyan ChartSatta Matka Dpboss Kalyan Matka Results Kalyan Chart
Satta Matka Dpboss Kalyan Matka Results Kalyan Chart
 
Kirill Klip GEM Royalty TNR Gold Lithium Presentation
Kirill Klip GEM Royalty TNR Gold Lithium PresentationKirill Klip GEM Royalty TNR Gold Lithium Presentation
Kirill Klip GEM Royalty TNR Gold Lithium Presentation
 
欧洲杯投注-欧洲杯投注外围盘口-欧洲杯投注盘口app|【​网址​🎉ac22.net🎉​】
欧洲杯投注-欧洲杯投注外围盘口-欧洲杯投注盘口app|【​网址​🎉ac22.net🎉​】欧洲杯投注-欧洲杯投注外围盘口-欧洲杯投注盘口app|【​网址​🎉ac22.net🎉​】
欧洲杯投注-欧洲杯投注外围盘口-欧洲杯投注盘口app|【​网址​🎉ac22.net🎉​】
 
High-Quality IPTV Monthly Subscription for $15
High-Quality IPTV Monthly Subscription for $15High-Quality IPTV Monthly Subscription for $15
High-Quality IPTV Monthly Subscription for $15
 
Sustainable Logistics for Cost Reduction_ IPLTech Electric's Eco-Friendly Tra...
Sustainable Logistics for Cost Reduction_ IPLTech Electric's Eco-Friendly Tra...Sustainable Logistics for Cost Reduction_ IPLTech Electric's Eco-Friendly Tra...
Sustainable Logistics for Cost Reduction_ IPLTech Electric's Eco-Friendly Tra...
 
Satta Matka Dpboss Kalyan Matka Results Kalyan Chart
Satta Matka Dpboss Kalyan Matka Results Kalyan ChartSatta Matka Dpboss Kalyan Matka Results Kalyan Chart
Satta Matka Dpboss Kalyan Matka Results Kalyan Chart
 
deft. 2024 pricing guide for onboarding
deft.  2024 pricing guide for onboardingdeft.  2024 pricing guide for onboarding
deft. 2024 pricing guide for onboarding
 
DearbornMusic-KatherineJasperFullSailUni
DearbornMusic-KatherineJasperFullSailUniDearbornMusic-KatherineJasperFullSailUni
DearbornMusic-KatherineJasperFullSailUni
 
Discover the Beauty and Functionality of The Expert Remodeling Service
Discover the Beauty and Functionality of The Expert Remodeling ServiceDiscover the Beauty and Functionality of The Expert Remodeling Service
Discover the Beauty and Functionality of The Expert Remodeling Service
 
The Steadfast and Reliable Bull: Taurus Zodiac Sign
The Steadfast and Reliable Bull: Taurus Zodiac SignThe Steadfast and Reliable Bull: Taurus Zodiac Sign
The Steadfast and Reliable Bull: Taurus Zodiac Sign
 
The latest Heat Pump Manual from Newentide
The latest Heat Pump Manual from NewentideThe latest Heat Pump Manual from Newentide
The latest Heat Pump Manual from Newentide
 
Registered-Establishment-List-in-Uttarakhand-pdf.pdf
Registered-Establishment-List-in-Uttarakhand-pdf.pdfRegistered-Establishment-List-in-Uttarakhand-pdf.pdf
Registered-Establishment-List-in-Uttarakhand-pdf.pdf
 
Best Competitive Marble Pricing in Dubai - ☎ 9928909666
Best Competitive Marble Pricing in Dubai - ☎ 9928909666Best Competitive Marble Pricing in Dubai - ☎ 9928909666
Best Competitive Marble Pricing in Dubai - ☎ 9928909666
 
Adani Group's Active Interest In Increasing Its Presence in the Cement Manufa...
Adani Group's Active Interest In Increasing Its Presence in the Cement Manufa...Adani Group's Active Interest In Increasing Its Presence in the Cement Manufa...
Adani Group's Active Interest In Increasing Its Presence in the Cement Manufa...
 
CULR Spring 2024 Journal.pdf testing for duke
CULR Spring 2024 Journal.pdf testing for dukeCULR Spring 2024 Journal.pdf testing for duke
CULR Spring 2024 Journal.pdf testing for duke
 
AI Transformation Playbook: Thinking AI-First for Your Business
AI Transformation Playbook: Thinking AI-First for Your BusinessAI Transformation Playbook: Thinking AI-First for Your Business
AI Transformation Playbook: Thinking AI-First for Your Business
 

Concor management meet note-230610

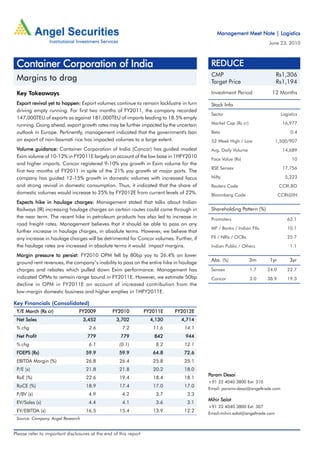
  • 1. Logistics Management Meet Note | Logistics June 23, 2010 Container Corporation of India REDUCE CMP Rs1,306 Margins to drag Target Price Rs1,194 Key Takeaways Investment Period 12 Months Export revival yet to happen: Export volumes continue to remain lacklustre in turn Stock Info driving empty running. For first two months of FY2011, the company recorded Sector Logistics 147,000TEU of exports as against 181,000TEU of imports leading to 18.5% empty running. Going ahead, export growth rates may be further impacted by the uncertain Market Cap (Rs cr) 16,977 outlook in Europe. Pertinently, management indicated that the government's ban Beta 0.4 on export of non-basmati rice has impacted volumes to a large extent. 52 Week High / Low 1,500/907 Volume guidance: Container Corporation of India (Concor) has guided modest Avg. Daily Volume 14,689 Exim volume of 10-12% in FY2011E largely on account of the low base in 1HFY2010 Face Value (Rs) 10 and higher imports. Concor registered 9-10% yoy growth in Exim volume for the BSE Sensex 17,756 first two months of FY2011 in spite of the 21% yoy growth at major ports. The company has guided 12-15% growth in domestic volumes with increased focus Nifty 5,223 and strong revival in domestic consumption. Thus, it indicated that the share of Reuters Code CCRI.BO domestic volumes would increase to 25% by FY2012E from current levels of 22%. Bloomberg Code CCRI@IN Expects hike in haulage charges: Management stated that talks about Indian Railways (IR) increasing haulage charges on certain routes could come through in Shareholding Pattern (%) the near term. The recent hike in petroleum products has also led to increase in Promoters 63.1 road freight rates. Management believes that it should be able to pass on any MF / Banks / Indian FIIs 10.1 further increase in haulage charges, in absolute terms. However, we believe that any increase in haulage charges will be detrimental for Concor volumes. Further, if FII / NRIs / OCBs 25.7 the haulage rates are increased in absolute terms it would impact margins. Indian Public / Others 1.1 Margin pressure to persist: FY2010 OPM fell by 80bp yoy to 26.4% on lower ground rent revenues, the company’s inability to pass on the entire hike in haulage Abs. (%) 3m 1yr 3yr charges and rebates which pulled down Exim performance. Management has Sensex 1.7 24.0 22.7 indicated OPMs to remain range bound in FY2011E. However, we estimate 50bp Concor 3.0 38.9 19.3 decline in OPM in FY2011E on account of increased contribution from the low-margin domestic business and higher empties in 1HFY2011E. Key Financials (Consolidated) Y/E March (Rs cr) FY2009 FY2010 FY2011E FY2012E Net Sales 3,452 3,702 4,130 4,714 % chg 2.6 7.2 11.6 14.1 Net Profit Profit 779 779 842 944 % chg 6.1 (0.1) 8.2 12.1 FDEPS (Rs) 59.9 59.9 64.8 72.6 EBITDA Margin (%) 26.8 26.4 25.8 25.1 P/E (x) 21.8 21.8 20.2 18.0 Param Desai RoE (%) 22.6 19.4 18.4 18.1 +91 22 4040 3800 Ext: 310 RoCE (%) 18.9 17.4 17.0 17.0 Email: paramv.desai@angeltrade.com P/BV (x) 4.9 4.2 3.7 3.3 Mihir Salot EV/Sales (x) 4.4 4.1 3.6 3.1 +91 22 4040 3800 Ext: 307 EV/EBITDA (x) 16.5 15.4 13.9 12.2 Email:mihirr.salot@angeltrade.com Source: Company, Angel Research Please refer to important disclosures at the end of this report
  • 2. Container Corporation of India| Management Meet Note Exhibit 1: Domestic Volume Growth Trend Exhibit 2: EXIM Volume Growth Trend 800 25.0 2,500 20.0 700 20.7 20.0 15.3 15.0 18.9 2,000 600 15.0 10.2 9.9 10.0 500 14.0 9.9 '000 TEUs 1,500 '000 TEUs 12.0 (%) (%) 400 10.0 5.0 1,000 1.5 300 5.0 0.0 4.2 200 500 0.0 (5.0) 100 (6.2) (3.6) 0 (5.0) 0 (10.0) FY07 FY08 FY09 FY10 FY11E FY12E FY07 FY08 FY09 FY10 FY11E FY12E Domestic Containers (LHS) yoy change (RHS) Exim Containers (LHS) yoy change (RHS) Source: Company, Angel Research Source: Company, Angel Research FY2010 performance hit by lower other income and ground rent Concor had healthy cash balance of Rs2,000cr as on March 2010. For FY2010, the company reported a 23.5% yoy dip in other income to Rs162cr primarily due to lower interest income. Management indicated that it was mandated to divert its funds to certain nominated investments with a low yield of around 6%, which resulted lower other income. Going ahead too, management stated that other income would continue to register similar yield as in FY2010. Ground rent revenue also fell by Rs Rs200/TEU in FY2010 resulting in lower overall ground rent income of Rs246cr (Rs273cr). The higher ground rent in FY2009 was an aberration as importers were avoiding taking delivery of goods owing to recession. Consequently, Concor reported flat net income in FY2010. Deteriorating Exim market share remains a concern Concor is in a commanding position owing to its mammoth infrastructure - 237 rakes and 60 terminals - built over 20 years. The company plans to add another 40-45 rakes and four terminals over FY2010-12E. Currently, Concor is the preferred transporter via Rail among the shipping lines on account of being the lowest-cost service provider in the segment and due to the strategic location of its container depots. However, during FY2006-10, Concor conceded market share by 620bp to 27.4% from its peak of 33.7% to the Road segment and private players. In FY2007, Concor was impacted by higher IR tariffs and opening up of Rail containerisation to the private players. Over the next four-five years too, we expect Concor to record further drop in market share to around 25% on the back of higher haulage charges, which would render it uncompetitive in the FEU segment, and the private players would gradually increase their presence. June 23, 2010 2
  • 3. Container Corporation of India | Management Meet Note Exhibit 3: Declining Exim Market share3: Exhibit 4: Declining Operating Margins 35 9,000 36.0 33.7 8,000 32.5 31.0 33.0 31.5 7,000 32 29.5 30.0 6,000 28.2 29.1 27.8 28.7 '000 TEUs 5,000 27.0 29 (%) 27.2 (%) 4,000 26.6 26.4 25.0 24.0 25.8 3,000 26 25.1 21.0 2,000 18.0 23 1,000 0 15.0 FY05 FY06 FY07 FY08 FY09 FY10 FY12E 20 Domestic Containers (LHS) yoy change (RHS) FY05 FY06 FY07 FY08 FY09 FY10 FY11E FY12E Source: Company, Angel Research Source: Company, Angel Research Outlook and Valuation Concor is gradually losing its pricing power in the Exim Segment, which could be a further threat once more Rail-linked ICDs from the private players come up. However, we remain bullish on the Container sector in the long term, which is the core driver of Concor's business. Nonetheless, higher IR tariffs and opening up of the Container industry to the private players will impact the company's market share in the long run. We also believe that the company's growth trajectory will be lower than its historical trend. Thus, key risk to our recommendation will be Concor maintaining its market share and accelerated construction of the dedicated Rail-freight corridor, which could help it wrest market share from the Road segment. We estimate Concor to post muted Earnings CAGR of 10.1% over FY2010-12E, as against the 17.6% CAGR registered during FY2005-09. At the current market price, the stock is trading at 18.0x FY2012E Earnings and at 12.2x FY2012E EV/EBITDA. We maintain our Reduce rating on stock, with a Target Price of Rs1,194. Target Price Exhibit 5: One Year Forward P/E 25 20 Trading at premium to its five yr average 15 (x) 10 5 0 Jun-05 Sep-05 Dec-05 Mar-09 Jun-09 Sep-09 Dec-09 Mar-06 Jun-06 Sep-06 Dec-06 Mar-08 Jun-08 Sep-08 Dec-08 Mar-07 Jun-07 Sep-07 Dec-07 Mar-10 Jun-10 P/E Average Source: Bloomberg, Angel Research June 23, 2010 3
  • 4. Container Corporation of India| Management Meet Note Profit & Loss Statement (Consolidated) Rs crore Y/E March FY2008 FY2009 FY2010 FY2011E FY2012E Gross sales 3,364 3,452 3,702 4,130 4,714 Less: Excise duty - - - - - Net Sales 3,364 3,452 3,702 4,130 4,714 Other operating income - - - - - Total operating income 3,364 3,452 3,702 4,130 4,714 % chg 9.8 2.6 7.2 11.6 14.1 Total Expenditure 2,487 2,526 2,726 3,065 3,530 Terminal & other Service Charges 2,320 2,286 2,462 2,755 3,158 Other Expenses 111 157 185 223 273 Personnel 56 83 79 87 99 Other - - - - - EBITDA EBITDA 876 927 976 1,066 1,183 % chg (1.6) 5.8 5.3 9.1 11.0 (% of Net Sales) 26.1 26.8 26.4 25.8 25.1 Depreciation& Amortisation 108.6 119.5 134.3 144.9 148.4 EBIT 768 807 842 921 1,035 % chg (3.7) 5.1 4.3 9.3 12.4 (% of Net Sales) 22.8 23.4 22.7 22.3 22.0 Interest & other Charges 3 4 - - - Other Income 165 211 162 166 183 (% of PBT) 17.8 20.8 16.1 15.3 15.0 Recurring PBT 930 1,014 1,004 1,087 1,218 % chg 5.5 9.0 (1.0) 8.3 12.1 Extraordinary Expense/(Inc.) - - - - - PBT (reported) 930 1,014 1,004 1,087 1,218 Tax 198 235 225 245 274 (% of PBT) 21.3 23.1 22.4 22.5 22.5 PAT (reported) 732 779 779 842 944 Tax Adjustments of prior period 1.9 (0.5) - - - Minority Interest - - - - - Prior period items (0.2) 0.2 - - - PAT after MI (reported) 732 779 779 842 944 ADJ. PAT ADJ. PA 734 779 779 842 944 % chg 4.3 6.1 (0.1) 8.2 12.1 (% of Net Sales) 21.8 22.6 21.0 20.4 20.0 Basic EPS (Rs) 56.5 59.9 59.9 64.8 72.6 Fully Diluted EPS (Rs) 56.5 59.9 59.9 64.8 72.6 % chg 4.3 6.1 (0.1) 8.2 12.1 June 23, 2010 4
  • 5. Container Corporation of India | Management Meet Note Balance Sheet (Consolidated) Rs crore Y/E March FY2008 FY2009 FY2010 FY2011E FY2012E SOURCES OF FUNDS Equity Share Capital 130 130 130 130 130 Preference Capital - - - - - Reserves& Surplus 3,036 3,602 4,159 4,753 5,423 Funds Shareholders Funds 3,166 3,732 4,289 4,883 5,553 Minority Interest - - - - - Total Loans 50 49 49 49 49 Deferred Tax Liability 174 194 194 194 194 Total Liabilities 3,390 3,974 4,531 5,126 5,796 APPLICATION OF FUNDS APPLICATION Gross Block 2,327 2,722 3,122 3,622 4,122 Less: Acc. Depreciation 581 698 832 977 1,125 Net Block 1,746 2,025 2,290 2,645 2,997 Capital Work-in-Progress 172 246 246 246 246 Goodwill - - - - - Investments 120 168 168 168 168 Current Assets 1,900 2,159 2,401 2,679 3,046 Cash 1,523 1,767 2,004 2,216 2,550 Loans & Advances 282 276 292 342 381 Other 95 116 105 121 115 Current liabilities & Provisions 549 623 573 612 661 Net Current Assets 1,351 1,536 1,827 2,067 2,385 Mis. Exp. not written off 0 0 0 0 0 Total Assets 3,390 3,974 4,531 5,126 5,796 June 23, 2010 5
  • 6. Container Corporation of India| Management Meet Note Cash Flow Statement (Consolidated) Rs crore Y/E March FY2008 FY2009 FY2010 FY2011E FY2012E Profit before tax 930 1,014 1,004 1,087 1,218 Depreciation 109 120 134 145 148 Change in Working Capital (14) 39 (43) (40) 3 Less: Other Adjustments (136) (175) - - - Direct taxes paid (191) (204) (225) (245) (274) Cash Flow from Operations 697 793 870 947 1,095 (Inc.)/ Dec. in Fixed Assets (303) (388) (400) (500) (500) (Inc)./ Dec. in Investments (24) (48) - - - (Inc)./ Dec. in loans and advances 85 (74) - - - Other income 139 172 - - - Cash Flow from Investing (102) (338) (400) (500) (500) Issue of Equity - - - - - Inc./(Dec). in loans 20 (2) - - - Dividend Paid (Incl. Tax) (167) (205) (232) (235) (261) Others (3) (4) - - - Financing Cash Flow from Financing (150) (211) (232) (235) (261) Inc./(Dec.) in Cash 445 244 237 212 334 Opening Cash balances 1,078 1,523 1,767 2,004 2,216 Closing Cash balances 1,523 1,767 2,004 2,216 2,550 June 23, 2010 6
  • 7. Container Corporation of India | Management Meet Note Key Ratios Y/E March FY2008 FY2009 FY2010 FY2011E FY2012E Valuation Ratio (x) P/E (on FDEPS) 23.1 21.8 21.8 20.2 18.0 P/CEPS 19.9 18.5 18.6 17.2 15.5 P/BV 5.9 4.9 4.2 3.7 3.3 Dividend yield (%) 5.4 4.5 4.0 3.5 3.1 EV/Sales 4.6 4.4 4.1 3.6 3.1 EV/EBITDA 17.7 16.5 15.4 13.9 12.2 EV / Total Assets 3.9 3.3 2.9 2.6 2.2 Per Share Data (Rs) EPS (Basic) 56.5 59.9 59.9 64.8 72.6 EPS (fully diluted) 56.5 59.9 59.9 64.8 72.6 Cash EPS 65.7 70.7 70.2 75.9 84.0 DPS 13.0 14.0 17.0 19.0 21.0 Book Value 243.5 287.1 330.0 375.7 427.2 Dupont Analysis EBIT margin 22.8 23.4 22.7 22.3 22.0 Tax retention ratio 0.8 0.8 0.8 0.8 0.8 Asset turnover (x) 1.5 1.3 1.2 1.2 1.3 ROIC (Post-tax) 26.1 23.7 22.0 21.5 21.6 Cost of Debt (Post Tax) 0.0 0.1 - - - Operating ROE 26.1 23.7 22.0 21.5 21.6 Returns (%) ROCE (Pre-tax) 21.2 18.9 17.4 17.0 17.0 Angel ROIC (Pre-tax) 36.6 33.4 31.0 30.0 29.8 ROE 25.3 22.6 19.4 18.4 18.1 Turnover ratios (x) Asset Turnover (Gross Block) 1.5 1.4 1.3 1.2 1.2 Inventory / Sales (days) 1 2 2 2 2 Receivables (days) 1 2 2 2 2 Payables (days) 59 66 62 54 50 Working capital cycle (ex-cash) (days) (18) (21) (20) (14) (12) Solvency ratios (x) Net debt to equity (0.5) (0.5) (0.5) (0.4) (0.5) Net debt to EBITDA (1.7) (1.9) (2.0) (2.0) (2.1) Interest Coverage (EBIT / Interest) 301.1 191.3 NA NA NA June 23, 2010 7
  • 8. Container Corporation of India Disclaimer This document is solely for the personal information of the recipient, and must not be singularly used as the basis of any investment decision. Nothing in this document should be construed as investment or financial advice. Each recipient of this document should make such investigations as they deem necessary to arrive at an independent evaluation of an investment in the securities of the companies referred to in this document (including the merits and risks involved), and should consult their own advisors to determine the merits and risks of such an investment. Angel Securities Limited, its affiliates, directors, its proprietary trading and investment businesses may, from time to time, make investment decisions that are inconsistent with or contradictory to the recommendations expressed herein. The views contained in this document are those of the analyst, and the company may or may not subscribe to all the views expressed within. Reports based on technical and derivative analysis center on studying charts of a stock's price movement, outstanding positions and trading volume, as opposed to focusing on a company's fundamentals and, as such, may not match with a report on a company's fundamentals. The information in this document has been printed on the basis of publicly available information, internal data and other reliable sources believed to be true, and is for general guidance only. Angel Securities Limited has not independently verified all the information contained within this document. Accordingly, we cannot testify, nor make any representation or warranty, express or implied, to the accuracy, contents or data contained within this document. While Angel Securities Limited endeavours to update on a reasonable basis the information discussed in this material, there may be regulatory, compliance, or other reasons that prevent us from doing so. This document is being supplied to you solely for your information, and its contents, information or data may not be reproduced, redistributed or passed on, directly or indirectly. Angel Securities Limited and its affiliates may seek to provide or have engaged in providing corporate finance, investment banking or other advisory services in a merger or specific transaction to the companies referred to in this report, as on the date of this report or in the past. Neither Angel Securities Limited, nor its directors, employees or affiliates shall be liable for any loss or damage that may arise from or in connection with the use of this information. Note: Please refer to the important `Stock Holding Disclosure' report on the Angel website (Research Section). Disclosure of Interest Statement Container Corporation of India 1. Analyst ownership of the stock No 2. Angel and its Group companies ownership of the stock No 3. Angel and its Group companies' Directors ownership of the stock No 4. Broking relationship with company covered No Note: We have not considered any Exposure below Rs 1 lakh for Angel, its Group companies and Directors. Ratings (Returns) : Buy (> 15%) Accumulate (5% to 15%) Neutral (-5 to 5%) Reduce (-5% to -15%) Sell (< -15%)
  • 9. Container Corporation of India Address: Acme Plaza, ‘A’ Wing, 3rd Floor, M.V. Road, Opp. Sangam Cinema, Andheri (E), Mumbai - 400 059. Tel : (022) 3952 4568 / 4040 3800 Research Team Fundamental: Sarabjit Kour Nangra VP-Research, Pharmaceutical sarabjit@angeltrade.com Vaibhav Agrawal VP-Research, Banking vaibhav.agrawal@angeltrade.com Vaishali Jajoo Automobile vaishali.jajoo@angeltrade.com Shailesh Kanani Infrastructure, Real Estate shailesh.kanani@angeltrade.com Anand Shah FMCG , Media anand.shah@angeltrade.com Deepak Pareek Oil & Gas deepak.pareek@angeltrade.com Puneet Bambha Capital Goods, Engineering puneet.bambha@angeltrade.com Sushant Dalmia Pharmaceutical sushant.dalmia@angeltrade.com Rupesh Sankhe Cement, Power rupeshd.sankhe@angeltrade.com Param Desai Real Estate, Logistics, Shipping paramv.desai@angeltrade.com Sageraj Bariya Fertiliser, Mid-cap sageraj.bariya@angeltrade.com Viraj Nadkarni Retail, Hotels, Mid-cap virajm.nadkarni@angeltrade.com Paresh Jain Metals & Mining pareshn.jain@angeltrade.com Amit Rane Banking amitn.rane@angeltrade.com Rahul Jain IT, Telecom rahul.j@angeltrade.com Jai Sharda Mid-cap jai.sharda@angeltrade.com Sharan Lillaney Mid-cap sharanb.lillaney@angeltrade.com Amit Vora Research Associate (Oil & Gas) amit.vora@angeltrade.com V Srinivasan Research Associate (Cement, Power) v.srinivasan@angeltrade.com Aniruddha Mate Research Associate (Infra, Real Estate) aniruddha.mate@angeltrade.com Mihir Salot Research Associate (Logistics, Shipping) mihirr.salot@angeltrade.com Chitrangda Kapur Research Associate (FMCG, Media) chitrangdar.kapur@angeltrade.com Vibha Salvi Research Associate (IT, Telecom) vibhas.salvi@angeltrade.com Pooja Jain Research Associate (Metals & Mining) pooja.j@angeltrade.com Technicals: Shardul Kulkarni Sr. Technical Analyst shardul.kulkarni@angeltrade.com Mileen Vasudeo Technical Analyst vasudeo.kamalakant@angeltrade.com Derivatives: Siddarth Bhamre Head - Derivatives siddarth.bhamre@angeltrade.com Jaya Agarwal Derivative Analyst jaya.agarwal@angeltrade.com Institutional Sales Team: Mayuresh Joshi VP - Institutional Sales mayuresh.joshi@angeltrade.com Abhimanyu Sofat AVP - Institutional Sales abhimanyu.sofat@angeltrade.com Nitesh Jalan Sr. Manager niteshk.jalan@angeltrade.com Pranav Modi Sr. Manager pranavs.modi@angeltrade.com Sandeep Jangir Sr. Manager sandeepp.jangir@angeltrade.com Ganesh Iyer Sr. Manager ganeshb.Iyer@angeltrade.com Jay Harsora Sr. Dealer jayr.harsora@angeltrade.com Meenakshi Chavan Dealer meenakshis.chavan@angeltrade.com Gaurang Tisani Dealer gaurangp.tisani@angeltrade.com Production Team: Bharathi Shetty Research Editor bharathi.shetty@angeltrade.com Bharat Patil Production bharat.patil@angeltrade.com Dilip Patel Production dilipm.patel@angeltrade.com Angel Broking Ltd: BSE Sebi Regn No : INB 010996539 / CDSL Regn No: IN - DP - CDSL - 234 - 2004 / PMS Regn Code: PM/INP000001546 Angel Securities Ltd:BSE: INB010994639/INF010994639 NSE: INB230994635/INF230994635 Membership numbers: BSE 028/NSE:09946 Angel Capital & Debt Market Ltd: INB 231279838 / NSE FNO: INF 231279838 / NSE Member code -12798 Angel Commodities Broking (P) Ltd: MCX Member ID: 12685 / FMC Regn No: MCX / TCM / CORP / 0037 NCDEX : Member ID 00220 / FMC Regn No: NCDEX / TCM / CORP / 0302