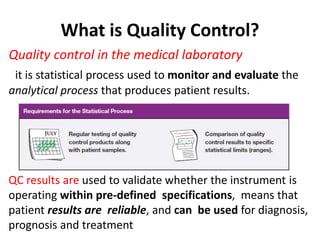
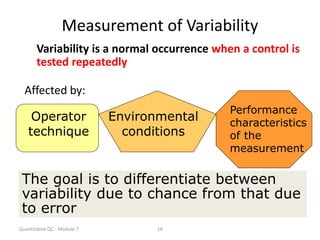
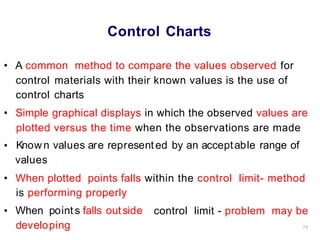
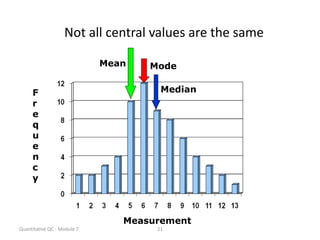
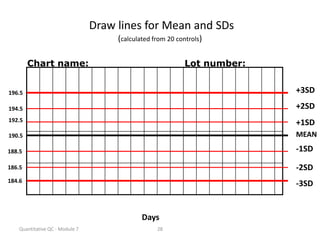
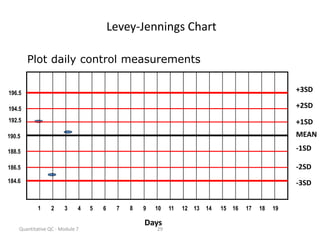
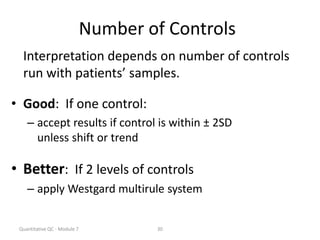
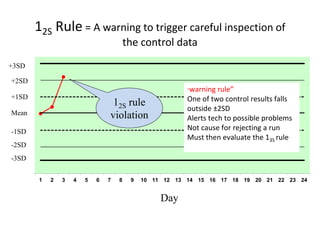
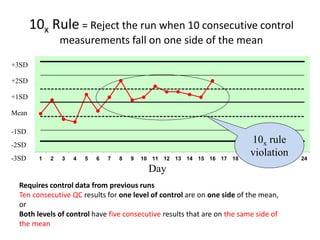
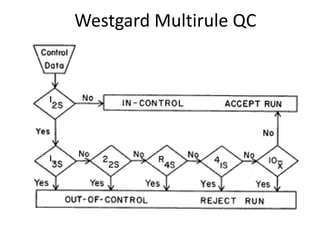
What is Quality Control?
Quality control in the medical laboratory
it is statistical process used to monitor and evaluate the
analytical process that produces patient results.
QC results are used to validate whether the instrument is
operating within pre-defined specifications, means that
patient results are reliable, and can be used for diagnosis,
prognosis and treatment
QUALITY: A DEGREE OF EXCELLENCE
• QUALITY CONTROL (INTER.)
+
QUALITYASSESSMENT
• (EXTR.)
QUALITY ASSURANCE
20
QCv/sQA
Quality Control -QC refers to operational techniques that must
be included during assay run to verify that the requirementseach
for Quality are met wit h
Quality Assurance - QA refers to all those planned and systematic
activities to provide confidence that the results given out by the
laboratory are correct
The aim of QC is simply to ensure that the results generated by the
test are correct.
However quality assurance is concerned with much more: that the
right test is carried out on the right specimen and that the right
result and right interpretation is delivered to the right person at
the right time
23
•
QUALITY ASSURANCE (QA)
• The purpose of QA is the maintenance of the overall
quality of patient results
• All factors that
the test
effect the test results from the time
Post-analytic
•
Pre-analytic Analytic
• •
Result accuracy
Analytical errors
Assay repeat rates
Specimen collection
Specimen transport
Specimen quality
24
Result reporting
Record keeping for
patient and QC
How to implement a QC program?
– Establish written policies and procedures
– Assign responsibility for monitoring and reviewing
– Train staff
– Obtain control materials
– Collect data
– Set target values (mean, SD)
– Establish Levey-Jennings charts
– Routinely plot control data
– Establish and implement troubleshooting and
corrective action protocols
– Establish and maintain system for documentation
Quantitative QC - Module 7 10
Calibrators vs. Controls
Quantitative QC - Module 7 11
Calibrators
A substance with a specific
concentration.
Used to adjust instrument,
kit, test system in order to
standardize the assay
Calibrators are used to set
(calibrate) the measuring
points on a scale.
Sometimes called a standard,
although usually not a
true standard and not a control
Controls
Known concentration of
the analyte
Use 2 or three levels of
controls
A substance similar to
patients’ samples that
has an established
concentration.
Controls are used to
Ensure the procedure is
working properly.
1 2 3 4 5
1 2 3 4 5
Quantitative QC - Module 7 12
Control Materials
ASSAYED
Target value predetermined
Verify and use
UNASSAYED
Target value not predetermined
Full assay required before using
“IN-HOUSE”
In-house pooled sera
Full assay, validation
Quantitative QC - Module 7 13
Choosing Control Materials
• values cover medical decision points
• similar to the test sample
• controls are usually available in high, normal, and low ranges
Quantitative QC - Module 7 14
Preparation and Storage of
Control Material
• adhere to manufacturer’s
instructions
• keep adequate amount
of same lot number
• store correctly
CONTROL
CONTROL
Quantitative QC - Module 7 15
Steps in Implementing Quantitative QC
• obtain control material
• run each control 20
times over 30 days
• calculate mean and +/-1,2,3
Standard Deviations
Mean
1SD
1SD
2SD
3SD
2SD
3SD
Quantitative QC - Module 7 16
Measurement of Variability
Variability is a normal occurrence when a control is
tested repeatedly
Affected by:
Operator
technique
Environmental
conditions
Performance
characteristics
of the
measurement
The goal is to differentiate between
variability due to chance from that due
to error
Control Charts
• A common method to compare the values observed for
control
control
Simple
materials with their known values is the use of
charts
graphical displays in which the observed values are
•
plotted versus the time when the observations are made
Known values are represented by an acceptable range of
values
•
• When plotted points falls
is performing properly
When point s falls out side
developing
within the control limit- method
• control limit - problem may be
73
Quantitative QC - Module 7 18
Accuracy and Precision
Accuracy closeness of measurements to the true value
Precision amount of variation in the measurements
Bias The difference between the expectation of a test
result and an accepted reference value
19
Measures of Central Tendency
Mode the value which occurs with the greatest
frequency
Median the value at the center or midpoint of the
observations
Mean the calculated average of the values
Quantitative QC - Module 7 20
Measures of Central Tendency
Although variable, sets of data are distributed
around a central value
Measurement
F
r
e
q
u
e
n
c
y
Quantitative QC - Module 7 21
Not all central values are the same
Mode
Median
Mean
Measurement
F
r
e
q
u
e
n
c
y
Quantitative QC - Module 7 22
Symbols Used in Calculations
∑ is the sum of (add data points)
n = number of data points
x1 - xn = all of the measurements
(1 through n)
__
X represents the mean
Quantitative QC - Module 7 23
Standard Deviation (SD)
1
n
)
x
(x 2
1
SD 
 

SD is the principle measure of
variability used in the laboratory
Standard Deviation – Statistical Formula
Quantitative QC - Module 7 24
Standard Deviation and Probability
For a set of data with a normal
distribution, a random
measurement will fall within:
+ 1 SD 68.3% of the time
+ 2 SD 95.5% of the time
+ 3 SD 99.7% of the time
68.2%
95.5%
99.7%
Frequency -3s- 2s -1s Mean +1s +2s +3s
X
Quantitative QC - Module 7 25
Coefficient of Variation
The coefficient of variation (CV) is the SD expressed
as a percentage of the mean.
• CV is used to monitor precision
• CV is used to compare methods
• CV ideally should be less than 5%
%
100
x
mean
SD
CV 
Quantitative QC - Module 7 26
Levey-Jennings Chart
Graphically Representing Control
Ranges
Quantitative QC - Module 7 27
Statistics for Quantitative QC
 assay control material at least 20
data points over a 20-30 day period
 ensure procedural variation is
represented
 calculate mean and + 1, 2 and 3 SD
Quantitative QC - Module 7 28
Draw lines for Mean and SDs
(calculated from 20 controls)
MEAN
+1SD
+2SD
-1SD
-2SD
-3SD
+3SD
Days
190.5
192.5
194.5
196.5
188.5
186.5
184.6
Chart name: Lot number:
Quantitative QC - Module 7 29
Levey-Jennings Chart
MEAN
+1SD
+2SD
-1SD
-2SD
-3SD
+3SD
Days
192.5
194.5
196.5
188.5
186.5
184.6
1 2 3 4 5 6 7 8 9 10 11 12 13 14 15 16 17 18 19
190.5
Plot daily control measurements
Quantitative QC - Module 7 30
Number of Controls
Interpretation depends on number of controls
run with patients’ samples.
• Good: If one control:
– accept results if control is within ± 2SD
unless shift or trend
• Better: If 2 levels of controls
– apply Westgard multirule system
Quantitative QC - Module 7 31
Detecting error
• random error: variation in QC results with no
pattern- only a cause for rejection if outside
2SDs.
• systematic error: not acceptable, correct the
source of error
Examples:
– shift–control on one side of the mean 6 consecutive
days
– trend–control moving in one direction– heading
toward an “out of control” value
Quantitative QC - Module 7 32
Levey-Jennings Chart
Shift
MEAN
+1SD
+2SD
-1SD
-2SD
-3SD
+3SD
Days
190.5
192.5
194.5
196.5
188.5
186.5
184.6
Quantitative QC - Module 7 33
Levey-Jennings Chart
Trend
MEAN
+1SD
+2SD
-1SD
-2SD
-3SD
+3SD
Days
190.5
192.5
194.5
196.5
188.5
186.5
184.6
Westgard Rules
• “Multirule Quality Control”
• Uses a combination of decision criteria or control rules
• Allows determination of whether an analytical run is “in-
control” or “out-of-control”
(Generally used where 2 levels of control material are
analyzed per run)
12S rule
13S rule
22S rule
R4S rule
41S rule
10X rule
12S Rule = A warning to trigger careful inspection of
the control data
1 2 3 4 5 6 7 8 9 10 11 12 13 14 15 16 17 18 19 20 21 22 23 24
“warning rule”
One of two control results falls
outside ±2SD
Alerts tech to possible problems
Not cause for rejecting a run
Must then evaluate the 13S rule
Mean
Day
+1SD
+2SD
+3SD
-1SD
-2SD
-3SD
12S rule
violation
13S Rule = Reject the run when a single control measurement
exceeds the +3SD or -3SD control limit
1 2 3 4 5 6 7 8 9 10 11 12 13 14 15 16 17 18 19 20 21 22 23 24
Mean
Day
+1SD
+2SD
+3SD
-1SD
-2SD
-3SD
13S rule
violation
•If either of the two control
results falls outside of ±3SD,
rule is violated
•Run must be rejected
•If 13S not violated, check 22S
22S Rule = Reject the run when 2 consecutive control
measurements exceed the same
+2SD or -2SD control limit
1 2 3 4 5 6 7 8 9 10 11 12 13 14 15 16 17 18 19 20 21 22 23 24
Mean
Day
+1SD
+2SD
+3SD
-1SD
-2SD
-3SD
22S rule
violation
•2 consecutive control values for
the same level fall outside of
±2SD in the same direction,
or
•Both controls in the same run
exceed ±2SD
•Patient results cannot be
reported
•Requires corrective action
R4S Rule = Reject the run when 1 control
measurement exceed the +2SD and the other exceeds
the -2SD control limit
1 2 3 4 5 6 7 8 9 10 11 12 13 14 15 16 17 18 19 20 21 22 23 24
Mean
Day
+1SD
+2SD
+3SD
-1SD
-2SD
-3SD
R4S rule
violation
One control exceeds the
mean by –2SD, and the
other control exceeds the
mean by +2SD
The range between the two
results will therefore exceed
4 SD
Random error has occurred,
test run must be rejected
Westgard – 41S Rule
Requires control data from previous runs
Four consecutive QC results for one level of control are
outside ±1SD, or
Both levels of control have consecutive results that are
outside ±1SD
10x Rule = Reject the run when 10 consecutive control
measurements fall on one side of the mean
1 2 3 4 5 6 7 8 9 10 11 12 13 14 15 16 17 18 19 20 21 22 23 24
Mean
Day
+1SD
+2SD
+3SD
-1SD
-2SD
-3SD
10x rule
violation
Requires control data from previous runs
Ten consecutive QC results for one level of control are on one side of the mean,
or
Both levels of control have five consecutive results that are on the same side of
the mean
Westgard Multirule QC
When a rule is violated
• Warning rule = use other rules to inspect the
control points
• Rejection rule = “out of control”
–Stop testing
–Identify and correct problem
–Repeat testing on patient samples and
controls
–Do not report patient results until problem
is solved and controls indicate proper
performance
Quantitative QC - Module 7 43
When a rule is violated
• Warning rule = use other rules to
inspect the control points
• Rejection rule = “out of control”
–Stop testing
–Identify and correct problem
–Repeat testing on patient
samples and controls
–Do not report patient results
until problem is solved and
controls indicate proper
performance
External Quality Assessment
EQA results evaluate performance of the laboratory
against other laboratories participating in the same
Program
Different programs do this in different ways. Is used to test the
statistical significance of any difference between an individual lab’s
observed mean & the group mean
• When the difference is significant lab. is alerted
• EQA results should be formally documented within the lab and
should be available on request
90
Proficiency testing
Laboratories should all enroll and satisfactorily participate in a
performance evaluation/assessment program
If proficiency testing is not available, the
laborat ory must exercise an alt ernat ive performance
assessment system for determining the reliability of
analytic testing (sample splitting for inter-laboratory
testing)
If the lab has more than one method-system for
performing tests for an analyte, it must be checked
against each ot her at least twice a year for correlat ion of
patient results
92

medical -laboratory- quality- control --

  • 3.
    What is QualityControl? Quality control in the medical laboratory it is statistical process used to monitor and evaluate the analytical process that produces patient results. QC results are used to validate whether the instrument is operating within pre-defined specifications, means that patient results are reliable, and can be used for diagnosis, prognosis and treatment
  • 4.
    QUALITY: A DEGREEOF EXCELLENCE • QUALITY CONTROL (INTER.) + QUALITYASSESSMENT • (EXTR.) QUALITY ASSURANCE 20
  • 5.
    QCv/sQA Quality Control -QCrefers to operational techniques that must be included during assay run to verify that the requirementseach for Quality are met wit h Quality Assurance - QA refers to all those planned and systematic activities to provide confidence that the results given out by the laboratory are correct The aim of QC is simply to ensure that the results generated by the test are correct. However quality assurance is concerned with much more: that the right test is carried out on the right specimen and that the right result and right interpretation is delivered to the right person at the right time 23 •
  • 6.
    QUALITY ASSURANCE (QA) •The purpose of QA is the maintenance of the overall quality of patient results • All factors that the test effect the test results from the time Post-analytic • Pre-analytic Analytic • • Result accuracy Analytical errors Assay repeat rates Specimen collection Specimen transport Specimen quality 24 Result reporting Record keeping for patient and QC
  • 8.
    How to implementa QC program? – Establish written policies and procedures – Assign responsibility for monitoring and reviewing – Train staff – Obtain control materials – Collect data – Set target values (mean, SD) – Establish Levey-Jennings charts – Routinely plot control data – Establish and implement troubleshooting and corrective action protocols – Establish and maintain system for documentation
  • 10.
    Quantitative QC -Module 7 10 Calibrators vs. Controls
  • 11.
    Quantitative QC -Module 7 11 Calibrators A substance with a specific concentration. Used to adjust instrument, kit, test system in order to standardize the assay Calibrators are used to set (calibrate) the measuring points on a scale. Sometimes called a standard, although usually not a true standard and not a control Controls Known concentration of the analyte Use 2 or three levels of controls A substance similar to patients’ samples that has an established concentration. Controls are used to Ensure the procedure is working properly. 1 2 3 4 5 1 2 3 4 5
  • 12.
    Quantitative QC -Module 7 12 Control Materials ASSAYED Target value predetermined Verify and use UNASSAYED Target value not predetermined Full assay required before using “IN-HOUSE” In-house pooled sera Full assay, validation
  • 13.
    Quantitative QC -Module 7 13 Choosing Control Materials • values cover medical decision points • similar to the test sample • controls are usually available in high, normal, and low ranges
  • 14.
    Quantitative QC -Module 7 14 Preparation and Storage of Control Material • adhere to manufacturer’s instructions • keep adequate amount of same lot number • store correctly CONTROL CONTROL
  • 15.
    Quantitative QC -Module 7 15 Steps in Implementing Quantitative QC • obtain control material • run each control 20 times over 30 days • calculate mean and +/-1,2,3 Standard Deviations Mean 1SD 1SD 2SD 3SD 2SD 3SD
  • 16.
    Quantitative QC -Module 7 16 Measurement of Variability Variability is a normal occurrence when a control is tested repeatedly Affected by: Operator technique Environmental conditions Performance characteristics of the measurement The goal is to differentiate between variability due to chance from that due to error
  • 17.
    Control Charts • Acommon method to compare the values observed for control control Simple materials with their known values is the use of charts graphical displays in which the observed values are • plotted versus the time when the observations are made Known values are represented by an acceptable range of values • • When plotted points falls is performing properly When point s falls out side developing within the control limit- method • control limit - problem may be 73
  • 18.
    Quantitative QC -Module 7 18 Accuracy and Precision Accuracy closeness of measurements to the true value Precision amount of variation in the measurements Bias The difference between the expectation of a test result and an accepted reference value
  • 19.
    19 Measures of CentralTendency Mode the value which occurs with the greatest frequency Median the value at the center or midpoint of the observations Mean the calculated average of the values
  • 20.
    Quantitative QC -Module 7 20 Measures of Central Tendency Although variable, sets of data are distributed around a central value Measurement F r e q u e n c y
  • 21.
    Quantitative QC -Module 7 21 Not all central values are the same Mode Median Mean Measurement F r e q u e n c y
  • 22.
    Quantitative QC -Module 7 22 Symbols Used in Calculations ∑ is the sum of (add data points) n = number of data points x1 - xn = all of the measurements (1 through n) __ X represents the mean
  • 23.
    Quantitative QC -Module 7 23 Standard Deviation (SD) 1 n ) x (x 2 1 SD     SD is the principle measure of variability used in the laboratory Standard Deviation – Statistical Formula
  • 24.
    Quantitative QC -Module 7 24 Standard Deviation and Probability For a set of data with a normal distribution, a random measurement will fall within: + 1 SD 68.3% of the time + 2 SD 95.5% of the time + 3 SD 99.7% of the time 68.2% 95.5% 99.7% Frequency -3s- 2s -1s Mean +1s +2s +3s X
  • 25.
    Quantitative QC -Module 7 25 Coefficient of Variation The coefficient of variation (CV) is the SD expressed as a percentage of the mean. • CV is used to monitor precision • CV is used to compare methods • CV ideally should be less than 5% % 100 x mean SD CV 
  • 26.
    Quantitative QC -Module 7 26 Levey-Jennings Chart Graphically Representing Control Ranges
  • 27.
    Quantitative QC -Module 7 27 Statistics for Quantitative QC  assay control material at least 20 data points over a 20-30 day period  ensure procedural variation is represented  calculate mean and + 1, 2 and 3 SD
  • 28.
    Quantitative QC -Module 7 28 Draw lines for Mean and SDs (calculated from 20 controls) MEAN +1SD +2SD -1SD -2SD -3SD +3SD Days 190.5 192.5 194.5 196.5 188.5 186.5 184.6 Chart name: Lot number:
  • 29.
    Quantitative QC -Module 7 29 Levey-Jennings Chart MEAN +1SD +2SD -1SD -2SD -3SD +3SD Days 192.5 194.5 196.5 188.5 186.5 184.6 1 2 3 4 5 6 7 8 9 10 11 12 13 14 15 16 17 18 19 190.5 Plot daily control measurements
  • 30.
    Quantitative QC -Module 7 30 Number of Controls Interpretation depends on number of controls run with patients’ samples. • Good: If one control: – accept results if control is within ± 2SD unless shift or trend • Better: If 2 levels of controls – apply Westgard multirule system
  • 31.
    Quantitative QC -Module 7 31 Detecting error • random error: variation in QC results with no pattern- only a cause for rejection if outside 2SDs. • systematic error: not acceptable, correct the source of error Examples: – shift–control on one side of the mean 6 consecutive days – trend–control moving in one direction– heading toward an “out of control” value
  • 32.
    Quantitative QC -Module 7 32 Levey-Jennings Chart Shift MEAN +1SD +2SD -1SD -2SD -3SD +3SD Days 190.5 192.5 194.5 196.5 188.5 186.5 184.6
  • 33.
    Quantitative QC -Module 7 33 Levey-Jennings Chart Trend MEAN +1SD +2SD -1SD -2SD -3SD +3SD Days 190.5 192.5 194.5 196.5 188.5 186.5 184.6
  • 34.
    Westgard Rules • “MultiruleQuality Control” • Uses a combination of decision criteria or control rules • Allows determination of whether an analytical run is “in- control” or “out-of-control” (Generally used where 2 levels of control material are analyzed per run) 12S rule 13S rule 22S rule R4S rule 41S rule 10X rule
  • 35.
    12S Rule =A warning to trigger careful inspection of the control data 1 2 3 4 5 6 7 8 9 10 11 12 13 14 15 16 17 18 19 20 21 22 23 24 “warning rule” One of two control results falls outside ±2SD Alerts tech to possible problems Not cause for rejecting a run Must then evaluate the 13S rule Mean Day +1SD +2SD +3SD -1SD -2SD -3SD 12S rule violation
  • 36.
    13S Rule =Reject the run when a single control measurement exceeds the +3SD or -3SD control limit 1 2 3 4 5 6 7 8 9 10 11 12 13 14 15 16 17 18 19 20 21 22 23 24 Mean Day +1SD +2SD +3SD -1SD -2SD -3SD 13S rule violation •If either of the two control results falls outside of ±3SD, rule is violated •Run must be rejected •If 13S not violated, check 22S
  • 37.
    22S Rule =Reject the run when 2 consecutive control measurements exceed the same +2SD or -2SD control limit 1 2 3 4 5 6 7 8 9 10 11 12 13 14 15 16 17 18 19 20 21 22 23 24 Mean Day +1SD +2SD +3SD -1SD -2SD -3SD 22S rule violation •2 consecutive control values for the same level fall outside of ±2SD in the same direction, or •Both controls in the same run exceed ±2SD •Patient results cannot be reported •Requires corrective action
  • 38.
    R4S Rule =Reject the run when 1 control measurement exceed the +2SD and the other exceeds the -2SD control limit 1 2 3 4 5 6 7 8 9 10 11 12 13 14 15 16 17 18 19 20 21 22 23 24 Mean Day +1SD +2SD +3SD -1SD -2SD -3SD R4S rule violation One control exceeds the mean by –2SD, and the other control exceeds the mean by +2SD The range between the two results will therefore exceed 4 SD Random error has occurred, test run must be rejected
  • 39.
    Westgard – 41SRule Requires control data from previous runs Four consecutive QC results for one level of control are outside ±1SD, or Both levels of control have consecutive results that are outside ±1SD
  • 40.
    10x Rule =Reject the run when 10 consecutive control measurements fall on one side of the mean 1 2 3 4 5 6 7 8 9 10 11 12 13 14 15 16 17 18 19 20 21 22 23 24 Mean Day +1SD +2SD +3SD -1SD -2SD -3SD 10x rule violation Requires control data from previous runs Ten consecutive QC results for one level of control are on one side of the mean, or Both levels of control have five consecutive results that are on the same side of the mean
  • 41.
  • 42.
    When a ruleis violated • Warning rule = use other rules to inspect the control points • Rejection rule = “out of control” –Stop testing –Identify and correct problem –Repeat testing on patient samples and controls –Do not report patient results until problem is solved and controls indicate proper performance
  • 43.
    Quantitative QC -Module 7 43 When a rule is violated • Warning rule = use other rules to inspect the control points • Rejection rule = “out of control” –Stop testing –Identify and correct problem –Repeat testing on patient samples and controls –Do not report patient results until problem is solved and controls indicate proper performance
  • 44.
    External Quality Assessment EQAresults evaluate performance of the laboratory against other laboratories participating in the same Program Different programs do this in different ways. Is used to test the statistical significance of any difference between an individual lab’s observed mean & the group mean • When the difference is significant lab. is alerted • EQA results should be formally documented within the lab and should be available on request 90
  • 45.
    Proficiency testing Laboratories shouldall enroll and satisfactorily participate in a performance evaluation/assessment program If proficiency testing is not available, the laborat ory must exercise an alt ernat ive performance assessment system for determining the reliability of analytic testing (sample splitting for inter-laboratory testing) If the lab has more than one method-system for performing tests for an analyte, it must be checked against each ot her at least twice a year for correlat ion of patient results 92