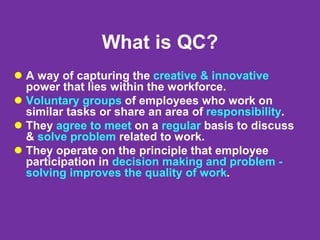
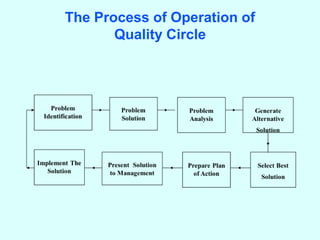
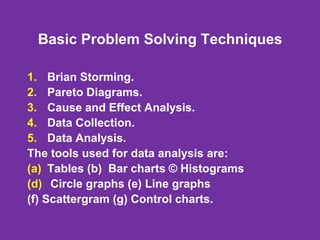
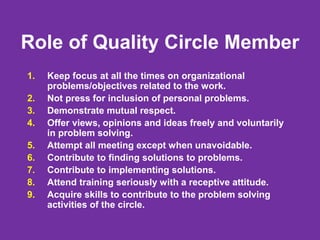
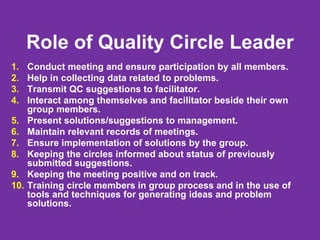
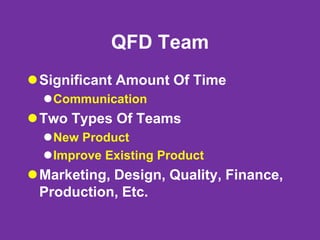
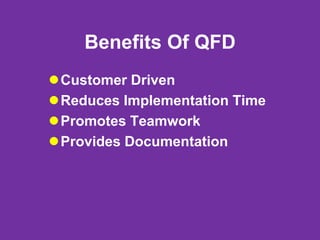
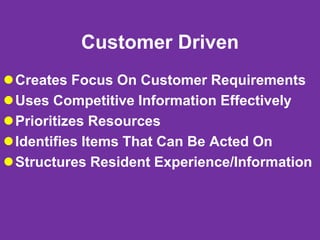
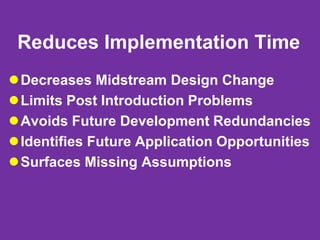
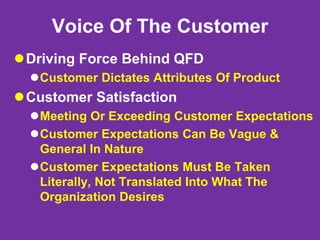
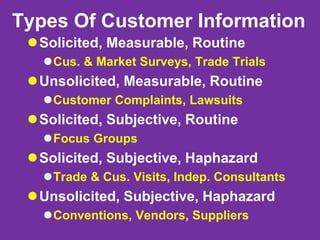
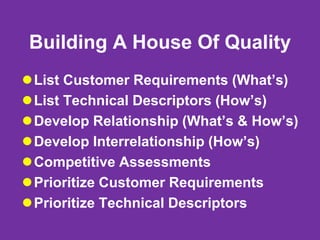
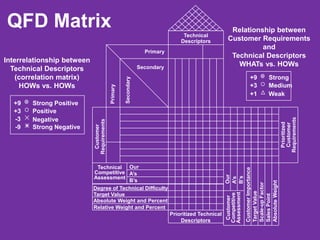
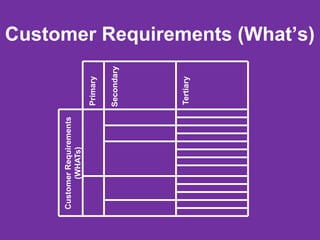
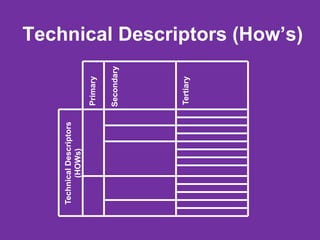
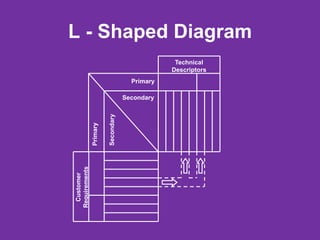
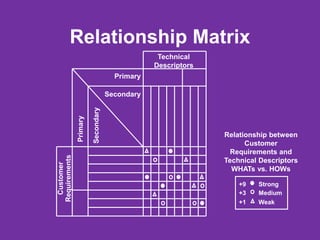
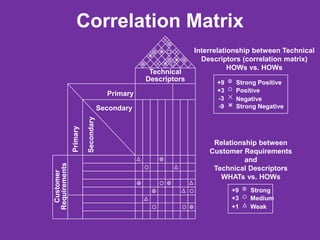
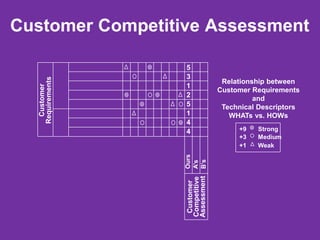
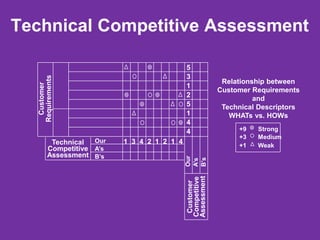
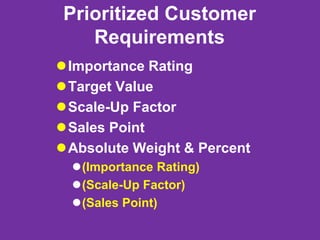
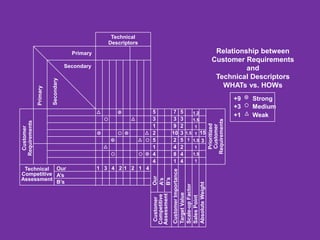
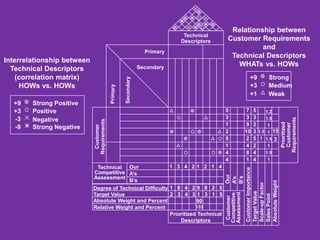
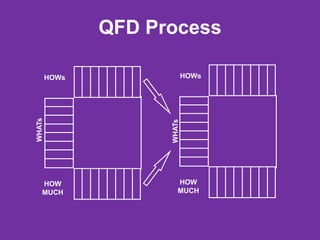
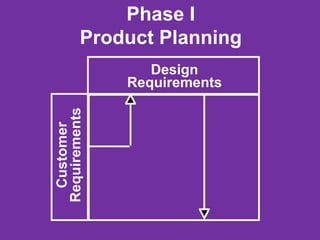
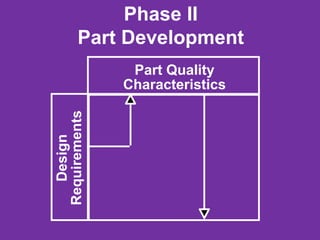
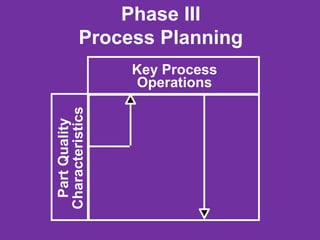
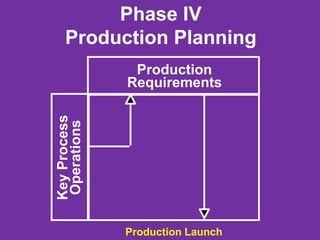
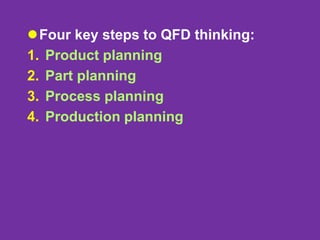
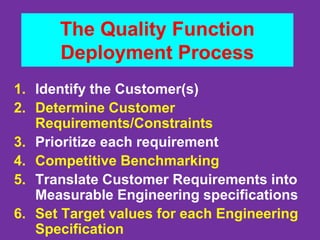
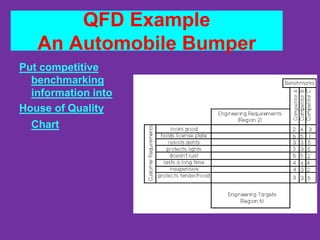
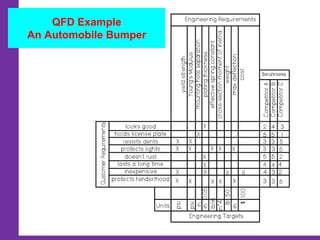
Unit 4
TQM TOOLS & TECHNIQUES II
Quality circles – Quality Function Deployment –
Taguchi quality loss function – TPM – Concepts,
improvement needs – Cost of Quality – Performance
measures
CO5. Familiarize Quality circles and QFD
Quality Circles (QC)
What is QC?
 A way of capturing the creative & innovative
power that lies within the workforce.
 Voluntary groups of employees who work on
similar tasks or share an area of responsibility.
 They agree to meet on a regular basis to discuss
& solve problem related to work.
 They operate on the principle that employee
participation in decision making and problem -
solving improves the quality of work.
How do QCs work?
 Characteristics
 Volunteers
 Set rules & priorities
 Decision Made by consensus
 Use of organized approaches to problem solving.
 All members of QC need to receiving training
 Members need to be empowered
 Members need to have the support of Senior
Management.
How can they be used in an
organization?
Increase productivity
Improve Quality
Boost employee morale
Quality Circles - Origin
 Defeat of Japan in 2nd World war
 Socio- Economics reconstruction
 Severe Constraints of high population density
 Lack of natural resources, compulsorily dependent on
import of fuel, food energy and raw materials required
for industries.
 Solution was only to ‘Export’
 For Export, you need superior quality
 Superior Quality comes through high technological
investment
 Superior Quality also comes through small but
continuous ways of working.
The Pre-requisites for QCs
 Belief that people will take pride & interest in then work
if they experience autonomy and content over the
decisions that affect them.
 Employees sense of belongingness
 A belief that each employee desires to participate in
making the organization a better place
 Recognition of the importance of development of human
resources.
 A willingness to allow people to volunteer their time &
effort for the performance of the organization
 An involved & respected employee is a productive
employee.
Concepts of QC
This is based on
Human Resource is a key factor in
Quality & Productivity
It implies the development of skills,
capabilities, confidence & creativity
of the people
Concepts of QC
Through the cumulative process of
 Education
 Training
 Work Experience
 Participation
 Team work / Collective effort
 Sustaining the motivation
 Commitment
Towards
“ Work Excellence”
Scope of Quality Circles
 QCs are not limited to Manufacturing only
 QCs are applicable where there is scope for
group based solutions of work related
problems
 QCs are relevant for factories, firms, schools,
hospitals, Universities, Banks, Research
Institutes, Govt. Office, Homes etc..
 Not limited to the narrow definition of Quality
 It is concerned with Total Customer
Satisfaction
Quality Circles Structure
Steering
Committee
Coordinator
Q. C. Facilitator Q. C. Facilitator Q. C. Facilitator
Circle
Leader
Circle
Leader
Circle
Leader
Circle
Member
Circle
Member
Circle
Member
The Process of Operation of
Quality Circle
Basic Problem Solving Techniques
1. Brian Storming.
2. Pareto Diagrams.
3. Cause and Effect Analysis.
4. Data Collection.
5. Data Analysis.
The tools used for data analysis are:
(a) Tables (b) Bar charts © Histograms
(d) Circle graphs (e) Line graphs
(f) Scattergram (g) Control charts.
Role of Quality Circle Member
1. Keep focus at all the times on organizational
problems/objectives related to the work.
2. Not press for inclusion of personal problems.
3. Demonstrate mutual respect.
4. Offer views, opinions and ideas freely and voluntarily
in problem solving.
5. Attempt all meeting except when unavoidable.
6. Contribute to finding solutions to problems.
7. Contribute to implementing solutions.
8. Attend training seriously with a receptive attitude.
9. Acquire skills to contribute to the problem solving
activities of the circle.
Role of Quality Circle Leader
1. Conduct meeting and ensure participation by all members.
2. Help in collecting data related to problems.
3. Transmit QC suggestions to facilitator.
4. Interact among themselves and facilitator beside their own
group members.
5. Present solutions/suggestions to management.
6. Maintain relevant records of meetings.
7. Ensure implementation of solutions by the group.
8. Keeping the circles informed about status of previously
submitted suggestions.
9. Keeping the meeting positive and on track.
10. Training circle members in group process and in the use of
tools and techniques for generating ideas and problem
solutions.
Role of Facilitator
1. Co-ordinate the work of several QC’s through leaders.
2. Serve as a resource to the group/circle.
3. Arrange for expertise from other groups/agencies.
4. Keep the circles on track and enthusiastic.
5. Acquire skills through training programmes.
6. Transfer skills to members of QC’s.
7. Transmit proposals/solutions to management.
8. Arrange for training of QC members.
9. Provide feed back to members.
10. Provide feedback to management.
11. Maintain budgets and keep cost records.
12. Help circles to provide presentation to management.
The Facilitator should have the
following qualities
1. He must be able to train QC leaders and members in
QC techniques.
2. He must have leadership qualities and organizational
abilities in participative management.
3. He must have skills to motivate people maintain
enthusiasm and keep QC’s on track.
4. He must be able to express his ideas and QC
philosophy both written and verbal.
5. He must be able to plan, organise and conduct meeting
and make presentation to management.
6. He must have ability to contact and gain support from
all levels of management.
Launching of Quality Circles
1. Expose middle level executives to the concept and ask
them if there are any area under their purview where
they think the climate is conducive to the starting of
quality circles.
2. Explain the concept to the employees in such identified
areas and invite them to volunteer as members of quality
circles.
3. Nominate Senior officers as facilitator for each area.
4. Form a steering committee for directing the
programmes’ activities in the organization. It establishes
the objectives, policies, activities and composition of
quality circles. It may consist of a Chief Executive as the
chairman and the Departmental Heads as members
along with facilitators from each area.
Launching of Quality Circles
5. Arrange training of co-ordinators, facilitators in basics
of QC approach, implementation, techniques, and
operation. Later facilitator may provide training to circle
leaders. Circle leaders and facilitator train the circle
members.
6. A meeting should be fixed by facilitators, preferably one
hour a week for the quality circles to meet.
7. Formally inaugurate the quality circles.
8. Arrange the necessary facilities for the quality circle
meeting and its operation.
Advantage of Quality Circles
The organization can accomplish one or more of the
following advantages by establishing Quality Circle:
 Promote high level of productivity and quality-
mindedness.
 Self and mutual development pf employees.
 Creating team spirit and unity of action.
 Increased motivation, job satisfaction and pride in their
work.
 Reduced absenteeism and labour turnover.
 Developing sense of belongingness towards a particular
organisation.
 Waste Reduction.
Advantage of Quality Circles
8. Cost Reduction.
9. Improved communication.
10. Safety improvement.
11. Increased utilization of human resource potential.
12. Enhancement in consciousness and moral of
employees through recognition of their activities.
13. Leadership development.
14. Trained staff.
15. Identifies work related problems and solves them
effectively.
Limitations of Quality Circles
1. The overall productivity may decrease initially.
2. A large investment of time and money may be required.
3. The chance of errors increases initially.
4. Over-expectation of some employees who are too excited
initially may turn to disappointment and drop out.
5. Quality circles may threaten traditional authority structure.
6. Employees who are habituated to depend on their
supervisors for direction and who have lost their initiative feel
uncomfortable with Quality Circles.
7. After circle implementation, a period of confusion may arise.
This is because people experiment with new ideas, new skills
and new roles.
8. Changes in system and control may become necessary.
Quality
Function
Deployment
(QFD)
Quality Function Deployment (QFD)
QFD is a rigorous method for
translating customer needs, wants, and
wishes into step-by-step procedures
for delivering the product or service.
While delivering better designs tailored
to customer needs, Quality Function
Deployment also cuts the normal
development cycle by 50%, making you
faster to market.
QFD Team
Significant Amount Of Time
Communication
Two Types Of Teams
New Product
Improve Existing Product
Marketing, Design, Quality, Finance,
Production, Etc.
Benefits Of QFD
Customer Driven
Reduces Implementation Time
Promotes Teamwork
Provides Documentation
Customer Driven
Creates Focus On Customer Requirements
Uses Competitive Information Effectively
Prioritizes Resources
Identifies Items That Can Be Acted On
Structures Resident Experience/Information
Reduces Implementation Time
Decreases Midstream Design Change
Limits Post Introduction Problems
Avoids Future Development Redundancies
Identifies Future Application Opportunities
Surfaces Missing Assumptions
Promotes Teamwork
Based On Consensus
Creates Communication At Interfaces
Identifies Actions At Interfaces
Creates Global View-Out Of Details
Provides Documentation
Documents Rationale For Design
Is Easy To Assimilate
Adds Structure To The Information
Adapts To Changes (Living Document)
Provides Framework For Sensitivity
Analysis
Voice Of The Customer
Driving Force Behind QFD
Customer Dictates Attributes Of Product
Customer Satisfaction
Meeting Or Exceeding Customer Expectations
Customer Expectations Can Be Vague &
General In Nature
Customer Expectations Must Be Taken
Literally, Not Translated Into What The
Organization Desires
Collecting Customer
Information
What Does Customer Really Want ?
What Are Customer’s Expectations ?
Are Customer’s Expectations Used
To Drive Design Process ?
What Can Design Team Do To
Achieve Customer Satisfaction?
Types Of Customer Information
Solicited, Measurable, Routine
Cus. & Market Surveys, Trade Trials
Unsolicited, Measurable, Routine
Customer Complaints, Lawsuits
Solicited, Subjective, Routine
Focus Groups
Solicited, Subjective, Haphazard
Trade & Cus. Visits, Indep. Consultants
Unsolicited, Subjective, Haphazard
Conventions, Vendors, Suppliers
House Of Quality
Technical Descriptors
(Voice of the organization)
Prioritized Technical
Descriptors
Interrelationship
between
Technical Descriptors
Customer
Requirements
(Voice
of
the
Customer)
Prioritized
Customer
Requirements
Relationship between
Requirements and
Descriptors
Building A House Of Quality
List Customer Requirements (What’s)
List Technical Descriptors (How’s)
Develop Relationship (What’s & How’s)
Develop Interrelationship (How’s)
Competitive Assessments
Prioritize Customer Requirements
Prioritize Technical Descriptors
QFD Matrix
Absolute Weight and Percent
Prioritized Technical
Descriptors
Degree of Technical Difficulty
Relative Weight and Percent
Target Value
Customer
Requirements
Prioritized
Customer
Requirements
Technical
Descriptors
Primary
Primary
Secondary
Secondary
Technical
Competitive
Assessment
Customer
Competitive
Assessment
Our
A’s
B’s
Customer
Importance
Target
Value
Scale-up
Factor
Sales
Point
Absolute
Weight
Our
A’s
B’s
Relationship between
Customer Requirements
and
Technical Descriptors
WHATs vs. HOWs
Strong
Medium
Weak
+9
+3
+1
Strong Positive
Positive
Negative
Strong Negative
+9
+3
-3
-9
Interrelationship between
Technical Descriptors
(correlation matrix)
HOWs vs. HOWs
Customer Requirements (What’s)
Customer
Requirements
(WHATs)
Primary
Secondary
Tertiary
Technical Descriptors (How’s)
Technical
Descriptors
(HOWs)
Primary
Secondary
Tertiary
L - Shaped Diagram
Customer
Requirements
Technical
Descriptors
Primary
Primary
Secondary
Secondary
Relationship Matrix
Customer
Requirements
Technical
Descriptors
Primary
Primary
Secondary Secondary
Relationship between
Customer
Requirements and
Technical Descriptors
WHATs vs. HOWs
Strong
Medium
Weak
+9
+3
+1
Correlation Matrix
Customer
Requirements
Technical
Descriptors
Primary
Primary
Secondary
Secondary
Relationship between
Customer Requirements
and
Technical Descriptors
WHATs vs. HOWs
Strong Positive
Positive
Negative
Strong Negative
+9
+3
-3
-9
Interrelationship between Technical
Descriptors (correlation matrix)
HOWs vs. HOWs
Strong
Medium
Weak
+9
+3
+1
Customer Competitive Assessment
Customer
Requirements
Customer
Competitive
Assessment
Ours
A’s
B’s
5
3
1
2
5
1
4
4
Relationship between
Customer Requirements
and
Technical Descriptors
WHATs vs. HOWs
Strong
Medium
Weak
+9
+3
+1
1 3 4 2 1 2 1 4
Technical Competitive Assessment
Customer
Requirements
Customer
Competitive
Assessment
Our
A’s
B’s
5
3
1
2
5
1
4
4
Relationship between
Customer Requirements
and
Technical Descriptors
WHATs vs. HOWs
Strong
Medium
Weak
+9
+3
+1
Technical
Competitive
Assessment
Our
A’s
B’s
Prioritized Customer
Requirements
Importance Rating
Target Value
Scale-Up Factor
Sales Point
Absolute Weight & Percent
(Importance Rating)
(Scale-Up Factor)
(Sales Point)
7
3
9
10
2
4
8
1
Customer
Requirements
Prioritized
Customer
Requirements
Technical
Descriptors
Primary
Primary
Secondary
Secondary
Technical
Competitive
Assessment
Customer
Competitive
Assessment
Our
A’s
B’s
Customer
Importance
Target
Value
Scale-up
Factor
Sales
Point
Absolute
Weight
1 3 4 2 1 2 1 4
5
3
1
2
5
1
4
4
5
3
2
3
5
2
4
4
1.5
1
1.2
1.5
1
1
1.5
1
1.5
1
15
3
Our
A’s
B’s
Relationship between
Customer Requirements
and
Technical Descriptors
WHATs vs. HOWs
Strong
Medium
Weak
+9
+3
+1
Absolute Weight and Percent
Prioritized Technical
Descriptors
Degree of Technical Difficulty
Relative Weight and Percent
Target Value
1 8 4 2 9 8 2 5
90
133
2 3 4 3 1 3 1 5
7
3
9
10
2
4
8
1
Customer
Requirements
Prioritized
Customer
Requirements
Technical
Descriptors
Primary
Primary
Secondary
Secondary
Technical
Competitive
Assessment
Customer
Competitive
Assessment
Our
A’s
B’s
Customer
Importance
Target
Value
Scale-up
Factor
Sales
Point
Absolute
Weight
1 3 4 2 1 2 1 4
5
3
1
2
5
1
4
4
5
3
2
3
5
2
4
4
1.5
1
1.2
1.5
1
1
1.5
1
1.5
1
15
3
Our
A’s
B’s
Relationship between
Customer Requirements
and
Technical Descriptors
WHATs vs. HOWs
Strong
Medium
Weak
+9
+3
+1
Strong Positive
Positive
Negative
Strong Negative
+9
+3
-3
-9
Interrelationship between
Technical Descriptors
(correlation matrix)
HOWs vs. HOWs
QFD Process
WHATs
HOW
MUCH
HOWs
WHATs
HOW
MUCH
HOWs
Phase I
Product Planning
Design
Requirements
Customer
Requirements
Phase II
Part Development
Part Quality
Characteristics
Design
Requirements
Phase III
Process Planning
Key Process
Operations
Part
Quality
Characteristics
Phase IV
Production Planning
Production
Requirements
Key
Process
Operations
Production Launch
Four key steps to QFD thinking:
1. Product planning
2. Part planning
3. Process planning
4. Production planning
Product Planning
1. Translating what the customer wants (in
their language, e.g., portable, convenient
phone service) into a list of prioritized
product/service design requirements (in
your language, e.g., cell phones) that
describes how the product works. It also
compares your performance with your
competition's, and sets targets for
improvement to differentiate your
product/service from your competitor's.
2. Part Planning
Translating product specifications
(design criteria from step 1) into part
characteristics (e.g., light weight, belt-
clip, battery-driven, not-hardwired but
radio-frequency based).
3. Process Planning
Translating part characteristics (from step
2) into optimal process characteristics that
maximize your ability to deliver Six Sigma
quality (e.g., ability to "hand off" a cellular
call from one antenna to another without
interruption).
4. Production Planning
Translating process characteristics (from
step 3) into manufacturing or service
delivery methods that will optimize your
ability to deliver Six Sigma quality in the
most efficient manner (e.g., cellular
antennas installed with overlapping
coverage to eliminate dropped calls).
The Quality Function
Deployment Process
1. Identify the Customer(s)
2. Determine Customer
Requirements/Constraints
3. Prioritize each requirement
4. Competitive Benchmarking
5. Translate Customer Requirements into
Measurable Engineering specifications
6. Set Target values for each Engineering
Specification
QFD Example
An Automobile Bumper
Customer Request:
There is too much
damage to bumpers in
low-speed collisions.
Customer wants a
better bumper.
QFD Example
An Automobile Bumper
Step 1: Identify Customer(s)
Repair Department
Automobile Owner
Manufacturing Plant
Sales Force
QFD Example
An Automobile Bumper
Step 2: Determine Customer
Requirements/Constraints
I want something that looks nice (basic)
It must hold my license plate
(performance)
I want it strong enough not to dent
(excitement)
It must protect my tail-lights and head-
lights (performance)
I don’t want to pay too much (basic)
QFD Example
An Automobile Bumper
Step 3: Prioritize Customer Requirements
QFD Example
An Automobile Bumper
Put prioritized
Customer
Requirements into
a House of Quality
Chart
QFD Example
An Automobile Bumper
Step 4: Competition Benchmarking
Identify Competitors
Test and Analyze Competitor Products
Reverse Engineer Competitor Products
Rate Competitor Products against
customer requirements/constraints
QFD Example
An Automobile Bumper
Put competitive
benchmarking
information into
House of Quality
Chart
QFD Example
An Automobile Bumper
Steps 5 and 6: Translate Customer
Requirements into Measurable
Engineering Specifications and
define target values
Specify how license plate will be held
Specify how to resist dents through
material yield strength, young's
modulus, etc.
Specify with a dollar amount the term
‘inexpensive’
QFD Example
An Automobile Bumper

unit 4.ppt

  • 1.
    Unit 4 TQM TOOLS& TECHNIQUES II Quality circles – Quality Function Deployment – Taguchi quality loss function – TPM – Concepts, improvement needs – Cost of Quality – Performance measures CO5. Familiarize Quality circles and QFD
  • 2.
  • 3.
    What is QC? A way of capturing the creative & innovative power that lies within the workforce.  Voluntary groups of employees who work on similar tasks or share an area of responsibility.  They agree to meet on a regular basis to discuss & solve problem related to work.  They operate on the principle that employee participation in decision making and problem - solving improves the quality of work.
  • 4.
    How do QCswork?  Characteristics  Volunteers  Set rules & priorities  Decision Made by consensus  Use of organized approaches to problem solving.  All members of QC need to receiving training  Members need to be empowered  Members need to have the support of Senior Management.
  • 5.
    How can theybe used in an organization? Increase productivity Improve Quality Boost employee morale
  • 6.
    Quality Circles -Origin  Defeat of Japan in 2nd World war  Socio- Economics reconstruction  Severe Constraints of high population density  Lack of natural resources, compulsorily dependent on import of fuel, food energy and raw materials required for industries.  Solution was only to ‘Export’  For Export, you need superior quality  Superior Quality comes through high technological investment  Superior Quality also comes through small but continuous ways of working.
  • 7.
    The Pre-requisites forQCs  Belief that people will take pride & interest in then work if they experience autonomy and content over the decisions that affect them.  Employees sense of belongingness  A belief that each employee desires to participate in making the organization a better place  Recognition of the importance of development of human resources.  A willingness to allow people to volunteer their time & effort for the performance of the organization  An involved & respected employee is a productive employee.
  • 8.
    Concepts of QC Thisis based on Human Resource is a key factor in Quality & Productivity It implies the development of skills, capabilities, confidence & creativity of the people
  • 9.
    Concepts of QC Throughthe cumulative process of  Education  Training  Work Experience  Participation  Team work / Collective effort  Sustaining the motivation  Commitment Towards “ Work Excellence”
  • 10.
    Scope of QualityCircles  QCs are not limited to Manufacturing only  QCs are applicable where there is scope for group based solutions of work related problems  QCs are relevant for factories, firms, schools, hospitals, Universities, Banks, Research Institutes, Govt. Office, Homes etc..  Not limited to the narrow definition of Quality  It is concerned with Total Customer Satisfaction
  • 11.
    Quality Circles Structure Steering Committee Coordinator Q.C. Facilitator Q. C. Facilitator Q. C. Facilitator Circle Leader Circle Leader Circle Leader Circle Member Circle Member Circle Member
  • 12.
    The Process ofOperation of Quality Circle
  • 13.
    Basic Problem SolvingTechniques 1. Brian Storming. 2. Pareto Diagrams. 3. Cause and Effect Analysis. 4. Data Collection. 5. Data Analysis. The tools used for data analysis are: (a) Tables (b) Bar charts © Histograms (d) Circle graphs (e) Line graphs (f) Scattergram (g) Control charts.
  • 14.
    Role of QualityCircle Member 1. Keep focus at all the times on organizational problems/objectives related to the work. 2. Not press for inclusion of personal problems. 3. Demonstrate mutual respect. 4. Offer views, opinions and ideas freely and voluntarily in problem solving. 5. Attempt all meeting except when unavoidable. 6. Contribute to finding solutions to problems. 7. Contribute to implementing solutions. 8. Attend training seriously with a receptive attitude. 9. Acquire skills to contribute to the problem solving activities of the circle.
  • 15.
    Role of QualityCircle Leader 1. Conduct meeting and ensure participation by all members. 2. Help in collecting data related to problems. 3. Transmit QC suggestions to facilitator. 4. Interact among themselves and facilitator beside their own group members. 5. Present solutions/suggestions to management. 6. Maintain relevant records of meetings. 7. Ensure implementation of solutions by the group. 8. Keeping the circles informed about status of previously submitted suggestions. 9. Keeping the meeting positive and on track. 10. Training circle members in group process and in the use of tools and techniques for generating ideas and problem solutions.
  • 16.
    Role of Facilitator 1.Co-ordinate the work of several QC’s through leaders. 2. Serve as a resource to the group/circle. 3. Arrange for expertise from other groups/agencies. 4. Keep the circles on track and enthusiastic. 5. Acquire skills through training programmes. 6. Transfer skills to members of QC’s. 7. Transmit proposals/solutions to management. 8. Arrange for training of QC members. 9. Provide feed back to members. 10. Provide feedback to management. 11. Maintain budgets and keep cost records. 12. Help circles to provide presentation to management.
  • 17.
    The Facilitator shouldhave the following qualities 1. He must be able to train QC leaders and members in QC techniques. 2. He must have leadership qualities and organizational abilities in participative management. 3. He must have skills to motivate people maintain enthusiasm and keep QC’s on track. 4. He must be able to express his ideas and QC philosophy both written and verbal. 5. He must be able to plan, organise and conduct meeting and make presentation to management. 6. He must have ability to contact and gain support from all levels of management.
  • 18.
    Launching of QualityCircles 1. Expose middle level executives to the concept and ask them if there are any area under their purview where they think the climate is conducive to the starting of quality circles. 2. Explain the concept to the employees in such identified areas and invite them to volunteer as members of quality circles. 3. Nominate Senior officers as facilitator for each area. 4. Form a steering committee for directing the programmes’ activities in the organization. It establishes the objectives, policies, activities and composition of quality circles. It may consist of a Chief Executive as the chairman and the Departmental Heads as members along with facilitators from each area.
  • 19.
    Launching of QualityCircles 5. Arrange training of co-ordinators, facilitators in basics of QC approach, implementation, techniques, and operation. Later facilitator may provide training to circle leaders. Circle leaders and facilitator train the circle members. 6. A meeting should be fixed by facilitators, preferably one hour a week for the quality circles to meet. 7. Formally inaugurate the quality circles. 8. Arrange the necessary facilities for the quality circle meeting and its operation.
  • 20.
    Advantage of QualityCircles The organization can accomplish one or more of the following advantages by establishing Quality Circle:  Promote high level of productivity and quality- mindedness.  Self and mutual development pf employees.  Creating team spirit and unity of action.  Increased motivation, job satisfaction and pride in their work.  Reduced absenteeism and labour turnover.  Developing sense of belongingness towards a particular organisation.  Waste Reduction.
  • 21.
    Advantage of QualityCircles 8. Cost Reduction. 9. Improved communication. 10. Safety improvement. 11. Increased utilization of human resource potential. 12. Enhancement in consciousness and moral of employees through recognition of their activities. 13. Leadership development. 14. Trained staff. 15. Identifies work related problems and solves them effectively.
  • 22.
    Limitations of QualityCircles 1. The overall productivity may decrease initially. 2. A large investment of time and money may be required. 3. The chance of errors increases initially. 4. Over-expectation of some employees who are too excited initially may turn to disappointment and drop out. 5. Quality circles may threaten traditional authority structure. 6. Employees who are habituated to depend on their supervisors for direction and who have lost their initiative feel uncomfortable with Quality Circles. 7. After circle implementation, a period of confusion may arise. This is because people experiment with new ideas, new skills and new roles. 8. Changes in system and control may become necessary.
  • 23.
  • 24.
    Quality Function Deployment(QFD) QFD is a rigorous method for translating customer needs, wants, and wishes into step-by-step procedures for delivering the product or service. While delivering better designs tailored to customer needs, Quality Function Deployment also cuts the normal development cycle by 50%, making you faster to market.
  • 25.
    QFD Team Significant AmountOf Time Communication Two Types Of Teams New Product Improve Existing Product Marketing, Design, Quality, Finance, Production, Etc.
  • 26.
    Benefits Of QFD CustomerDriven Reduces Implementation Time Promotes Teamwork Provides Documentation
  • 27.
    Customer Driven Creates FocusOn Customer Requirements Uses Competitive Information Effectively Prioritizes Resources Identifies Items That Can Be Acted On Structures Resident Experience/Information
  • 28.
    Reduces Implementation Time DecreasesMidstream Design Change Limits Post Introduction Problems Avoids Future Development Redundancies Identifies Future Application Opportunities Surfaces Missing Assumptions
  • 29.
    Promotes Teamwork Based OnConsensus Creates Communication At Interfaces Identifies Actions At Interfaces Creates Global View-Out Of Details
  • 30.
    Provides Documentation Documents RationaleFor Design Is Easy To Assimilate Adds Structure To The Information Adapts To Changes (Living Document) Provides Framework For Sensitivity Analysis
  • 31.
    Voice Of TheCustomer Driving Force Behind QFD Customer Dictates Attributes Of Product Customer Satisfaction Meeting Or Exceeding Customer Expectations Customer Expectations Can Be Vague & General In Nature Customer Expectations Must Be Taken Literally, Not Translated Into What The Organization Desires
  • 32.
    Collecting Customer Information What DoesCustomer Really Want ? What Are Customer’s Expectations ? Are Customer’s Expectations Used To Drive Design Process ? What Can Design Team Do To Achieve Customer Satisfaction?
  • 33.
    Types Of CustomerInformation Solicited, Measurable, Routine Cus. & Market Surveys, Trade Trials Unsolicited, Measurable, Routine Customer Complaints, Lawsuits Solicited, Subjective, Routine Focus Groups Solicited, Subjective, Haphazard Trade & Cus. Visits, Indep. Consultants Unsolicited, Subjective, Haphazard Conventions, Vendors, Suppliers
  • 35.
    House Of Quality TechnicalDescriptors (Voice of the organization) Prioritized Technical Descriptors Interrelationship between Technical Descriptors Customer Requirements (Voice of the Customer) Prioritized Customer Requirements Relationship between Requirements and Descriptors
  • 36.
    Building A HouseOf Quality List Customer Requirements (What’s) List Technical Descriptors (How’s) Develop Relationship (What’s & How’s) Develop Interrelationship (How’s) Competitive Assessments Prioritize Customer Requirements Prioritize Technical Descriptors
  • 37.
    QFD Matrix Absolute Weightand Percent Prioritized Technical Descriptors Degree of Technical Difficulty Relative Weight and Percent Target Value Customer Requirements Prioritized Customer Requirements Technical Descriptors Primary Primary Secondary Secondary Technical Competitive Assessment Customer Competitive Assessment Our A’s B’s Customer Importance Target Value Scale-up Factor Sales Point Absolute Weight Our A’s B’s Relationship between Customer Requirements and Technical Descriptors WHATs vs. HOWs Strong Medium Weak +9 +3 +1 Strong Positive Positive Negative Strong Negative +9 +3 -3 -9 Interrelationship between Technical Descriptors (correlation matrix) HOWs vs. HOWs
  • 38.
  • 39.
  • 40.
    L - ShapedDiagram Customer Requirements Technical Descriptors Primary Primary Secondary Secondary
  • 41.
    Relationship Matrix Customer Requirements Technical Descriptors Primary Primary Secondary Secondary Relationshipbetween Customer Requirements and Technical Descriptors WHATs vs. HOWs Strong Medium Weak +9 +3 +1
  • 42.
    Correlation Matrix Customer Requirements Technical Descriptors Primary Primary Secondary Secondary Relationship between CustomerRequirements and Technical Descriptors WHATs vs. HOWs Strong Positive Positive Negative Strong Negative +9 +3 -3 -9 Interrelationship between Technical Descriptors (correlation matrix) HOWs vs. HOWs Strong Medium Weak +9 +3 +1
  • 43.
    Customer Competitive Assessment Customer Requirements Customer Competitive Assessment Ours A’s B’s 5 3 1 2 5 1 4 4 Relationshipbetween Customer Requirements and Technical Descriptors WHATs vs. HOWs Strong Medium Weak +9 +3 +1
  • 44.
    1 3 42 1 2 1 4 Technical Competitive Assessment Customer Requirements Customer Competitive Assessment Our A’s B’s 5 3 1 2 5 1 4 4 Relationship between Customer Requirements and Technical Descriptors WHATs vs. HOWs Strong Medium Weak +9 +3 +1 Technical Competitive Assessment Our A’s B’s
  • 45.
    Prioritized Customer Requirements Importance Rating TargetValue Scale-Up Factor Sales Point Absolute Weight & Percent (Importance Rating) (Scale-Up Factor) (Sales Point)
  • 46.
    7 3 9 10 2 4 8 1 Customer Requirements Prioritized Customer Requirements Technical Descriptors Primary Primary Secondary Secondary Technical Competitive Assessment Customer Competitive Assessment Our A’s B’s Customer Importance Target Value Scale-up Factor Sales Point Absolute Weight 1 3 42 1 2 1 4 5 3 1 2 5 1 4 4 5 3 2 3 5 2 4 4 1.5 1 1.2 1.5 1 1 1.5 1 1.5 1 15 3 Our A’s B’s Relationship between Customer Requirements and Technical Descriptors WHATs vs. HOWs Strong Medium Weak +9 +3 +1
  • 47.
    Absolute Weight andPercent Prioritized Technical Descriptors Degree of Technical Difficulty Relative Weight and Percent Target Value 1 8 4 2 9 8 2 5 90 133 2 3 4 3 1 3 1 5 7 3 9 10 2 4 8 1 Customer Requirements Prioritized Customer Requirements Technical Descriptors Primary Primary Secondary Secondary Technical Competitive Assessment Customer Competitive Assessment Our A’s B’s Customer Importance Target Value Scale-up Factor Sales Point Absolute Weight 1 3 4 2 1 2 1 4 5 3 1 2 5 1 4 4 5 3 2 3 5 2 4 4 1.5 1 1.2 1.5 1 1 1.5 1 1.5 1 15 3 Our A’s B’s Relationship between Customer Requirements and Technical Descriptors WHATs vs. HOWs Strong Medium Weak +9 +3 +1 Strong Positive Positive Negative Strong Negative +9 +3 -3 -9 Interrelationship between Technical Descriptors (correlation matrix) HOWs vs. HOWs
  • 48.
  • 49.
  • 50.
    Phase II Part Development PartQuality Characteristics Design Requirements
  • 51.
    Phase III Process Planning KeyProcess Operations Part Quality Characteristics
  • 52.
  • 53.
    Four key stepsto QFD thinking: 1. Product planning 2. Part planning 3. Process planning 4. Production planning
  • 54.
    Product Planning 1. Translatingwhat the customer wants (in their language, e.g., portable, convenient phone service) into a list of prioritized product/service design requirements (in your language, e.g., cell phones) that describes how the product works. It also compares your performance with your competition's, and sets targets for improvement to differentiate your product/service from your competitor's.
  • 55.
    2. Part Planning Translatingproduct specifications (design criteria from step 1) into part characteristics (e.g., light weight, belt- clip, battery-driven, not-hardwired but radio-frequency based).
  • 56.
    3. Process Planning Translatingpart characteristics (from step 2) into optimal process characteristics that maximize your ability to deliver Six Sigma quality (e.g., ability to "hand off" a cellular call from one antenna to another without interruption).
  • 57.
    4. Production Planning Translatingprocess characteristics (from step 3) into manufacturing or service delivery methods that will optimize your ability to deliver Six Sigma quality in the most efficient manner (e.g., cellular antennas installed with overlapping coverage to eliminate dropped calls).
  • 58.
    The Quality Function DeploymentProcess 1. Identify the Customer(s) 2. Determine Customer Requirements/Constraints 3. Prioritize each requirement 4. Competitive Benchmarking 5. Translate Customer Requirements into Measurable Engineering specifications 6. Set Target values for each Engineering Specification
  • 59.
    QFD Example An AutomobileBumper Customer Request: There is too much damage to bumpers in low-speed collisions. Customer wants a better bumper.
  • 60.
    QFD Example An AutomobileBumper Step 1: Identify Customer(s) Repair Department Automobile Owner Manufacturing Plant Sales Force
  • 61.
    QFD Example An AutomobileBumper Step 2: Determine Customer Requirements/Constraints I want something that looks nice (basic) It must hold my license plate (performance) I want it strong enough not to dent (excitement) It must protect my tail-lights and head- lights (performance) I don’t want to pay too much (basic)
  • 62.
    QFD Example An AutomobileBumper Step 3: Prioritize Customer Requirements
  • 63.
    QFD Example An AutomobileBumper Put prioritized Customer Requirements into a House of Quality Chart
  • 64.
    QFD Example An AutomobileBumper Step 4: Competition Benchmarking Identify Competitors Test and Analyze Competitor Products Reverse Engineer Competitor Products Rate Competitor Products against customer requirements/constraints
  • 65.
    QFD Example An AutomobileBumper Put competitive benchmarking information into House of Quality Chart
  • 66.
    QFD Example An AutomobileBumper Steps 5 and 6: Translate Customer Requirements into Measurable Engineering Specifications and define target values Specify how license plate will be held Specify how to resist dents through material yield strength, young's modulus, etc. Specify with a dollar amount the term ‘inexpensive’
  • 67.