Downloaded 186 times


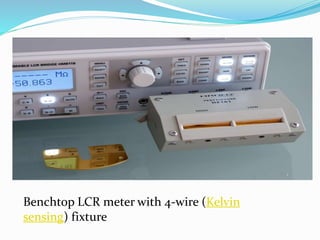


This document provides an overview of a Q-meter or RLC meter, which is an instrument used to measure the quality factor (Q factor) of coils and inductors, as well as their inductance, capacitance, and resistance at radio frequencies. It works by placing the coil under test in a series resonant circuit and measuring the ratio of voltage across the coil to the applied voltage, which directly corresponds to the Q factor. The document describes the typical construction, working principle, circuit diagram, and applications of a Q-meter, such as measuring the Q factor, impedance, and characteristic impedance of transmission lines.


