The document provides information on Q meters and LCR meters. It discusses:
- The working principle of a Q meter, which measures quality factor using series resonance. It was developed in 1934 and is still used today.
- The circuit of a Q meter, which includes an oscillator, thermocouple meter, and electronic voltmeter. It operates by adjusting capacitance for resonance.
- Applications of Q meters, including measuring quality factor, impedance, capacitance, inductance, resistance, bandwidth, and more.
- LCR meters, which can measure inductance, capacitance, and resistance using a Wheatstone bridge and RC ratio arm circuits. They are used to characterize electronic components.
good for studentgood for studentgood for studentgood for studentgood for studentgood for studentgood for studentgood for studentgood for studentgood for studentgood for studentgood for studentgood for studentgood for studentgood for studentgood for student
good for studentgood for studentgood for studentgood for studentgood for studentgood for studentgood for studentgood for studentgood for studentgood for studentgood for studentgood for studentgood for studentgood for studentgood for studentgood for student
Student information management system project report ii.pdfKamal Acharya
Our project explains about the student management. This project mainly explains the various actions related to student details. This project shows some ease in adding, editing and deleting the student details. It also provides a less time consuming process for viewing, adding, editing and deleting the marks of the students.
Welcome to WIPAC Monthly the magazine brought to you by the LinkedIn Group Water Industry Process Automation & Control.
In this month's edition, along with this month's industry news to celebrate the 13 years since the group was created we have articles including
A case study of the used of Advanced Process Control at the Wastewater Treatment works at Lleida in Spain
A look back on an article on smart wastewater networks in order to see how the industry has measured up in the interim around the adoption of Digital Transformation in the Water Industry.
Cosmetic shop management system project report.pdfKamal Acharya
Buying new cosmetic products is difficult. It can even be scary for those who have sensitive skin and are prone to skin trouble. The information needed to alleviate this problem is on the back of each product, but it's thought to interpret those ingredient lists unless you have a background in chemistry.
Instead of buying and hoping for the best, we can use data science to help us predict which products may be good fits for us. It includes various function programs to do the above mentioned tasks.
Data file handling has been effectively used in the program.
The automated cosmetic shop management system should deal with the automation of general workflow and administration process of the shop. The main processes of the system focus on customer's request where the system is able to search the most appropriate products and deliver it to the customers. It should help the employees to quickly identify the list of cosmetic product that have reached the minimum quantity and also keep a track of expired date for each cosmetic product. It should help the employees to find the rack number in which the product is placed.It is also Faster and more efficient way.
Explore the innovative world of trenchless pipe repair with our comprehensive guide, "The Benefits and Techniques of Trenchless Pipe Repair." This document delves into the modern methods of repairing underground pipes without the need for extensive excavation, highlighting the numerous advantages and the latest techniques used in the industry.
Learn about the cost savings, reduced environmental impact, and minimal disruption associated with trenchless technology. Discover detailed explanations of popular techniques such as pipe bursting, cured-in-place pipe (CIPP) lining, and directional drilling. Understand how these methods can be applied to various types of infrastructure, from residential plumbing to large-scale municipal systems.
Ideal for homeowners, contractors, engineers, and anyone interested in modern plumbing solutions, this guide provides valuable insights into why trenchless pipe repair is becoming the preferred choice for pipe rehabilitation. Stay informed about the latest advancements and best practices in the field.
Water scarcity is the lack of fresh water resources to meet the standard water demand. There are two type of water scarcity. One is physical. The other is economic water scarcity.
About
Indigenized remote control interface card suitable for MAFI system CCR equipment. Compatible for IDM8000 CCR. Backplane mounted serial and TCP/Ethernet communication module for CCR remote access. IDM 8000 CCR remote control on serial and TCP protocol.
• Remote control: Parallel or serial interface.
• Compatible with MAFI CCR system.
• Compatible with IDM8000 CCR.
• Compatible with Backplane mount serial communication.
• Compatible with commercial and Defence aviation CCR system.
• Remote control system for accessing CCR and allied system over serial or TCP.
• Indigenized local Support/presence in India.
• Easy in configuration using DIP switches.
Technical Specifications
Indigenized remote control interface card suitable for MAFI system CCR equipment. Compatible for IDM8000 CCR. Backplane mounted serial and TCP/Ethernet communication module for CCR remote access. IDM 8000 CCR remote control on serial and TCP protocol.
Key Features
Indigenized remote control interface card suitable for MAFI system CCR equipment. Compatible for IDM8000 CCR. Backplane mounted serial and TCP/Ethernet communication module for CCR remote access. IDM 8000 CCR remote control on serial and TCP protocol.
• Remote control: Parallel or serial interface
• Compatible with MAFI CCR system
• Copatiable with IDM8000 CCR
• Compatible with Backplane mount serial communication.
• Compatible with commercial and Defence aviation CCR system.
• Remote control system for accessing CCR and allied system over serial or TCP.
• Indigenized local Support/presence in India.
Application
• Remote control: Parallel or serial interface.
• Compatible with MAFI CCR system.
• Compatible with IDM8000 CCR.
• Compatible with Backplane mount serial communication.
• Compatible with commercial and Defence aviation CCR system.
• Remote control system for accessing CCR and allied system over serial or TCP.
• Indigenized local Support/presence in India.
• Easy in configuration using DIP switches.
Hybrid optimization of pumped hydro system and solar- Engr. Abdul-Azeez.pdffxintegritypublishin
Advancements in technology unveil a myriad of electrical and electronic breakthroughs geared towards efficiently harnessing limited resources to meet human energy demands. The optimization of hybrid solar PV panels and pumped hydro energy supply systems plays a pivotal role in utilizing natural resources effectively. This initiative not only benefits humanity but also fosters environmental sustainability. The study investigated the design optimization of these hybrid systems, focusing on understanding solar radiation patterns, identifying geographical influences on solar radiation, formulating a mathematical model for system optimization, and determining the optimal configuration of PV panels and pumped hydro storage. Through a comparative analysis approach and eight weeks of data collection, the study addressed key research questions related to solar radiation patterns and optimal system design. The findings highlighted regions with heightened solar radiation levels, showcasing substantial potential for power generation and emphasizing the system's efficiency. Optimizing system design significantly boosted power generation, promoted renewable energy utilization, and enhanced energy storage capacity. The study underscored the benefits of optimizing hybrid solar PV panels and pumped hydro energy supply systems for sustainable energy usage. Optimizing the design of solar PV panels and pumped hydro energy supply systems as examined across diverse climatic conditions in a developing country, not only enhances power generation but also improves the integration of renewable energy sources and boosts energy storage capacities, particularly beneficial for less economically prosperous regions. Additionally, the study provides valuable insights for advancing energy research in economically viable areas. Recommendations included conducting site-specific assessments, utilizing advanced modeling tools, implementing regular maintenance protocols, and enhancing communication among system components.
Hybrid optimization of pumped hydro system and solar- Engr. Abdul-Azeez.pdf
Chapter 4.pdf
1. Chapter 4
4.1 Q Meter: Working Principle, Circuit & Applications
Q meter was developed by William D. Loughlin at Boonton Radio Corporation in the year
1934 in Boonton, New Jersey. The Q-meter instrument has become more popular in RF
impedance measurement. There are different kinds of instruments available based on system
usage. These are separated into two types like low-impedance injection & high-impedance
injection. This device plays a key role in testing the RF circuits and also replaced in laboratories
with other impedance measuring devices, although it is still in use among radio amateurs. This
article discusses an overview of the Q meter.
What is Q Meter?
Definition: A device that is used to measure the QF (quality factor) or storage factor or quality
factor of the circuit at radio frequencies is called the Q-meter. In the oscillatory system, the QF
is one of the essential parameters, used to illustrate the relationships among the dissipated &
stored energies.
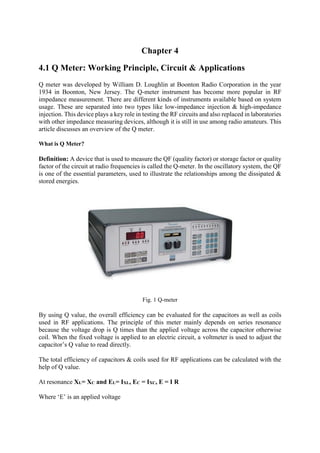
Fig. 1 Q-meter
By using Q value, the overall efficiency can be evaluated for the capacitors as well as coils
used in RF applications. The principle of this meter mainly depends on series resonance
because the voltage drop is Q times than the applied voltage across the capacitor otherwise
coil. When the fixed voltage is applied to an electric circuit, a voltmeter is used to adjust the
capacitor’s Q value to read directly.
The total efficiency of capacitors & coils used for RF applications can be calculated with the
help of Q value.
At resonance XL= XC and EL= IXL, EC = IXC, E = I R
Where ‘E’ is an applied voltage
2. ‘EC’ is the capacitor voltage
‘EL’ is an inductive voltage
‘XL’ is the inductive reactance
‘XC’ is the capacitive reactance
‘R’ is the coil resistance
‘I’ is circuit current
Thus, Q = XL/R= Xc/R=EC/E
From the above ‘Q‘equation, if an applied voltage is kept stable so that the voltage across the
capacitor can be calculated using a voltmeter to read ‘Q’ values directly.
Working Principle
The working principle of Q meter is series resonant because the resonant exists within the
circuit once the reactance of capacitance & reactance is of the same magnitude. They induce
energy to oscillate in between the fields of electric & magnetic of the inductor & capacitor
respectively. This meter mainly depends on the feature of the capacitance, inductance &
resistance of the resonant series circuit.
Q Meter Circuit
The circuit diagram of the ‘Q’ meter is shown below. It is designed with an oscillator that uses
the frequency that ranges from 50 kHz – 50 MHz. and provides current to a shunt resistance
‘Rsh’with 0.02 ohms value.
Here thermocouple meter is used to calculate the voltage across the shunt resistance whereas
an electronic voltmeter is used to calculate the voltage across the capacitor. These meters can
be calibrated to read ‘Q’ directly.
Fig. 2 Q-meter-circuit
3. In the circuit, the energy of the oscillator can be supplied to the tank circuit. This circuit can be
adjusted for the resonance through unstable ‘C’ until the voltmeter reads the utmost value.
The o/p voltage of resonance is ‘E’, equivalent to ‘Ec’ is E = Q X e and Q = E/e. Because ‘e’
is known so the voltmeter is adjusted to read ‘Q’ value directly.
The coil is connected to the two test terminals of the instrument to determine the coil’s
inductance
This circuit is adjusted to resonance through changing either the oscillator frequency otherwise
the capacitance. Once the capacitance is changed, then the frequency of the oscillator can be
adjusted to a specified frequency & resonance is attained.
If the value of capacitance is already fixed to a preferred value, then the frequency of the
oscillator will be changed until resonance takes place.
The reading of ‘Q’ on the o/p meter is multiplied through the setting of an index to get the
actual ‘Q’ value. The coil’s inductance is calculated from known values of the coil frequency
as well as the resonating capacitor.
The specified Q is not the definite Q, as the losses of the voltmeter, inserted resistance &
resonating capacitor are all incorporated in the circuit. Here, the definite ‘Q’ of the calculated
coil is a bit larger than the specified Q. This dissimilarity is insignificant except wherever the
coil’s resistance is relatively minute compared to the ‘Rsh’ resistance.
Applications of the Q-meter
The applications of Q-meter include the following.
It is used to measure the quality factor of the inductor.
By using this meter, unknown impedance can be measured using a series or shunt
substitution method. If the impedance is small, the former technique is used and if it is
large, then the latter technique is used.
It is used to measure small capacitor values.
By using this, inductance, effective resistance, self-capacitance, and bandwidth can be
measured.
FAQs
1). What is a quality factor?
The quality factor is a ratio of the stored power and dissipated power in an element.
2). What is ‘Q’ meter?
Q meter is one kind of instrument, used to measure electrical properties of coils & capacitors.
This instrument is also used in laboratories.
3). What is the Q meter working principle?
4. The working principle of this meter is a series resonance
4). A practical Q meter includes of
It includes an RF oscillator
5). What is the Q factor of a series resonant circuit?
The Q factor of a series resonant circuit is Q=XL/R = XC/R
4.2 LCR Meter
Definition: LCR meters can be understood as a multimeter, this is because it can measure
resistance, inductance, capacitance as per the requirement. Thus, it is termed as LCR meter.
L in its name signifies inductance, C stands for capacitance and R denotes resistance.
The significant component of LCR meter is the Wheatstone bridge and RC ratio arm
circuits. The component whose value is to be measured is connected in one of the arms of the
bridge. There are different provisions for the different type of measurements.
For example, if the value of resistance is to be measured, then Wheatstone bridge comes into
picture while the value of inductance and capacitance can be measured by comparing it with
standard capacitor present in RC ratio arm circuit.
Fig.3 Block diagram of LCR Meter
The above block diagram clearly defines the connection diagram of the LCR meter. The
measurement of DC quantities will be done by exciting the bridge with DC voltage. On the
contrary, the AC measurements require excitation of the Wheatstone bridge with AC signal.
For providing AC excitation, the oscillator is used in the circuit. It generates the frequency of
1 kHz.
5. Working of LCR Meter
The bridge is adjusted in null position in order to balance it completely. Besides, the sensitivity
of the meter should also be adjusted along with balancing of the bridge. The output from the
bridge is fed to emitter follower circuit. The output from emitter follower circuit is given as
an input to detector amplifier.
The significance of detector amplifier can be understood by the fact that if the measuring signal
is low in magnitude, it will not be able to move the indicator of PMMC meter. Thus, in order
to achieve the sustainable indication we need to have a high magnitude measuring signal.
But it is often observed that while dealing with the measurement process, the magnitude of the
measuring signal falls down due to attenuation factor. The problem to this solution is to utilize
an amplifier.
The rectifier is used in the circuit to convert the AC signal into DC signal. When the bridge is
provided with AC excitation then at the output end of the bridge the AC signal needs
transformation into DC signal.
Front Panel of LCR meter
The component which is to be measured is placed across the test terminals of LCR meter,
after which according to the type of component the measurement is performed. To understand
the procedure of measurement by LCR meter, the functional controls on front panel needs to
be understood.
Let’s have a look at the controlling terminals of the front panel of LCR meter.
Fig. 4 Controls on front panel of LCR Meter
1. ON/OFF Switch: The ON/OFF switch can be used to turn on or off LCR meter. When
the switch is positioned to ON state, the main supply is connected with LCR meter.
After this, it is crucial to leave the meter for 15 minutes so that it can warm up. The
indicator on the front panel will start glowing to indicate that the LCR meter is ON.
6. 2. Test Terminals: The two points on the front panel are test terminals. The component
which is to be measured is connected to this test terminals.
3. Function Selector: The function selector is used for setting the meter in the mode in
order to measure the particular type of the component. If resistance is to be measured,
then the function selector is to be set at R mode, if inductance is to be measured it is to
be adjusted to L mode and similarly in case of capacitance it is to be adjusted at C
mode.
4. Range Selector: The range selector provides an extent of measuring range so that
component of high magnitude or low magnitude values can be measured easily. The
range selector should be adjusted properly in order to have correct measurement. For
example: if a resistor of 10 mega ohms is under measurement and the range selector is
in the range of ohms, then it will not show reliable and accurate results.
The range of instrument can be increased by using multipliers in the circuit. The multipliers
should consist of higher precision resistors made up of the metal film. In addition to this, it
should possess high-temperature stability.
5. Scale: The scale calibrated on the LCR meter will show the final values of the
measurement. The indicator will move across the calibrated scale to show the measured
value.
Use of meter
When we are measuring the unknown value component, select the range of the LCR meter at
the highest value. This is because we do not know the range of the component. After this
achieve the null deflection in the bridge by adjusting the range, loss factor and sensitivity.
Protection of LCR meters
One should be extremely careful while providing excitation to the bridge of LCR meter. This
is because if the value of the voltage applied to the bridge is high the circuit gets burn out.
Thus, for the protection of LCR meter, we can also use a circuit of limiting diodes at the end
of the circuit of LCR meter. This will provide over-voltage protection.
4.3 LCR Bridge
Bridge method: This method uses the familiar Wheatstone bridge concept as the basis of its operation.
The aim is to aim for a condition where the bridge is balanced and no current flows through the meter.
At the balance point the bridge component positions can be used to determine the value of the
component under test. This method is typically used for lower frequency measurements - often
measurement frequencies of up to 100 kHz or so are used.
In bridge method the device under test, DUT, is placed in a bridge circuit as shown, and its value can
be determined from the settings for the other elements in the bridge. It is the LCR meters using this
technique that are known as LCR bridges.
7. Fig. 5 LCR Bridge
Basic bridge based LCR meter circuit The DUT impedance is represented by Zu in the circuit.
The impedance Z2 and Z3 are known. The oscillator circuit generally operates at frequencies
up to about 100 kHz and can usually be selected before the test.
Then Z1 can be changed until no current flows through D. This is the balance position for the
bridge. AT this point the four impedances in the circuit obey the equation:
ZU = (Z3Z2) Z1
This basic bridge circuit is sometimes used on its own in very primitive LCR meters. Some
very old instruments actually have the elements that are manually balanced. However
technology has moved on and higher levels of integration coupled with operational amplifier
circuitry enable accurate automated versions of the circuit to be used.