SlideShare a Scribd company logo
1 of 24
BIOSTATISTICS AND RESEARCH METHODOLOGY
Unit-5: response surface methodology
PRESENTED BY
Gokara Madhuri
B. Pharmacy IV Year
UNDER THE GUIDANCE OF
Gangu Sreelatha M.Pharm., (Ph.D)
Assistant Professor
CMR College of Pharmacy, Hyderabad.
email: sreelatha1801@gmail.com
RESPONSE SURFACE METHODOLOGY
• Response surface methodology (RSM) uses various statistical,graphical, and mathematical techniques
to develop, improve, or optimize a process, also use for modeling and analysis of problems if our
response variables in influenced by several independent variables.
Main objectives are as follow
• Optimize (main objective)
• Develop
• Improve (if necessary)
• There are three stages of RSM
1. Initial screening stage ( to identify a few important factors from many factors)
2. Sequential search stage ( to identify an optimum design region)
3. A final stage of response surface study ( to obtain an accurate approximation of the response surface)
 METHODS OF RSM
• There are two methods of RSM to obtain optimum response. And we move toward our optimum point
with these two method
1. Method of Steepest Ascent
2. Method of Steepest Descent
 Steepest Ascent Method
• This is a procedure for moving sequentially in the direction of the maximum increase in the response
getting optimum response.
 Steepest Descent Method
• If minimization is desired then we call this technique the “method of steepest descent”.
 APPLICATIONS
• The most frequent applications of RSM are in the industrial area.
• RSM is important in designing formulating and developing and analyzing new specific scientific
studying and product.
• It is also efficient in improvements of existing studies and products.
• Most common application of RSM are in industrial,biological and clinical sciences, social sciences,
food sciences and physical and engineering sciences.
CENTRAL COMPOSITE DESIGN
• Central composite designs are two level full factorial (2k) or fractional factorial (2k-f) designs
augmented by a number of centre points and other chosen runs. These designs are such that they allow
the estimation of all the regression parameters required to fit a second order model to given response.
• A second-order model can be constructed efficiently with central composite designs
(CCD)(Montgomery,1997). CCD is first-order (2k) designs augmented centre and axial points to allow
estimation of the tuning parameters of a second-order model. Figure below shows a CCD for 2 design
variables.
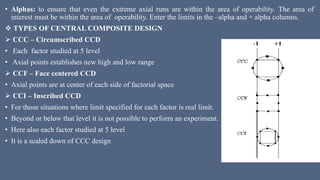
• Here’s a representation of a classic central composite design for 2
factors.
 Four corners of the square represent the factorial (+/-1) design points.
 Four star points represent the axial (+/-alpha) design points.
 Replicated centre point.
• Numeric factors The number of numeric factors involved in the experiment
• Category factors The number of category factors involved in the experiment
• Enter factors ranges in terms of +/-1 to define the limits for the area of interest where the optimum is
believed to exist. Axial points will typically be outside this limit. Enter the limits in the low and high
columns.
• Alphas: to ensure that even the extreme axial runs are within the area of operability. The area of
interest must be within the area of operability. Enter the limits in the –alpha and + alpha columns.
 TYPES OF CENTRAL COMPOSITE DESIGN
 CCC – Circumscribed CCD
• Each factor studied at 5 level
• Axial points establishes new high and low range
 CCF – Face centered CCD
• Axial points are at center of each side of factorial space
 CCI – Inscribed CCD
• For those situations where limit specified for each factor is real limit.
• Beyond or below that level it is not possible to perform an experiment.
• Here also each factor studied at 5 level
• It is a scaled down of CCC design
• Blocks: central composite designs can be split into blocks. The factorial design is split into sub-
fractions that support the two-factor interaction model and the axial points in the final block if needed.
• Options button: click on the options button to change the axial (alpha) distance which is how far the
star points will be from the centre in coded units. Use the help button on the options dialog for more
information.
• The points area provides a preview of the number and type of runs that will be in the design.
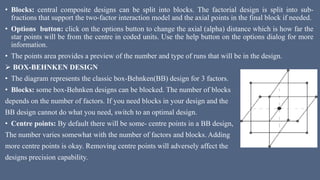
 BOX-BEHNKEN DESIGN
• The diagram represents the classic box-Behnken(BB) design for 3 factors.
• Blocks: some box-Behnken designs can be blocked. The number of blocks
depends on the number of factors. If you need blocks in your design and the
BB design cannot do what you need, switch to an optimal design.
• Centre points: By default there will be some- centre points in a BB design,
The number varies somewhat with the number of factors and blocks. Adding
more centre points is okay. Removing centre points will adversely affect the
designs precision capability.
HISTORICAL DESIGN
• Historical Research Design: This method involves the systematic and objective location, evaluation,
and synthesis of evidence to establish facts and draw conclusions about past events. Historical
research aims to show the importance of past events in the present situation.
• This research can provide a perspective for decision-making about current problems and some issues
are often better understood if we understand the historical perspective.
• The research solely depends upon secondary data such as books, journals, magazines, newspapers,
historical records, diaries, documents, etc. There are very limited sources of historical information and
many assumptions are found in this research.
CHARACTERISTICS OF HISTORICAL RESEARCH DESIGN
• Historical research involves the careful study and analysis of data about past events.
• The purpose is to gain a clearer understanding of the impact of the past on the present and future
events related to the life process.
• It is a critical investigation of events, their development, experiences the past.
• Involves the review of written materials but may include oral documentation as well.
• It covers categories such as historical legal, documentary, bibliographical, biographical institutional
and organizational.
• Typically relies on available data which are in form of diaries, letters, newspapers, reports, and so on
 DIFFERENT STEPS IN HISTORICAL RESEARCH DESIGN ARE AS FOLLOWS
1. DATA COLLECTION
• Historical sources of data are classified into two main categories such as primary sources and
secondary sources Primary sources are first-hand information that includes relics associated with
persons, groups, periods, or events.
• Fossils, skeletons, tools, weapons, utensils, clothing, furniture, pictures, painting, coins, and art
objects are examples of remains that were not deliberately intended for use in transmitting information
or to be used as a record.
• Documents called primary sources are constitutions, characters, laws, official records, deeds, licenses,
newspapers, magazines, etc.
• Secondary sources are the reports of people who related the testimony of an actual witness of an
event or actual participants in the same. For example most of the history books and encyclopedias.
2. CRITICISM OF THE DATA
• The second step necessitates a comprehensive review of gathered materials. External criticism is the
establishment of validity by determining the authenticity of the source.
• It primarily deals with data relating to form and appearance rather than the meaning of contents, while
internal criticism weighs the testimony of the document about truth.
• Internal criticism is the determination of reliability by correctly interpreting the contents of the
documents.
• The use of original, authentic sources; awareness of one’s biases; the substantiation of the document
in question by another collaborating source are a few of the safeguards used to ensure that
interpretations are correct.
• After the authenticity of a historical document or relic has been established, the next question is to
establish the validity of its contents or to determine the accuracy and value of the statement made.
3. PRESENTATION OF THE FACTS
• The historical researcher must bring the material together to analyze and test the research hypotheses
after evaluating the authenticity and accuracy of data.
• Historical researchers must be careful at this point since the analysis of historical data involves logical
processes rather than statistical ones. The organization of historical material can also be done in a
topical, thematic, or functional arrangement.
• The historical research is not involved in the situation that is studied and the researchers do not
interact with the subjects of study.
• Analysis of historical data may help explain current and future events.
• There are many limitations of historical research as historical data is incomplete and vulnerable to
time and it can also be biased and corrupt.
• Historical research is a complex process because the topics of research are affected by numerous
factors that need to be considered.
• PURPOSE OF HISTORICAL RESEARCH
• To solve contemporary problems.
• Learn from past failures and success.
• Make prediction.
• To re-evaluate- data in relation to selected hypothesis, theories and generalizations.
• To understand how and why educational theories and practices developed.
Example of historical research studies
• A historical research on the development of nursing in Nepal.
• A historical research on the development of nursing education in Nepal.
ADVANTAGES
• Many current educational practices, theories and issues can be better understood in the light of past
experiences.
• Researchers can apply scientific objectivity in attempting to determine exactly what did happen in the
past.
• If well-done, this research involves systematic, objective data collection and analysis.
DISADVANTAGES
• In conducting historical research, the researcher can neither manipulate nor control any of the
variables.
• There is no way, historical researcher can affect events of the past.
• Historical research cannot collect data by administering instruments.
• Historical research is limited to whatever data are available.
• Historical research excessively relies on secondary source of data.
OPTIMIZATION TECHNIQUES
OPTIMIZATION USING FACTORIAL DESIGNS
• The term Optimize is defined as to make perfect , effective , or as functional as possible.
• It is the process of finding the best way of using the existing resources while taking in to the
account of all the factors that influences decisions in any experiment
• Traditionally, optimization in pharmaceuticals refer to changing one variable at a time, so to obtain
solution of a problematic formulation.
Modern pharmaceutical optimization involves systematic design of experiments (DoE) to improve
formulation irregularities.
• In the other word we can say that –quantitate a formulation that has been qualitatively determined .
It’s not a screening technique.
• In factorial designs, levels of factors are independently varied, each factor at two or more levels.
The effects that can be attributed to the factors and their interactions are assessed with maximum
efficiency in factorial designs.
• Also, factorial designs allow for the estimation of the effects of each factor and interaction,
unconfounded by the other experimental factors. Thus, if the effect of increasing stearic acid by
1mg is to decrease the dissolution by 10%, in the absence of interactions, this effect is independent
of the levels of the other factors.
Reducing
cost
Reproducib
ility
Why is Optimization necessary?
Primary objective may not be optimize absolutely but to compromise effectively & thereby produce the best formulation under a
given set of restrictions .
PARAMETERS
CONSTRAINED
PROBLEM TYPE
UNCONSTRAINED
V
ARIABLES DEPENDENT
INDEPENDENT
Optimization Parameters
A) Problem type:
a) Constrained type
• Constrained types are, restrictions placed on the system by means of a physical limitations or perhaps by
simply practical based. This can best explained by taking hardness of tablet and its disintegrate time in
less than 15 min.
b) Unconstrained type
• In unconstrained type there are no restrictions placed on the system by means of a physical limitations or
perhaps by simply practical based.
• But in pharmaceuticals, there is always a limitation of a means of a physical limitation or perhaps by
simply practically the formulator wishes to place or must place on a System.
• So, in pharmaceuticals the unconstrained optimization problem is almost negligible.
• For a given pharmaceutical system one might wish to make the hardest tablet possible.
• The making of the hardest tablet is the unconstrained optimization problem.
B) Variables
• There are several Variables in pharmaceutical formulation and processing but generally variables can be
classified into : a) independent variables b) dependent variables
a) Independent variables:
• These are the variables which are directly under the control of the formulator. These might include the
compression force or the die cavity filling or the mixing time.
b) Dependent variables:
• The dependent variables are the responses or the characteristics that are developed due to the
independent variables. The more the variables that are present in the system the more the
complications that are involved in the optimization.
• These are the variables which are not directly under the control of the formulator, these variables are the
responses or the characteristics of the in process materials or the results. These are a direct result of any
change in the formulation or a process such as homogeneity of the mixed granules.
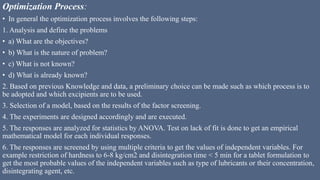
Optimization Process:
• In general the optimization process involves the following steps:
1. Analysis and define the problems
• a) What are the objectives?
• b) What is the nature of problem?
• c) What is not known?
• d) What is already known?
2. Based on previous Knowledge and data, a preliminary choice can be made such as which process is to
be adopted and which excipients are to be used.
3. Selection of a model, based on the results of the factor screening.
4. The experiments are designed accordingly and are executed.
5. The responses are analyzed for statistics by ANOVA. Test on lack of fit is done to get an empirical
mathematical model for each individual responses.
6. The responses are screened by using multiple criteria to get the values of independent variables. For
example restriction of hardness to 6-8 kg/cm2 and disintegration time < 5 min for a tablet formulation to
get the most probable values of the independent variables such as type of lubricants or their concentration,
disintegrating agent, etc.
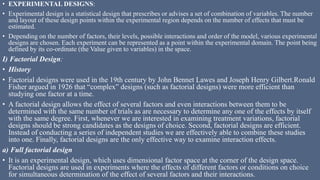
• EXPERIMENTAL DESIGNS:
• Experimental design is a statistical design that prescribes or advises a set of combination of variables. The number
and layout of these design points within the experimental region depends on the number of effects that must be
estimated.
• Depending on the number of factors, their levels, possible interactions and order of the model, various experimental
designs are chosen. Each experiment can be represented as a point within the experimental domain. The point being
defined by its co-ordinate (the Value given to variables) in the space.
I) Factorial Design:
• History
• Factorial designs were used in the 19th century by John Bennet Lawes and Joseph Henry Gilbert.Ronald
Fisher argued in 1926 that “complex” designs (such as factorial designs) were more efficient than
studying one factor at a time.
• A factorial design allows the effect of several factors and even interactions between them to be
determined with the same number of trials as are necessary to determine any one of the effects by itself
with the same degree. First, whenever we are interested in examining treatment variations, factorial
designs should be strong candidates as the designs of choice. Second, factorial designs are efficient.
Instead of conducting a series of independent studies we are effectively able to combine these studies
into one. Finally, factorial designs are the only effective way to examine interaction effects.
a) Full factorial design
• It is an experimental design, which uses dimensional factor space at the corner of the design space.
Factorial designs are used in experiments where the effects of different factors or conditions on choice
for simultaneous determination of the effect of several factors and their interactions.
• The simplest factorial design is the 2 factorial designs, where two factors are considered each at two
levels, leads to four experiments, which are situated in 2-dimensional factor space at the corners of a
rectangle.
• If there are 3 factors, each at two levels, eight experiments are necessary which are situated at the corners
of an orthogonal cube on a 3 dimensional space. The number of experiments is given by 2, where ‘n’ is
the number of factors.
• If the number of factors and levels are large, then the number of experiments needed to complete a
factorial design is large.
• To reduce the number of experiments, fractional factorial design can be used (i.e., ½ or ¼ of the original
number of experiments with full factorial design).
• The fitting of an empirical polynomial equation to the experimental result facilitates the optimization
procedure. The general polynomial equation is as follows:
• Y = B0 + B1X1 + B2 X2 + B3 X3 + + B12 X1X2 + B13X1X3 + B23X2X3 —-
• Where Y is the response, X1, X2, X3 are the levels (concentration) of the 1, 2, 3 factors and B1, B2, B3,
B12, B13, B23, are the polynomial coefficients,B0 is the intercept (which represents the response when
the level of all factors is low).
b. Plackett-Burman Design
• It is a fractional factorial design with K = m*4 experiment, for screening of (K-i) variables. Where K is
the number of variables and m is the number of levels.
c. Star Design
• Star design is simply a 22 factorial design rotated over 45° angle in the space. A center point is usually
added, which may be replicated to estimate experimental error, so there will be three levels for each
factor where quadratic effect can be measured, but the interaction effect cannot be measured as in case of
the full factorial design. In star design, 2k factorial designs are rotated over 45° in (k-i) direction in k-
dimensional space with a replicated center point. k is the number of factors in the design. This results in
2k+R experiments, where R is the replicate of the center point.
d. Central Composite Design.
• A better design that encompasses the advantages of factorial design or fractional factorial design or the
star design, is the central composite design(CCD). This design is developed by Box and Wilson. It is
composed of +2k Factorial design or Fractional factorial design.
• 2* k star design.
• This design enables the estimation of a full second-order model. The equation for two factors is given by
B0 + B1 X1+ B2 X2 + B12 X1X2 + B11 X12 + B22 X22
II ) Box design
• In central composite design each factor has five levels. If the number of factors increases, the number of
experiments may become too high. The Box designs for three or more factors are economical alternative
in which each factor is given three levels.
• The design is called an orthogonal balanced incomplete block design. It can be split into a set of
incomplete blocks, which means that every effect is not estimated in every block, but every factor effect
is measured as equal number of times with a balanced partition over the different blocks.
III) Doehiert Hexagon or Uniform Shell design
• Doehiert proposed uniform shell designs, starting with an equilateral triangle, mirrored in one side to a
hexagon. The hexagon is expandable in 2- dimensional space by mirroring the center point in the
outward sides. The equally spaced design points are uniformly distributed in concentric circles. It is also
expandable in 3-dimension to concentric spherical shells. Due to the uniform distribution, models based
on this design provide, a good basis for interpolation.
• A disadvantage may be that the number of levels is not same for all factors. The design may be started
with one side of the hexagon parallel to the most important axis.
IV) Mixture design:
• For mixtures of components (such as drugs and excipients in the formulation), special models have been
derived, based on the mixture constraints.
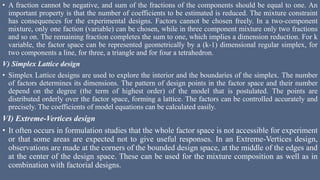
• A fraction cannot be negative, and sum of the fractions of the components should be equal to one. An
important property is that the number of coefficients to be estimated is reduced. The mixture constraint
has consequences for the experimental designs. Factors cannot be chosen freely. In a two-component
mixture, only one faction (variable) can be chosen, while in three component mixture only two fractions
and so on. The remaining fraction completes the sum to one, which implies a dimension reduction. For k
variable, the factor space can be represented geometrically by a (k-1) dimensional regular simplex, for
two components a line, for three, a triangle and for four a tetrahedron.
V) Simplex Lattice design
• Simplex Lattice designs are used to explore the interior and the boundaries of the simplex. The number
of factors determines its dimensions. The pattern of design points in the factor space and their number
depend on the degree (the term of highest order) of the model that is postulated. The points are
distributed orderly over the factor space, forming a lattice. The factors can be controlled accurately and
precisely. The coefficients of model equations can be calculated easily.
VI) Extreme-Vertices design
• It often occurs in formulation studies that the whole factor space is not accessible for experiment
or that some areas are expected not to give useful responses. In an Extreme-Vertices design,
observations are made at the corners of the bounded design space, at the middle of the edges and
at the center of the design space. These can be used for the mixture composition as well as in
combination with factorial designs.
VII ) Evolutionary methods:
• In the method the formulator makes a very small change in the formulation or process, but it makes so
many times That he or she can determine statistical whether the product has improved. If it has be
makes another change in the same direction many times and notes. The results continues until further
change do not improve the product.
• This methods is useful where there is a continue production but due to the reasons like
i) EVOP is not substitute to G.M.P
ii) due to regulatory subject
iii) because of the necessarily small changes utilized, it is not particularly suitable for lab.
VIII) D-Optimal:
• “D-Optimal” means that these designs maximize the information in the selected set of experimental
runs with respect to a stated model.
The D-Optimal design maximizes the determinant, of which is an overall measure of the information.
Geometrically, this corresponds to maximizing the volume in a dimensional space.
A D-Optimal design is suggested when:
• There is a linear constraint on the factor settings, reducing the experimental region to an irregular
polyhedron.
There are no classical designs that can well investigate an irregular region. A D-Optimal design is then the
preferred choice as it makes efficient use of the entire experimental space.
• There are formulation factors, with lower and upper bounds, and possibly additional constraints, making
the region an irregular polyhedron.
• There are qualitative factors, with more than two levels and there is no mixed level design available, or
the mixed level design suggests too many runs to be acceptable.
• The objective is Response Surface Matter (RSM) and there are qualitative factors.
• The number of experimental runs affordable is smaller than the number of runs of any available classical
design.

More Related Content

What's hot

Response surface method
Response surface methodResponse surface method
Response surface methodIrfan Hussain
 
Central Composite Design
Central Composite DesignCentral Composite Design
Central Composite DesignRuchir Shah
 
Design of experiment
Design of experimentDesign of experiment
Design of experimentbhargavi1603
 
What are the applications of Biostatistics in Pharmacy?
What are the applications of Biostatistics in Pharmacy?What are the applications of Biostatistics in Pharmacy?
What are the applications of Biostatistics in Pharmacy?pharmacampus
 
Optimization techniques
Optimization techniquesOptimization techniques
Optimization techniquesprashik shimpi
 
4. Unit-IV:- Clinical Trials.
4. Unit-IV:- Clinical Trials.4. Unit-IV:- Clinical Trials.
4. Unit-IV:- Clinical Trials.Audumbar Mali
 
2. unit II, chapter-2 regulatory authorities and agencies.
2. unit II, chapter-2 regulatory authorities and agencies.2. unit II, chapter-2 regulatory authorities and agencies.
2. unit II, chapter-2 regulatory authorities and agencies.Audumbar Mali
 
Factorial design M Pharm 1st Yr.
Factorial design M Pharm 1st Yr.Factorial design M Pharm 1st Yr.
Factorial design M Pharm 1st Yr.Sanket Chordiya
 
Optimization techniques
Optimization techniquesOptimization techniques
Optimization techniquespradnyashinde7
 
Optimization techniques in pharmaceutical formulation and processing
Optimization techniques in pharmaceutical formulation and processingOptimization techniques in pharmaceutical formulation and processing
Optimization techniques in pharmaceutical formulation and processingPratiksha Chandragirivar
 
factorial design.pptx
factorial design.pptxfactorial design.pptx
factorial design.pptxSreeLatha98
 
Introduction to Research.pdf
Introduction to Research.pdfIntroduction to Research.pdf
Introduction to Research.pdfRavinandan A P
 
Quality risk management
Quality risk managementQuality risk management
Quality risk managementimran bakshi
 
Implantable Drug Delivery System
Implantable Drug Delivery SystemImplantable Drug Delivery System
Implantable Drug Delivery SystemSourav Kar
 

What's hot (20)

Response surface method
Response surface methodResponse surface method
Response surface method
 
Optimization techniques
Optimization techniques Optimization techniques
Optimization techniques
 
Central Composite Design
Central Composite DesignCentral Composite Design
Central Composite Design
 
Design of experiment
Design of experimentDesign of experiment
Design of experiment
 
What are the applications of Biostatistics in Pharmacy?
What are the applications of Biostatistics in Pharmacy?What are the applications of Biostatistics in Pharmacy?
What are the applications of Biostatistics in Pharmacy?
 
Optimization techniques
Optimization techniquesOptimization techniques
Optimization techniques
 
4. Unit-IV:- Clinical Trials.
4. Unit-IV:- Clinical Trials.4. Unit-IV:- Clinical Trials.
4. Unit-IV:- Clinical Trials.
 
2. unit II, chapter-2 regulatory authorities and agencies.
2. unit II, chapter-2 regulatory authorities and agencies.2. unit II, chapter-2 regulatory authorities and agencies.
2. unit II, chapter-2 regulatory authorities and agencies.
 
Factorial design M Pharm 1st Yr.
Factorial design M Pharm 1st Yr.Factorial design M Pharm 1st Yr.
Factorial design M Pharm 1st Yr.
 
WHO Guidance on Technology Transfers
WHO Guidance on Technology TransfersWHO Guidance on Technology Transfers
WHO Guidance on Technology Transfers
 
Optimization techniques
Optimization techniquesOptimization techniques
Optimization techniques
 
Optimization techniques in pharmaceutical formulation and processing
Optimization techniques in pharmaceutical formulation and processingOptimization techniques in pharmaceutical formulation and processing
Optimization techniques in pharmaceutical formulation and processing
 
Experimental design techniques
Experimental design techniquesExperimental design techniques
Experimental design techniques
 
Regulatory affairs
Regulatory affairsRegulatory affairs
Regulatory affairs
 
factorial design.pptx
factorial design.pptxfactorial design.pptx
factorial design.pptx
 
Safety Data Generation
Safety Data GenerationSafety Data Generation
Safety Data Generation
 
Social problems of sick
Social problems of sickSocial problems of sick
Social problems of sick
 
Introduction to Research.pdf
Introduction to Research.pdfIntroduction to Research.pdf
Introduction to Research.pdf
 
Quality risk management
Quality risk managementQuality risk management
Quality risk management
 
Implantable Drug Delivery System
Implantable Drug Delivery SystemImplantable Drug Delivery System
Implantable Drug Delivery System
 

Similar to RESPONSE SURFACE METHODOLOGY.pptx

How_to_Prepare_Research_Proposal.pptx
How_to_Prepare_Research_Proposal.pptxHow_to_Prepare_Research_Proposal.pptx
How_to_Prepare_Research_Proposal.pptxSonaKumar13
 
writing research proposal (education).pptx
writing research proposal (education).pptxwriting research proposal (education).pptx
writing research proposal (education).pptxDrAmanSaxena
 
Rubric assignment 1
Rubric   assignment 1Rubric   assignment 1
Rubric assignment 1kompellark
 
BRM PPT 1.pptxbufyf6f7f6fydyddddfftsr6sidfg
BRM  PPT  1.pptxbufyf6f7f6fydyddddfftsr6sidfgBRM  PPT  1.pptxbufyf6f7f6fydyddddfftsr6sidfg
BRM PPT 1.pptxbufyf6f7f6fydyddddfftsr6sidfgAMANPathak744625
 
Business research methods lecture3
Business research methods lecture3Business research methods lecture3
Business research methods lecture3Shahi Raz Akhtar
 
Stage of research process.pptx
Stage of research process.pptxStage of research process.pptx
Stage of research process.pptxMohammedAbdela7
 
Guidelinesforproposalwriting.ppt
Guidelinesforproposalwriting.pptGuidelinesforproposalwriting.ppt
Guidelinesforproposalwriting.pptTeshome62
 
Researchmethods_astract_title_problem.pptx
Researchmethods_astract_title_problem.pptxResearchmethods_astract_title_problem.pptx
Researchmethods_astract_title_problem.pptxBryan Dominic Bloo
 
Analysing qualitative data from information organizations
Analysing qualitative data from information organizationsAnalysing qualitative data from information organizations
Analysing qualitative data from information organizationsAleeza Ahmad
 
Design Methodology.pdf
Design Methodology.pdfDesign Methodology.pdf
Design Methodology.pdfabbasreza5
 
Chapter research design
Chapter  research designChapter  research design
Chapter research designkishor bhamare
 
Lecture_2_design_theory.pptx
Lecture_2_design_theory.pptxLecture_2_design_theory.pptx
Lecture_2_design_theory.pptxSharpEyu
 
Standard format of report writing ---11
Standard format of report writing ---11Standard format of report writing ---11
Standard format of report writing ---11mohdmx123
 

Similar to RESPONSE SURFACE METHODOLOGY.pptx (20)

How_to_Prepare_Research_Proposal.pptx
How_to_Prepare_Research_Proposal.pptxHow_to_Prepare_Research_Proposal.pptx
How_to_Prepare_Research_Proposal.pptx
 
writing research proposal (education).pptx
writing research proposal (education).pptxwriting research proposal (education).pptx
writing research proposal (education).pptx
 
Rubric assignment 1
Rubric   assignment 1Rubric   assignment 1
Rubric assignment 1
 
BRM PPT 1.pptxbufyf6f7f6fydyddddfftsr6sidfg
BRM  PPT  1.pptxbufyf6f7f6fydyddddfftsr6sidfgBRM  PPT  1.pptxbufyf6f7f6fydyddddfftsr6sidfg
BRM PPT 1.pptxbufyf6f7f6fydyddddfftsr6sidfg
 
Business research methods lecture3
Business research methods lecture3Business research methods lecture3
Business research methods lecture3
 
ES_140_METHODS_OF_RESEARCH.pdf
ES_140_METHODS_OF_RESEARCH.pdfES_140_METHODS_OF_RESEARCH.pdf
ES_140_METHODS_OF_RESEARCH.pdf
 
Clinical protocol
Clinical protocolClinical protocol
Clinical protocol
 
Stage of research process.pptx
Stage of research process.pptxStage of research process.pptx
Stage of research process.pptx
 
Guidelinesforproposalwriting.ppt
Guidelinesforproposalwriting.pptGuidelinesforproposalwriting.ppt
Guidelinesforproposalwriting.ppt
 
Researchmethods_astract_title_problem.pptx
Researchmethods_astract_title_problem.pptxResearchmethods_astract_title_problem.pptx
Researchmethods_astract_title_problem.pptx
 
lrm.pptx
lrm.pptxlrm.pptx
lrm.pptx
 
Analysing qualitative data from information organizations
Analysing qualitative data from information organizationsAnalysing qualitative data from information organizations
Analysing qualitative data from information organizations
 
Research design svuku
Research design   svukuResearch design   svuku
Research design svuku
 
Design Methodology.pdf
Design Methodology.pdfDesign Methodology.pdf
Design Methodology.pdf
 
Chapter research design
Chapter  research designChapter  research design
Chapter research design
 
Lecture_2_design_theory.pptx
Lecture_2_design_theory.pptxLecture_2_design_theory.pptx
Lecture_2_design_theory.pptx
 
Rm17 45 241-280
Rm17 45 241-280Rm17 45 241-280
Rm17 45 241-280
 
lecture-8.pdf
lecture-8.pdflecture-8.pdf
lecture-8.pdf
 
Standard format of report writing ---11
Standard format of report writing ---11Standard format of report writing ---11
Standard format of report writing ---11
 
zero.pptx
zero.pptxzero.pptx
zero.pptx
 

Recently uploaded

COMMUNICATING NEGATIVE NEWS - APPROACHES .pptx
COMMUNICATING NEGATIVE NEWS - APPROACHES .pptxCOMMUNICATING NEGATIVE NEWS - APPROACHES .pptx
COMMUNICATING NEGATIVE NEWS - APPROACHES .pptxannathomasp01
 
Sensory_Experience_and_Emotional_Resonance_in_Gabriel_Okaras_The_Piano_and_Th...
Sensory_Experience_and_Emotional_Resonance_in_Gabriel_Okaras_The_Piano_and_Th...Sensory_Experience_and_Emotional_Resonance_in_Gabriel_Okaras_The_Piano_and_Th...
Sensory_Experience_and_Emotional_Resonance_in_Gabriel_Okaras_The_Piano_and_Th...Pooja Bhuva
 
Accessible Digital Futures project (20/03/2024)
Accessible Digital Futures project (20/03/2024)Accessible Digital Futures project (20/03/2024)
Accessible Digital Futures project (20/03/2024)Jisc
 
Play hard learn harder: The Serious Business of Play
Play hard learn harder:  The Serious Business of PlayPlay hard learn harder:  The Serious Business of Play
Play hard learn harder: The Serious Business of PlayPooky Knightsmith
 
Interdisciplinary_Insights_Data_Collection_Methods.pptx
Interdisciplinary_Insights_Data_Collection_Methods.pptxInterdisciplinary_Insights_Data_Collection_Methods.pptx
Interdisciplinary_Insights_Data_Collection_Methods.pptxPooja Bhuva
 
Tatlong Kwento ni Lola basyang-1.pdf arts
Tatlong Kwento ni Lola basyang-1.pdf artsTatlong Kwento ni Lola basyang-1.pdf arts
Tatlong Kwento ni Lola basyang-1.pdf artsNbelano25
 
UGC NET Paper 1 Unit 7 DATA INTERPRETATION.pdf
UGC NET Paper 1 Unit 7 DATA INTERPRETATION.pdfUGC NET Paper 1 Unit 7 DATA INTERPRETATION.pdf
UGC NET Paper 1 Unit 7 DATA INTERPRETATION.pdfNirmal Dwivedi
 
PANDITA RAMABAI- Indian political thought GENDER.pptx
PANDITA RAMABAI- Indian political thought GENDER.pptxPANDITA RAMABAI- Indian political thought GENDER.pptx
PANDITA RAMABAI- Indian political thought GENDER.pptxakanksha16arora
 
Transparency, Recognition and the role of eSealing - Ildiko Mazar and Koen No...
Transparency, Recognition and the role of eSealing - Ildiko Mazar and Koen No...Transparency, Recognition and the role of eSealing - Ildiko Mazar and Koen No...
Transparency, Recognition and the role of eSealing - Ildiko Mazar and Koen No...EADTU
 
Exploring_the_Narrative_Style_of_Amitav_Ghoshs_Gun_Island.pptx
Exploring_the_Narrative_Style_of_Amitav_Ghoshs_Gun_Island.pptxExploring_the_Narrative_Style_of_Amitav_Ghoshs_Gun_Island.pptx
Exploring_the_Narrative_Style_of_Amitav_Ghoshs_Gun_Island.pptxPooja Bhuva
 
Towards a code of practice for AI in AT.pptx
Towards a code of practice for AI in AT.pptxTowards a code of practice for AI in AT.pptx
Towards a code of practice for AI in AT.pptxJisc
 
21st_Century_Skills_Framework_Final_Presentation_2.pptx
21st_Century_Skills_Framework_Final_Presentation_2.pptx21st_Century_Skills_Framework_Final_Presentation_2.pptx
21st_Century_Skills_Framework_Final_Presentation_2.pptxJoelynRubio1
 
How to Create and Manage Wizard in Odoo 17
How to Create and Manage Wizard in Odoo 17How to Create and Manage Wizard in Odoo 17
How to Create and Manage Wizard in Odoo 17Celine George
 
FICTIONAL SALESMAN/SALESMAN SNSW 2024.pdf
FICTIONAL SALESMAN/SALESMAN SNSW 2024.pdfFICTIONAL SALESMAN/SALESMAN SNSW 2024.pdf
FICTIONAL SALESMAN/SALESMAN SNSW 2024.pdfPondicherry University
 
AIM of Education-Teachers Training-2024.ppt
AIM of Education-Teachers Training-2024.pptAIM of Education-Teachers Training-2024.ppt
AIM of Education-Teachers Training-2024.pptNishitharanjan Rout
 
HMCS Max Bernays Pre-Deployment Brief (May 2024).pptx
HMCS Max Bernays Pre-Deployment Brief (May 2024).pptxHMCS Max Bernays Pre-Deployment Brief (May 2024).pptx
HMCS Max Bernays Pre-Deployment Brief (May 2024).pptxEsquimalt MFRC
 
QUATER-1-PE-HEALTH-LC2- this is just a sample of unpacked lesson
QUATER-1-PE-HEALTH-LC2- this is just a sample of unpacked lessonQUATER-1-PE-HEALTH-LC2- this is just a sample of unpacked lesson
QUATER-1-PE-HEALTH-LC2- this is just a sample of unpacked lessonhttgc7rh9c
 
How to Manage Call for Tendor in Odoo 17
How to Manage Call for Tendor in Odoo 17How to Manage Call for Tendor in Odoo 17
How to Manage Call for Tendor in Odoo 17Celine George
 
Python Notes for mca i year students osmania university.docx
Python Notes for mca i year students osmania university.docxPython Notes for mca i year students osmania university.docx
Python Notes for mca i year students osmania university.docxRamakrishna Reddy Bijjam
 

Recently uploaded (20)

COMMUNICATING NEGATIVE NEWS - APPROACHES .pptx
COMMUNICATING NEGATIVE NEWS - APPROACHES .pptxCOMMUNICATING NEGATIVE NEWS - APPROACHES .pptx
COMMUNICATING NEGATIVE NEWS - APPROACHES .pptx
 
Sensory_Experience_and_Emotional_Resonance_in_Gabriel_Okaras_The_Piano_and_Th...
Sensory_Experience_and_Emotional_Resonance_in_Gabriel_Okaras_The_Piano_and_Th...Sensory_Experience_and_Emotional_Resonance_in_Gabriel_Okaras_The_Piano_and_Th...
Sensory_Experience_and_Emotional_Resonance_in_Gabriel_Okaras_The_Piano_and_Th...
 
Accessible Digital Futures project (20/03/2024)
Accessible Digital Futures project (20/03/2024)Accessible Digital Futures project (20/03/2024)
Accessible Digital Futures project (20/03/2024)
 
Play hard learn harder: The Serious Business of Play
Play hard learn harder:  The Serious Business of PlayPlay hard learn harder:  The Serious Business of Play
Play hard learn harder: The Serious Business of Play
 
Interdisciplinary_Insights_Data_Collection_Methods.pptx
Interdisciplinary_Insights_Data_Collection_Methods.pptxInterdisciplinary_Insights_Data_Collection_Methods.pptx
Interdisciplinary_Insights_Data_Collection_Methods.pptx
 
Tatlong Kwento ni Lola basyang-1.pdf arts
Tatlong Kwento ni Lola basyang-1.pdf artsTatlong Kwento ni Lola basyang-1.pdf arts
Tatlong Kwento ni Lola basyang-1.pdf arts
 
UGC NET Paper 1 Unit 7 DATA INTERPRETATION.pdf
UGC NET Paper 1 Unit 7 DATA INTERPRETATION.pdfUGC NET Paper 1 Unit 7 DATA INTERPRETATION.pdf
UGC NET Paper 1 Unit 7 DATA INTERPRETATION.pdf
 
PANDITA RAMABAI- Indian political thought GENDER.pptx
PANDITA RAMABAI- Indian political thought GENDER.pptxPANDITA RAMABAI- Indian political thought GENDER.pptx
PANDITA RAMABAI- Indian political thought GENDER.pptx
 
Transparency, Recognition and the role of eSealing - Ildiko Mazar and Koen No...
Transparency, Recognition and the role of eSealing - Ildiko Mazar and Koen No...Transparency, Recognition and the role of eSealing - Ildiko Mazar and Koen No...
Transparency, Recognition and the role of eSealing - Ildiko Mazar and Koen No...
 
Exploring_the_Narrative_Style_of_Amitav_Ghoshs_Gun_Island.pptx
Exploring_the_Narrative_Style_of_Amitav_Ghoshs_Gun_Island.pptxExploring_the_Narrative_Style_of_Amitav_Ghoshs_Gun_Island.pptx
Exploring_the_Narrative_Style_of_Amitav_Ghoshs_Gun_Island.pptx
 
Towards a code of practice for AI in AT.pptx
Towards a code of practice for AI in AT.pptxTowards a code of practice for AI in AT.pptx
Towards a code of practice for AI in AT.pptx
 
VAMOS CUIDAR DO NOSSO PLANETA! .
VAMOS CUIDAR DO NOSSO PLANETA!                    .VAMOS CUIDAR DO NOSSO PLANETA!                    .
VAMOS CUIDAR DO NOSSO PLANETA! .
 
21st_Century_Skills_Framework_Final_Presentation_2.pptx
21st_Century_Skills_Framework_Final_Presentation_2.pptx21st_Century_Skills_Framework_Final_Presentation_2.pptx
21st_Century_Skills_Framework_Final_Presentation_2.pptx
 
How to Create and Manage Wizard in Odoo 17
How to Create and Manage Wizard in Odoo 17How to Create and Manage Wizard in Odoo 17
How to Create and Manage Wizard in Odoo 17
 
FICTIONAL SALESMAN/SALESMAN SNSW 2024.pdf
FICTIONAL SALESMAN/SALESMAN SNSW 2024.pdfFICTIONAL SALESMAN/SALESMAN SNSW 2024.pdf
FICTIONAL SALESMAN/SALESMAN SNSW 2024.pdf
 
AIM of Education-Teachers Training-2024.ppt
AIM of Education-Teachers Training-2024.pptAIM of Education-Teachers Training-2024.ppt
AIM of Education-Teachers Training-2024.ppt
 
HMCS Max Bernays Pre-Deployment Brief (May 2024).pptx
HMCS Max Bernays Pre-Deployment Brief (May 2024).pptxHMCS Max Bernays Pre-Deployment Brief (May 2024).pptx
HMCS Max Bernays Pre-Deployment Brief (May 2024).pptx
 
QUATER-1-PE-HEALTH-LC2- this is just a sample of unpacked lesson
QUATER-1-PE-HEALTH-LC2- this is just a sample of unpacked lessonQUATER-1-PE-HEALTH-LC2- this is just a sample of unpacked lesson
QUATER-1-PE-HEALTH-LC2- this is just a sample of unpacked lesson
 
How to Manage Call for Tendor in Odoo 17
How to Manage Call for Tendor in Odoo 17How to Manage Call for Tendor in Odoo 17
How to Manage Call for Tendor in Odoo 17
 
Python Notes for mca i year students osmania university.docx
Python Notes for mca i year students osmania university.docxPython Notes for mca i year students osmania university.docx
Python Notes for mca i year students osmania university.docx
 

RESPONSE SURFACE METHODOLOGY.pptx

  • 1. BIOSTATISTICS AND RESEARCH METHODOLOGY Unit-5: response surface methodology PRESENTED BY Gokara Madhuri B. Pharmacy IV Year UNDER THE GUIDANCE OF Gangu Sreelatha M.Pharm., (Ph.D) Assistant Professor CMR College of Pharmacy, Hyderabad. email: sreelatha1801@gmail.com
  • 2. RESPONSE SURFACE METHODOLOGY • Response surface methodology (RSM) uses various statistical,graphical, and mathematical techniques to develop, improve, or optimize a process, also use for modeling and analysis of problems if our response variables in influenced by several independent variables. Main objectives are as follow • Optimize (main objective) • Develop • Improve (if necessary) • There are three stages of RSM 1. Initial screening stage ( to identify a few important factors from many factors) 2. Sequential search stage ( to identify an optimum design region) 3. A final stage of response surface study ( to obtain an accurate approximation of the response surface)  METHODS OF RSM • There are two methods of RSM to obtain optimum response. And we move toward our optimum point with these two method
  • 3. 1. Method of Steepest Ascent 2. Method of Steepest Descent  Steepest Ascent Method • This is a procedure for moving sequentially in the direction of the maximum increase in the response getting optimum response.  Steepest Descent Method • If minimization is desired then we call this technique the “method of steepest descent”.  APPLICATIONS • The most frequent applications of RSM are in the industrial area. • RSM is important in designing formulating and developing and analyzing new specific scientific studying and product. • It is also efficient in improvements of existing studies and products. • Most common application of RSM are in industrial,biological and clinical sciences, social sciences, food sciences and physical and engineering sciences.
  • 4. CENTRAL COMPOSITE DESIGN • Central composite designs are two level full factorial (2k) or fractional factorial (2k-f) designs augmented by a number of centre points and other chosen runs. These designs are such that they allow the estimation of all the regression parameters required to fit a second order model to given response. • A second-order model can be constructed efficiently with central composite designs (CCD)(Montgomery,1997). CCD is first-order (2k) designs augmented centre and axial points to allow estimation of the tuning parameters of a second-order model. Figure below shows a CCD for 2 design variables. • Here’s a representation of a classic central composite design for 2 factors.  Four corners of the square represent the factorial (+/-1) design points.  Four star points represent the axial (+/-alpha) design points.  Replicated centre point. • Numeric factors The number of numeric factors involved in the experiment • Category factors The number of category factors involved in the experiment • Enter factors ranges in terms of +/-1 to define the limits for the area of interest where the optimum is believed to exist. Axial points will typically be outside this limit. Enter the limits in the low and high columns.
  • 5. • Alphas: to ensure that even the extreme axial runs are within the area of operability. The area of interest must be within the area of operability. Enter the limits in the –alpha and + alpha columns.  TYPES OF CENTRAL COMPOSITE DESIGN  CCC – Circumscribed CCD • Each factor studied at 5 level • Axial points establishes new high and low range  CCF – Face centered CCD • Axial points are at center of each side of factorial space  CCI – Inscribed CCD • For those situations where limit specified for each factor is real limit. • Beyond or below that level it is not possible to perform an experiment. • Here also each factor studied at 5 level • It is a scaled down of CCC design
  • 6. • Blocks: central composite designs can be split into blocks. The factorial design is split into sub- fractions that support the two-factor interaction model and the axial points in the final block if needed. • Options button: click on the options button to change the axial (alpha) distance which is how far the star points will be from the centre in coded units. Use the help button on the options dialog for more information. • The points area provides a preview of the number and type of runs that will be in the design.  BOX-BEHNKEN DESIGN • The diagram represents the classic box-Behnken(BB) design for 3 factors. • Blocks: some box-Behnken designs can be blocked. The number of blocks depends on the number of factors. If you need blocks in your design and the BB design cannot do what you need, switch to an optimal design. • Centre points: By default there will be some- centre points in a BB design, The number varies somewhat with the number of factors and blocks. Adding more centre points is okay. Removing centre points will adversely affect the designs precision capability.
  • 7. HISTORICAL DESIGN • Historical Research Design: This method involves the systematic and objective location, evaluation, and synthesis of evidence to establish facts and draw conclusions about past events. Historical research aims to show the importance of past events in the present situation. • This research can provide a perspective for decision-making about current problems and some issues are often better understood if we understand the historical perspective. • The research solely depends upon secondary data such as books, journals, magazines, newspapers, historical records, diaries, documents, etc. There are very limited sources of historical information and many assumptions are found in this research. CHARACTERISTICS OF HISTORICAL RESEARCH DESIGN • Historical research involves the careful study and analysis of data about past events. • The purpose is to gain a clearer understanding of the impact of the past on the present and future events related to the life process. • It is a critical investigation of events, their development, experiences the past. • Involves the review of written materials but may include oral documentation as well. • It covers categories such as historical legal, documentary, bibliographical, biographical institutional and organizational.
  • 8. • Typically relies on available data which are in form of diaries, letters, newspapers, reports, and so on  DIFFERENT STEPS IN HISTORICAL RESEARCH DESIGN ARE AS FOLLOWS 1. DATA COLLECTION • Historical sources of data are classified into two main categories such as primary sources and secondary sources Primary sources are first-hand information that includes relics associated with persons, groups, periods, or events. • Fossils, skeletons, tools, weapons, utensils, clothing, furniture, pictures, painting, coins, and art objects are examples of remains that were not deliberately intended for use in transmitting information or to be used as a record. • Documents called primary sources are constitutions, characters, laws, official records, deeds, licenses, newspapers, magazines, etc. • Secondary sources are the reports of people who related the testimony of an actual witness of an event or actual participants in the same. For example most of the history books and encyclopedias. 2. CRITICISM OF THE DATA • The second step necessitates a comprehensive review of gathered materials. External criticism is the establishment of validity by determining the authenticity of the source. • It primarily deals with data relating to form and appearance rather than the meaning of contents, while
  • 9. internal criticism weighs the testimony of the document about truth. • Internal criticism is the determination of reliability by correctly interpreting the contents of the documents. • The use of original, authentic sources; awareness of one’s biases; the substantiation of the document in question by another collaborating source are a few of the safeguards used to ensure that interpretations are correct. • After the authenticity of a historical document or relic has been established, the next question is to establish the validity of its contents or to determine the accuracy and value of the statement made. 3. PRESENTATION OF THE FACTS • The historical researcher must bring the material together to analyze and test the research hypotheses after evaluating the authenticity and accuracy of data. • Historical researchers must be careful at this point since the analysis of historical data involves logical processes rather than statistical ones. The organization of historical material can also be done in a topical, thematic, or functional arrangement. • The historical research is not involved in the situation that is studied and the researchers do not interact with the subjects of study. • Analysis of historical data may help explain current and future events.
  • 10. • There are many limitations of historical research as historical data is incomplete and vulnerable to time and it can also be biased and corrupt. • Historical research is a complex process because the topics of research are affected by numerous factors that need to be considered. • PURPOSE OF HISTORICAL RESEARCH • To solve contemporary problems. • Learn from past failures and success. • Make prediction. • To re-evaluate- data in relation to selected hypothesis, theories and generalizations. • To understand how and why educational theories and practices developed. Example of historical research studies • A historical research on the development of nursing in Nepal. • A historical research on the development of nursing education in Nepal.
  • 11. ADVANTAGES • Many current educational practices, theories and issues can be better understood in the light of past experiences. • Researchers can apply scientific objectivity in attempting to determine exactly what did happen in the past. • If well-done, this research involves systematic, objective data collection and analysis. DISADVANTAGES • In conducting historical research, the researcher can neither manipulate nor control any of the variables. • There is no way, historical researcher can affect events of the past. • Historical research cannot collect data by administering instruments. • Historical research is limited to whatever data are available. • Historical research excessively relies on secondary source of data.
  • 12. OPTIMIZATION TECHNIQUES OPTIMIZATION USING FACTORIAL DESIGNS • The term Optimize is defined as to make perfect , effective , or as functional as possible. • It is the process of finding the best way of using the existing resources while taking in to the account of all the factors that influences decisions in any experiment • Traditionally, optimization in pharmaceuticals refer to changing one variable at a time, so to obtain solution of a problematic formulation. Modern pharmaceutical optimization involves systematic design of experiments (DoE) to improve formulation irregularities. • In the other word we can say that –quantitate a formulation that has been qualitatively determined . It’s not a screening technique. • In factorial designs, levels of factors are independently varied, each factor at two or more levels. The effects that can be attributed to the factors and their interactions are assessed with maximum efficiency in factorial designs. • Also, factorial designs allow for the estimation of the effects of each factor and interaction, unconfounded by the other experimental factors. Thus, if the effect of increasing stearic acid by 1mg is to decrease the dissolution by 10%, in the absence of interactions, this effect is independent of the levels of the other factors.
  • 13. Reducing cost Reproducib ility Why is Optimization necessary? Primary objective may not be optimize absolutely but to compromise effectively & thereby produce the best formulation under a given set of restrictions .
  • 15. A) Problem type: a) Constrained type • Constrained types are, restrictions placed on the system by means of a physical limitations or perhaps by simply practical based. This can best explained by taking hardness of tablet and its disintegrate time in less than 15 min. b) Unconstrained type • In unconstrained type there are no restrictions placed on the system by means of a physical limitations or perhaps by simply practical based. • But in pharmaceuticals, there is always a limitation of a means of a physical limitation or perhaps by simply practically the formulator wishes to place or must place on a System. • So, in pharmaceuticals the unconstrained optimization problem is almost negligible. • For a given pharmaceutical system one might wish to make the hardest tablet possible. • The making of the hardest tablet is the unconstrained optimization problem. B) Variables • There are several Variables in pharmaceutical formulation and processing but generally variables can be classified into : a) independent variables b) dependent variables a) Independent variables: • These are the variables which are directly under the control of the formulator. These might include the compression force or the die cavity filling or the mixing time.
  • 16. b) Dependent variables: • The dependent variables are the responses or the characteristics that are developed due to the independent variables. The more the variables that are present in the system the more the complications that are involved in the optimization. • These are the variables which are not directly under the control of the formulator, these variables are the responses or the characteristics of the in process materials or the results. These are a direct result of any change in the formulation or a process such as homogeneity of the mixed granules.
  • 17. Optimization Process: • In general the optimization process involves the following steps: 1. Analysis and define the problems • a) What are the objectives? • b) What is the nature of problem? • c) What is not known? • d) What is already known? 2. Based on previous Knowledge and data, a preliminary choice can be made such as which process is to be adopted and which excipients are to be used. 3. Selection of a model, based on the results of the factor screening. 4. The experiments are designed accordingly and are executed. 5. The responses are analyzed for statistics by ANOVA. Test on lack of fit is done to get an empirical mathematical model for each individual responses. 6. The responses are screened by using multiple criteria to get the values of independent variables. For example restriction of hardness to 6-8 kg/cm2 and disintegration time < 5 min for a tablet formulation to get the most probable values of the independent variables such as type of lubricants or their concentration, disintegrating agent, etc.
  • 18. • EXPERIMENTAL DESIGNS: • Experimental design is a statistical design that prescribes or advises a set of combination of variables. The number and layout of these design points within the experimental region depends on the number of effects that must be estimated. • Depending on the number of factors, their levels, possible interactions and order of the model, various experimental designs are chosen. Each experiment can be represented as a point within the experimental domain. The point being defined by its co-ordinate (the Value given to variables) in the space. I) Factorial Design: • History • Factorial designs were used in the 19th century by John Bennet Lawes and Joseph Henry Gilbert.Ronald Fisher argued in 1926 that “complex” designs (such as factorial designs) were more efficient than studying one factor at a time. • A factorial design allows the effect of several factors and even interactions between them to be determined with the same number of trials as are necessary to determine any one of the effects by itself with the same degree. First, whenever we are interested in examining treatment variations, factorial designs should be strong candidates as the designs of choice. Second, factorial designs are efficient. Instead of conducting a series of independent studies we are effectively able to combine these studies into one. Finally, factorial designs are the only effective way to examine interaction effects. a) Full factorial design • It is an experimental design, which uses dimensional factor space at the corner of the design space. Factorial designs are used in experiments where the effects of different factors or conditions on choice for simultaneous determination of the effect of several factors and their interactions.
  • 19. • The simplest factorial design is the 2 factorial designs, where two factors are considered each at two levels, leads to four experiments, which are situated in 2-dimensional factor space at the corners of a rectangle. • If there are 3 factors, each at two levels, eight experiments are necessary which are situated at the corners of an orthogonal cube on a 3 dimensional space. The number of experiments is given by 2, where ‘n’ is the number of factors. • If the number of factors and levels are large, then the number of experiments needed to complete a factorial design is large. • To reduce the number of experiments, fractional factorial design can be used (i.e., ½ or ¼ of the original number of experiments with full factorial design). • The fitting of an empirical polynomial equation to the experimental result facilitates the optimization procedure. The general polynomial equation is as follows: • Y = B0 + B1X1 + B2 X2 + B3 X3 + + B12 X1X2 + B13X1X3 + B23X2X3 —- • Where Y is the response, X1, X2, X3 are the levels (concentration) of the 1, 2, 3 factors and B1, B2, B3, B12, B13, B23, are the polynomial coefficients,B0 is the intercept (which represents the response when the level of all factors is low). b. Plackett-Burman Design • It is a fractional factorial design with K = m*4 experiment, for screening of (K-i) variables. Where K is the number of variables and m is the number of levels.
  • 20. c. Star Design • Star design is simply a 22 factorial design rotated over 45° angle in the space. A center point is usually added, which may be replicated to estimate experimental error, so there will be three levels for each factor where quadratic effect can be measured, but the interaction effect cannot be measured as in case of the full factorial design. In star design, 2k factorial designs are rotated over 45° in (k-i) direction in k- dimensional space with a replicated center point. k is the number of factors in the design. This results in 2k+R experiments, where R is the replicate of the center point. d. Central Composite Design. • A better design that encompasses the advantages of factorial design or fractional factorial design or the star design, is the central composite design(CCD). This design is developed by Box and Wilson. It is composed of +2k Factorial design or Fractional factorial design. • 2* k star design. • This design enables the estimation of a full second-order model. The equation for two factors is given by B0 + B1 X1+ B2 X2 + B12 X1X2 + B11 X12 + B22 X22
  • 21. II ) Box design • In central composite design each factor has five levels. If the number of factors increases, the number of experiments may become too high. The Box designs for three or more factors are economical alternative in which each factor is given three levels. • The design is called an orthogonal balanced incomplete block design. It can be split into a set of incomplete blocks, which means that every effect is not estimated in every block, but every factor effect is measured as equal number of times with a balanced partition over the different blocks. III) Doehiert Hexagon or Uniform Shell design • Doehiert proposed uniform shell designs, starting with an equilateral triangle, mirrored in one side to a hexagon. The hexagon is expandable in 2- dimensional space by mirroring the center point in the outward sides. The equally spaced design points are uniformly distributed in concentric circles. It is also expandable in 3-dimension to concentric spherical shells. Due to the uniform distribution, models based on this design provide, a good basis for interpolation. • A disadvantage may be that the number of levels is not same for all factors. The design may be started with one side of the hexagon parallel to the most important axis. IV) Mixture design: • For mixtures of components (such as drugs and excipients in the formulation), special models have been derived, based on the mixture constraints.
  • 22. • A fraction cannot be negative, and sum of the fractions of the components should be equal to one. An important property is that the number of coefficients to be estimated is reduced. The mixture constraint has consequences for the experimental designs. Factors cannot be chosen freely. In a two-component mixture, only one faction (variable) can be chosen, while in three component mixture only two fractions and so on. The remaining fraction completes the sum to one, which implies a dimension reduction. For k variable, the factor space can be represented geometrically by a (k-1) dimensional regular simplex, for two components a line, for three, a triangle and for four a tetrahedron. V) Simplex Lattice design • Simplex Lattice designs are used to explore the interior and the boundaries of the simplex. The number of factors determines its dimensions. The pattern of design points in the factor space and their number depend on the degree (the term of highest order) of the model that is postulated. The points are distributed orderly over the factor space, forming a lattice. The factors can be controlled accurately and precisely. The coefficients of model equations can be calculated easily. VI) Extreme-Vertices design • It often occurs in formulation studies that the whole factor space is not accessible for experiment or that some areas are expected not to give useful responses. In an Extreme-Vertices design, observations are made at the corners of the bounded design space, at the middle of the edges and at the center of the design space. These can be used for the mixture composition as well as in combination with factorial designs.
  • 23. VII ) Evolutionary methods: • In the method the formulator makes a very small change in the formulation or process, but it makes so many times That he or she can determine statistical whether the product has improved. If it has be makes another change in the same direction many times and notes. The results continues until further change do not improve the product. • This methods is useful where there is a continue production but due to the reasons like i) EVOP is not substitute to G.M.P ii) due to regulatory subject iii) because of the necessarily small changes utilized, it is not particularly suitable for lab. VIII) D-Optimal: • “D-Optimal” means that these designs maximize the information in the selected set of experimental runs with respect to a stated model. The D-Optimal design maximizes the determinant, of which is an overall measure of the information. Geometrically, this corresponds to maximizing the volume in a dimensional space. A D-Optimal design is suggested when: • There is a linear constraint on the factor settings, reducing the experimental region to an irregular polyhedron. There are no classical designs that can well investigate an irregular region. A D-Optimal design is then the preferred choice as it makes efficient use of the entire experimental space.
  • 24. • There are formulation factors, with lower and upper bounds, and possibly additional constraints, making the region an irregular polyhedron. • There are qualitative factors, with more than two levels and there is no mixed level design available, or the mixed level design suggests too many runs to be acceptable. • The objective is Response Surface Matter (RSM) and there are qualitative factors. • The number of experimental runs affordable is smaller than the number of runs of any available classical design.