Download to read offline

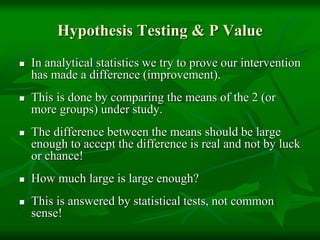


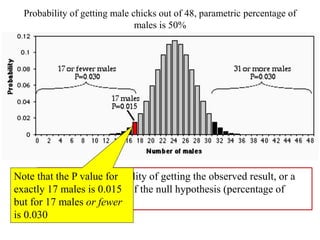
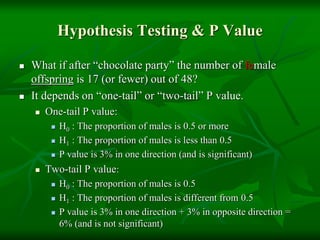
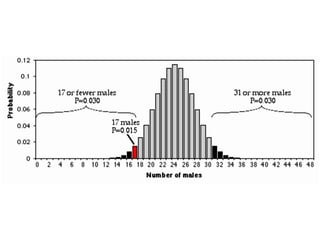

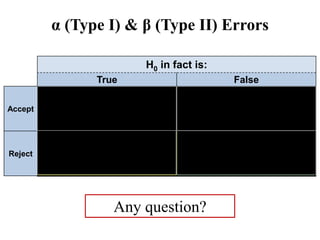

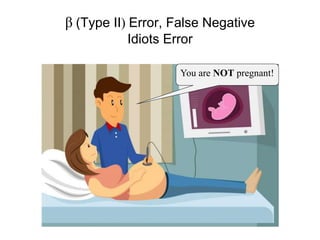

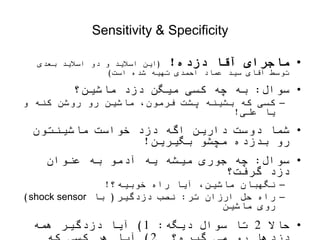


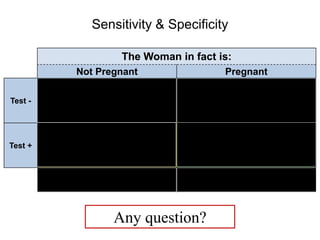
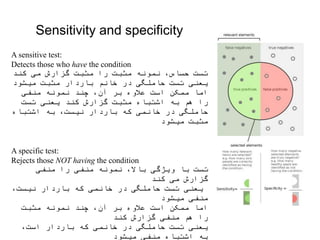

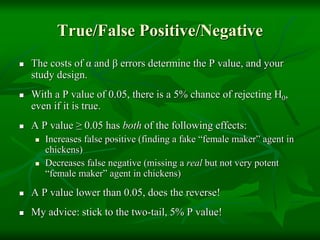
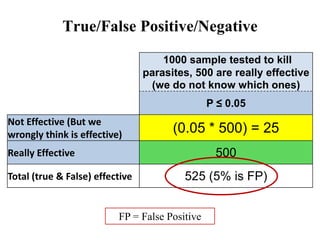
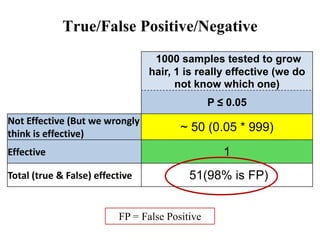
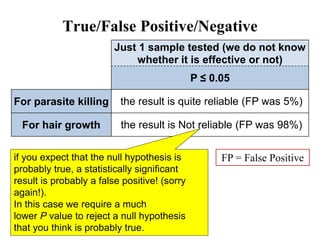

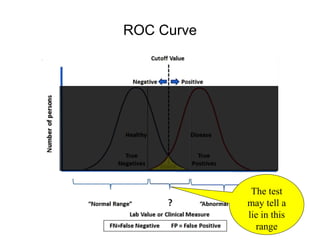
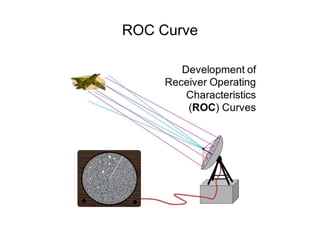

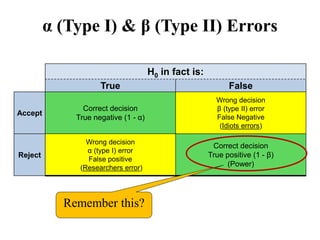


This document discusses key concepts in applied statistics including hypothesis testing, p-values, types of errors, sensitivity and specificity. It provides examples and explanations of these topics using scenarios about testing if feeding chickens chocolate changes the gender ratio of offspring. Hypothesis testing involves defining the null and alternative hypotheses and using a statistical test to either reject or fail to reject the null hypothesis based on the p-value. Type I and type II errors in hypothesis testing are explained. Sensitivity and specificity in diagnostic tests are introduced using an example about detecting if a car is being stolen.