A proton density (PD) weighted MRI image visualizes the number of protons in tissues. Tissues with few protons appear dark, while those with many protons appear bright. On a PD weighted image, fat has a bright signal intensity, but not as bright as on a T1 weighted image. Fluid has an intermediate signal intensity, rather than the high intensity on a T2 weighted image. A PD weighted image is useful for evaluating meniscal tears in the knee due to the contrast between CSF and pathology.
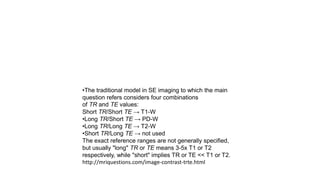
![On spin-echo (SE) imaging, the repetition time (TR) and
the echo time (TE) are used to control image contrast
and the "weighting" of the MR image. There are many
misconceptions about what the term "weighting" actually
means, so a separate Q&A is devoted to that very
subject. For now we will not specifically define what we
mean by "T1-weighting", "T2-weighting", or "PD (proton-
density) weighting" other than to say that it implies that
image contrast is significantly affected by T1, T2 or [H].
http://mriquestions.com/image-contrast-trte.html](https://image.slidesharecdn.com/protondensitypdweightedmriimage-220726124314-040991ee/85/proton-density-PD-weighted-mri-image-pptx-8-320.jpg)
![An MRI sequence in magnetic resonance imaging (MRI) is a
particular setting of pulse sequences and pulsed field gradients,
resulting in a particular image appearance.[1]
A multiparametric MRI is a combination of two or more sequences,
and/or including other specialized MRI configurations such
as spectroscopy.[2][3]
https://en.wikipedia.org/wiki/MRI_sequence#Spin_echo](https://image.slidesharecdn.com/protondensitypdweightedmriimage-220726124314-040991ee/85/proton-density-PD-weighted-mri-image-pptx-11-320.jpg)
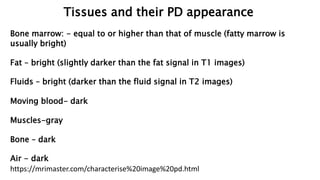
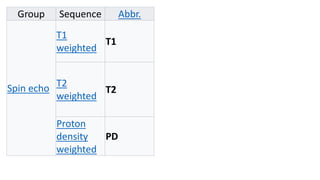
![Group Sequence Abbr. Physics Main clinical distinctions
E
x
a
m
p
l
e
Spin echo
T1 weighted T1
Measuring spin–lattice
relaxation by using a
short repetition time (TR)
and echo time (TE).
•Lower signal for more water content,[4] as
in edema, tumor, infarction, inflammation, i
nfection, hyperacute or
chronic hemorrhage.[5]
•High signal for fat[4][5]
•High signal for paramagnetic substances,
such as MRI contrast agents[5]
Standard foundation and comparison for
other sequences
T2 weighted T2
Measuring spin–spin
relaxation by using long TR and
TE times
•Higher signal for more water content[4]
•Low signal for fat[4] − Note that this only
applies to standard Spin Echo (SE)
sequences and not the more modern Fast
Spin Echo (FSE) sequence (also referred to
as Turbo Spin Echo, TSE), which is the most
commonly used technique today. In
FSE/TSE, fat will have a high signal.[6]
•Low signal for paramagnetic substances[5]
Standard foundation and comparison for
other sequences
Proton density
PD
Long TR (to reduce T1) and
[7]
•Joint disease and injury.[8]High signal
[9]](https://image.slidesharecdn.com/protondensitypdweightedmriimage-220726124314-040991ee/85/proton-density-PD-weighted-mri-image-pptx-12-320.jpg)
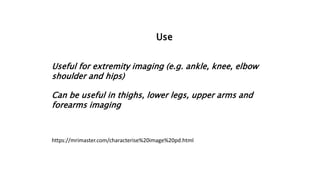
![Physics Main clinical distinctions
Measuring spin–lattice
relaxation by using a
short repetition
time (TR) and echo
time (TE).
•Lower signal for more water content,[4] as
in edema, tumor, infarction, inflammation, infection, hyperacute or
chronic hemorrhage.[5]
•High signal for fat[4][5]
•High signal for paramagnetic substances, such as MRI contrast agents[5]
Standard foundation and comparison for other sequences
Measuring spin–spin
relaxation by using
long TR and TE times
•Higher signal for more water content[4]
•Low signal for fat[4] − Note that this only applies to standard Spin Echo
(SE) sequences and not the more modern Fast Spin Echo (FSE) sequence
(also referred to as Turbo Spin Echo, TSE), which is the most commonly
used technique today. In FSE/TSE, fat will have a high signal.[6]
•Low signal for paramagnetic substances[5]
Standard foundation and comparison for other sequences
Long TR (to reduce T1)
and short TE (to
minimize T2).[7]
•Joint disease and injury.[8]High signal from meniscus tears.[9] (pictured)](https://image.slidesharecdn.com/protondensitypdweightedmriimage-220726124314-040991ee/85/proton-density-PD-weighted-mri-image-pptx-14-320.jpg)
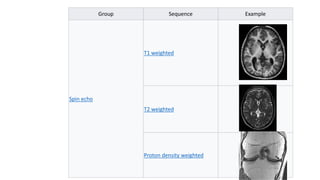
![Proton density (PD)- weighted images are created by
having a long repetition time (TR) and a short echo time
(TE).[36] On images of the brain, this sequence has a more
pronounced distinction between gray matter (bright)
and white matter (darker gray), but with little contrast
between brain and CSF.[36] It is very useful for the
detection of joint disease and injury.[37]
https://en.wikipedia.org/wiki/MRI_sequence#Spin_echo](https://image.slidesharecdn.com/protondensitypdweightedmriimage-220726124314-040991ee/85/proton-density-PD-weighted-mri-image-pptx-16-320.jpg)


![CASE_PRESENTATION_ON_subdural_hematoma(SDH)[1 FINAL PPT]-1.pptx](https://cdn.slidesharecdn.com/ss_thumbnails/casepresentationonsubduralhematomasdh1finalppt-1-260129172522-d405d375-thumbnail.jpg?width=640&height=640&fit=bounds)


