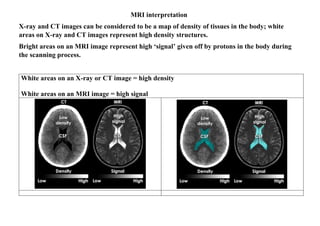
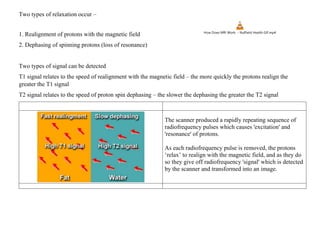
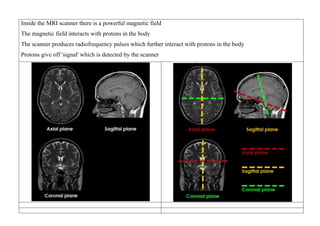
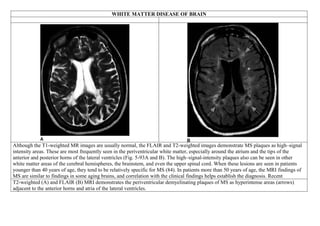
Inside the MRI scanner, there is a powerful magnetic field that interacts with protons in the body. The scanner produces radiofrequency pulses which further interact with protons, causing them to give off a signal that is detected by the scanner and transformed into images. MRI sequences such as T1-weighted, T2-weighted, FLAIR, DWI, and images with gadolinium contrast are analyzed and compared to the clinical history to identify abnormalities and arrive at a diagnosis. Diffusion tensor imaging can also be used to detect and characterize ischemic brain injuries.
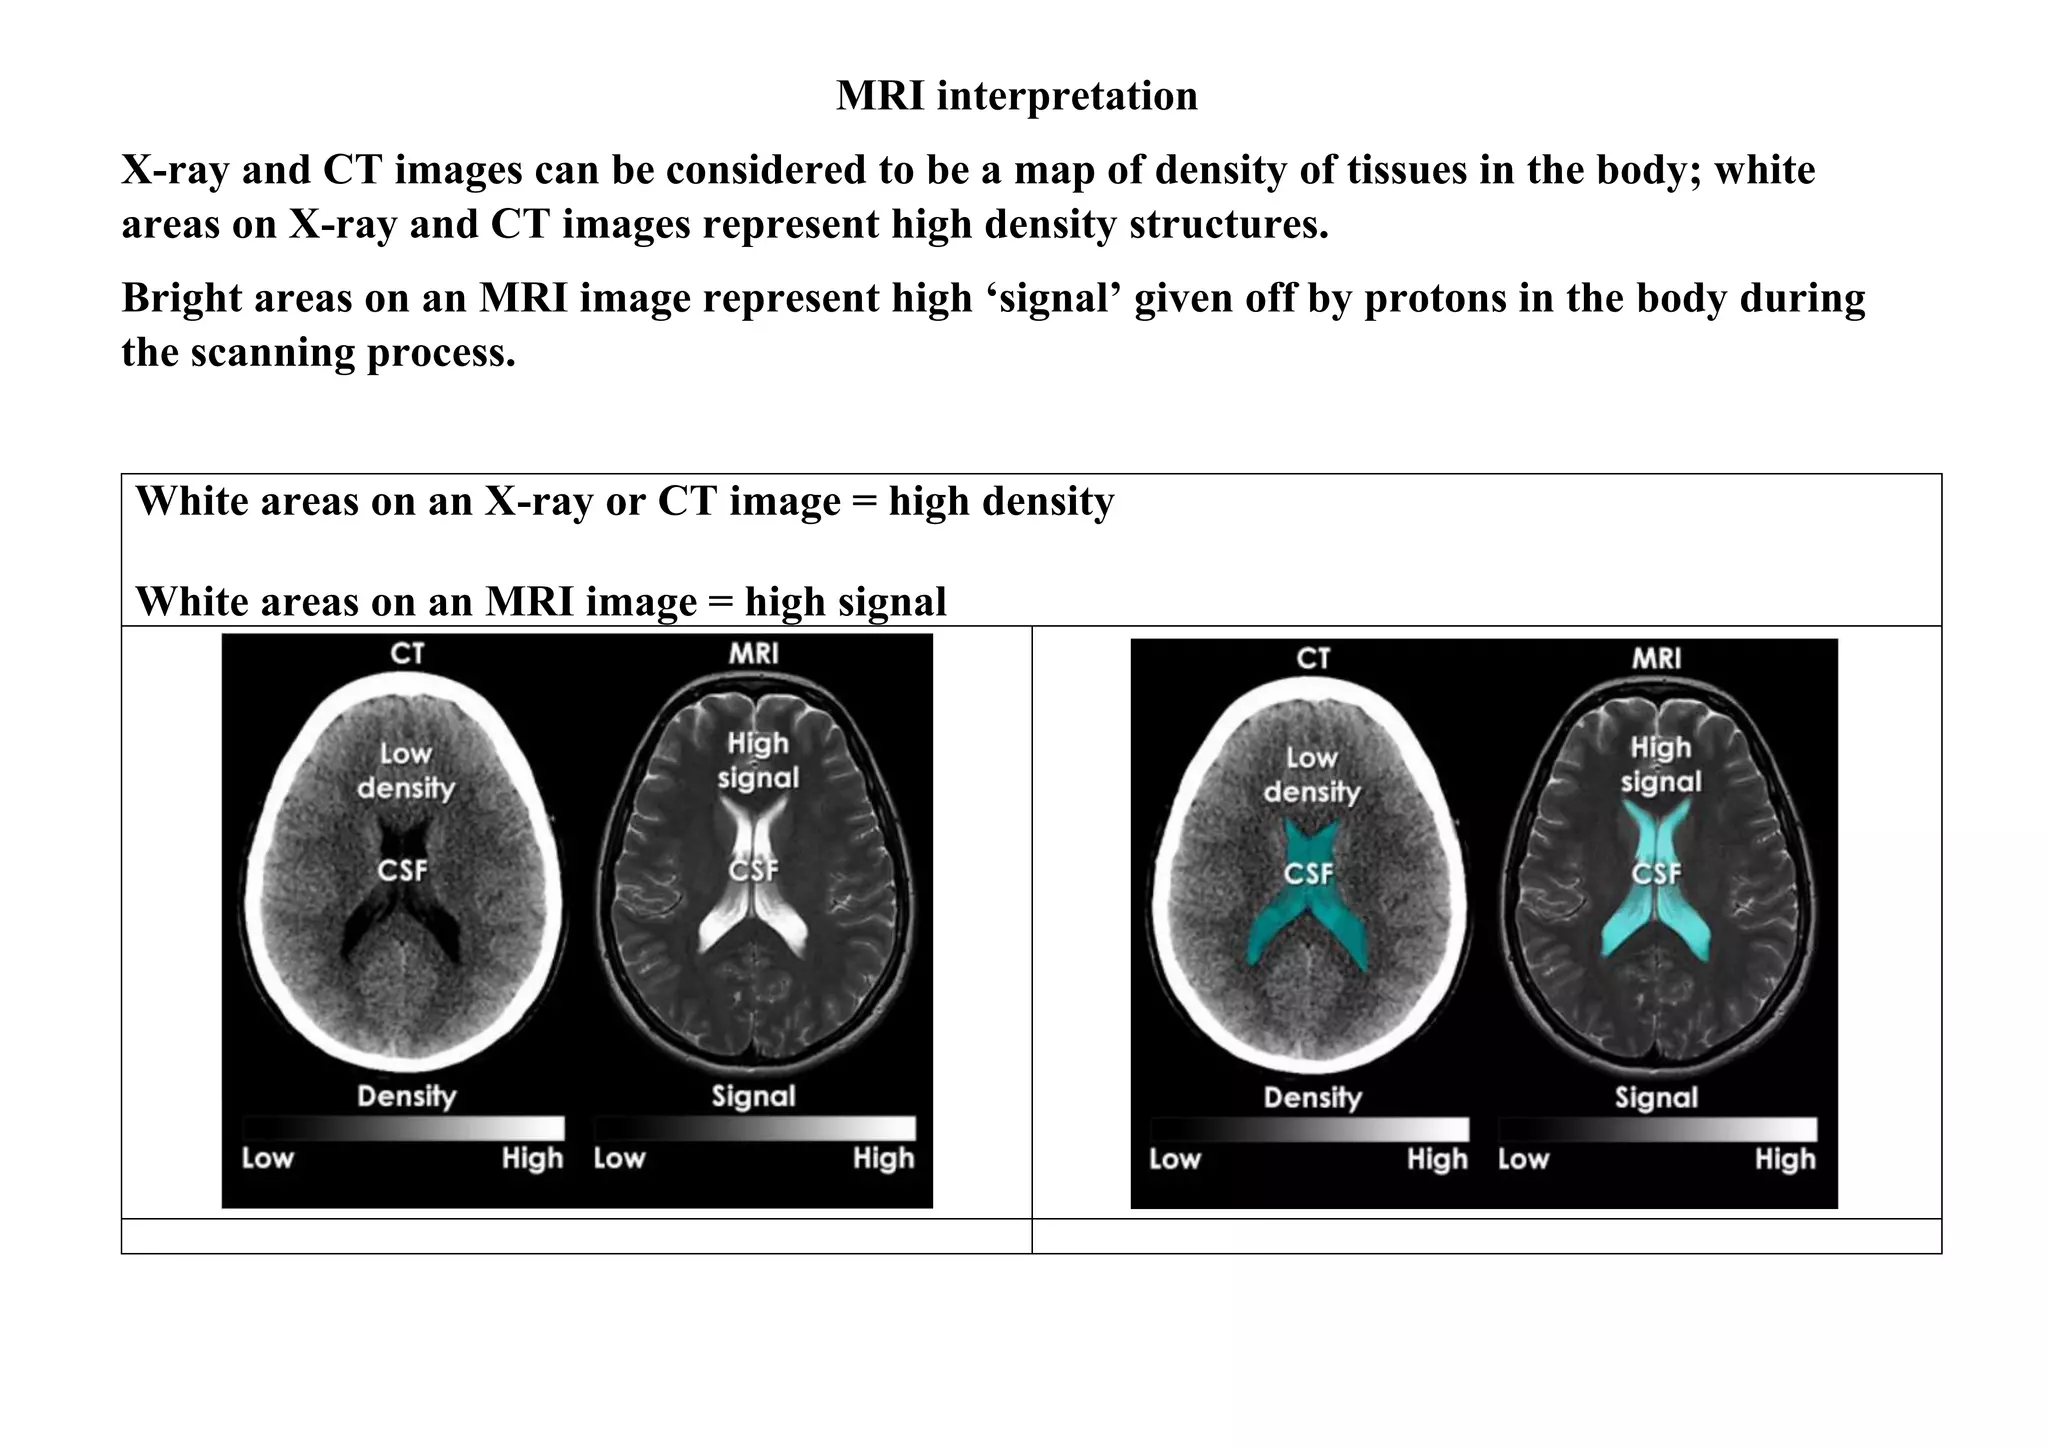
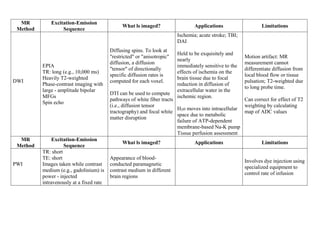
![1. MRI produces detailed images of many body parts but is not always the best imaging modality
2. A wide range of different MRI images can be produced to help answer specific clinical questions
[Project] [Stroke]
Neurophysiological and neuroimaging biomarkers are preferred over clinical behaviors for long-term
prognosis. DTI should be done after 30 days of stroke for use in prediction of recovery
3. A systematic approach is required for image interpretation
4. The successful application of MRI depends on the clinical question in mind, and the body part to be imaged.
5. MRI provides exquisite images of body parts that do not move, such as the brain, and anatomical structures
that can be kept still, such as parts of the musculoskeletal system.
6. Each set of images produced takes several minutes to obtain. MRI is not suitable for patient who are unable
or unwilling to remain motionless.
7. With some applications of MRI, drugs may be given to help reduce movement and improve image quality](https://image.slidesharecdn.com/1-230127153930-e7ee40d1/85/1-MRI-interpretation-docx-2-320.jpg)
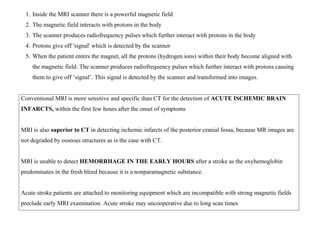
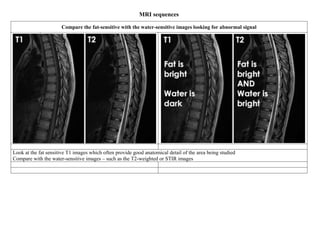
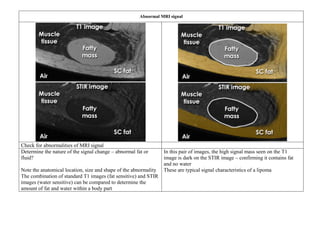
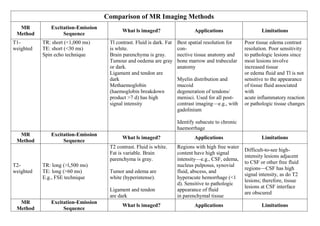
![STIR image [Short Tau Inversion Recovery] or Fat suppression and only water
STIR image – Spondylodiscitis
STIR (Short Tau Inversion Recovery) images are highly
water-sensitive and the timing of the pulse sequence used
acts to suppress signal coming from fatty tissues – so ONLY
WATER is bright
A combination of standard T1 images and STIR images can
be compared to determine the amount of fat or water within a
body part
In these MRI images abnormal signal is seen in the vertebral bodies
and intervertebral disc
Abnormal low signal on the T1 image and abnormal high signal on
the STIR image – indicates abnormal fluid [Fat should have been
there but it’s replaced by water]
These are typical appearances of spondylodiscitis (also known as
discitis)](https://image.slidesharecdn.com/1-230127153930-e7ee40d1/85/1-MRI-interpretation-docx-14-320.jpg)
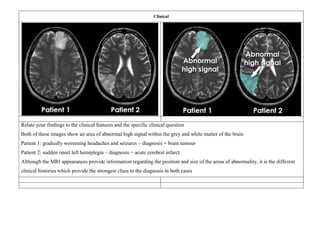
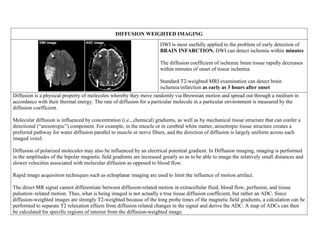
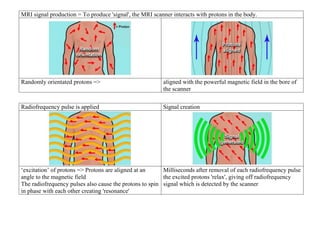
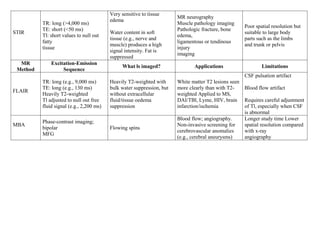
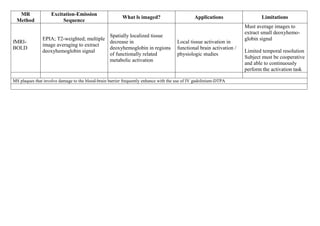
![ISCHEMIC STROKE
Goal: To see edema of an early infarct [the first few hours after the onset of symptoms.]
Sequence T1 - weighted
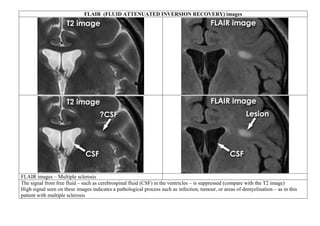
FLAIR (fluid-
attenuated inversion
recovery)
T2-weighted images
Signal Low signal intensity High signal intensity High signal intensity
Conventional MRI is more sensitive and specific than CT for the detection of acute
ischemic brain infarcts, within the first few hours after the onset of symptoms.
Axial proton density (PD) sequence. There is increased signal intensity (arrow)
due to restricted diffusion characteristic of an infarct](https://image.slidesharecdn.com/1-230127153930-e7ee40d1/85/1-MRI-interpretation-docx-24-320.jpg)


![Needle examination [DOC 1 v2].pdf](https://cdn.slidesharecdn.com/ss_thumbnails/needleexaminationdoc1v2-220917013003-7b2a4566-thumbnail.jpg?width=640&height=640&fit=bounds)


