Downloaded 137 times
![Adding Dimensions (No Evil Twins Please)
from prometheus_client import Counter
REQUESTS = Counter('requests_total',
'Total requests', ['method'])
def my_handler(request):
REQUESTS.labels(request.method).inc()
pass // Your code here](https://image.slidesharecdn.com/fosdem-prometheus-anextgenerationmonitoringsystem2-160131134536/75/Prometheus-A-Next-Generation-Monitoring-System-FOSDEM-2016-17-2048.jpg)
![Example: Top 5 Docker images by CPU
topk(5,
sum by (image)(
rate(container_cpu_usage_seconds_total{
id=~"/system.slice/docker.*"}[5m]
)
)
)](https://image.slidesharecdn.com/fosdem-prometheus-anextgenerationmonitoringsystem2-160131134536/75/Prometheus-A-Next-Generation-Monitoring-System-FOSDEM-2016-19-2048.jpg)

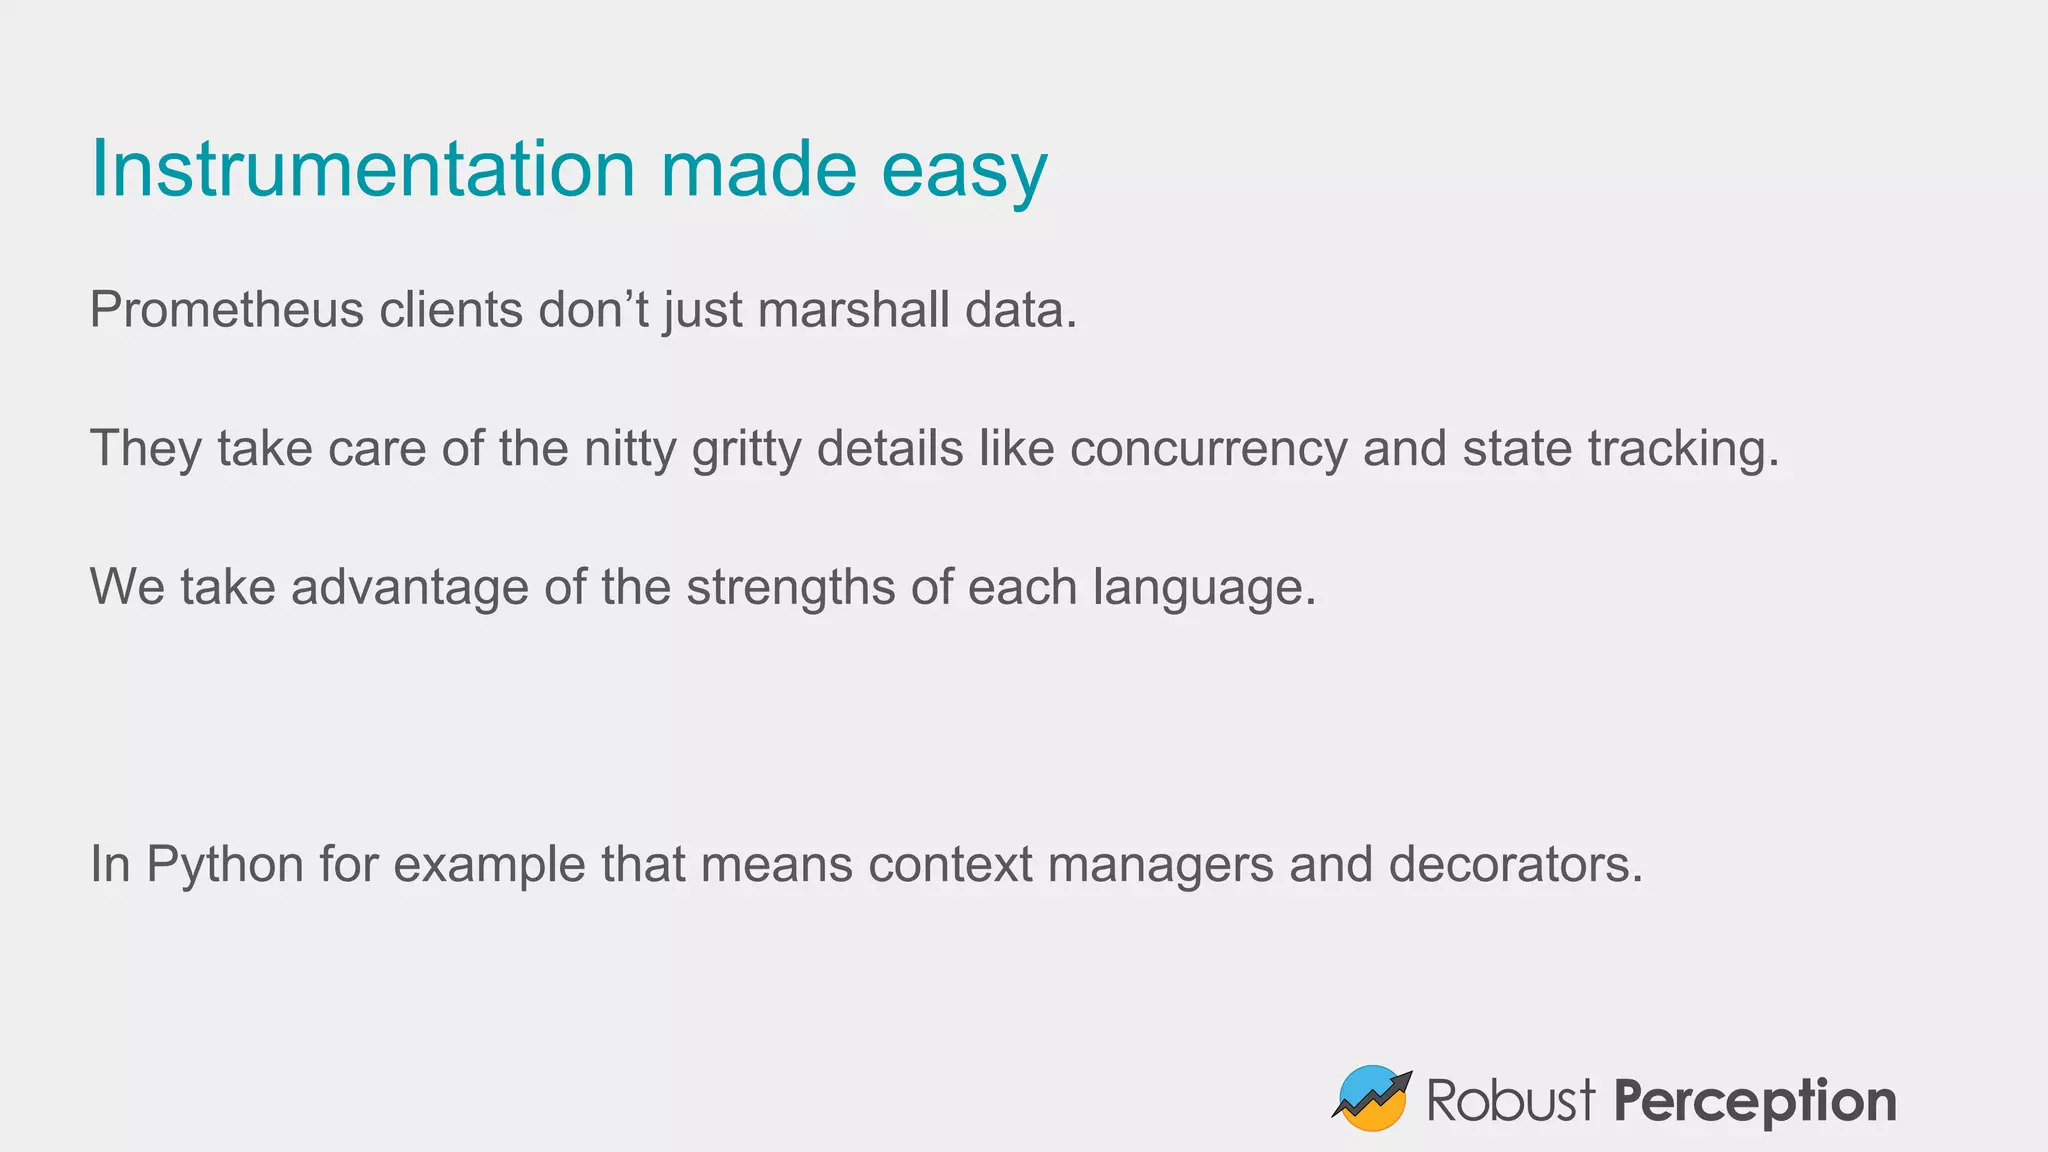
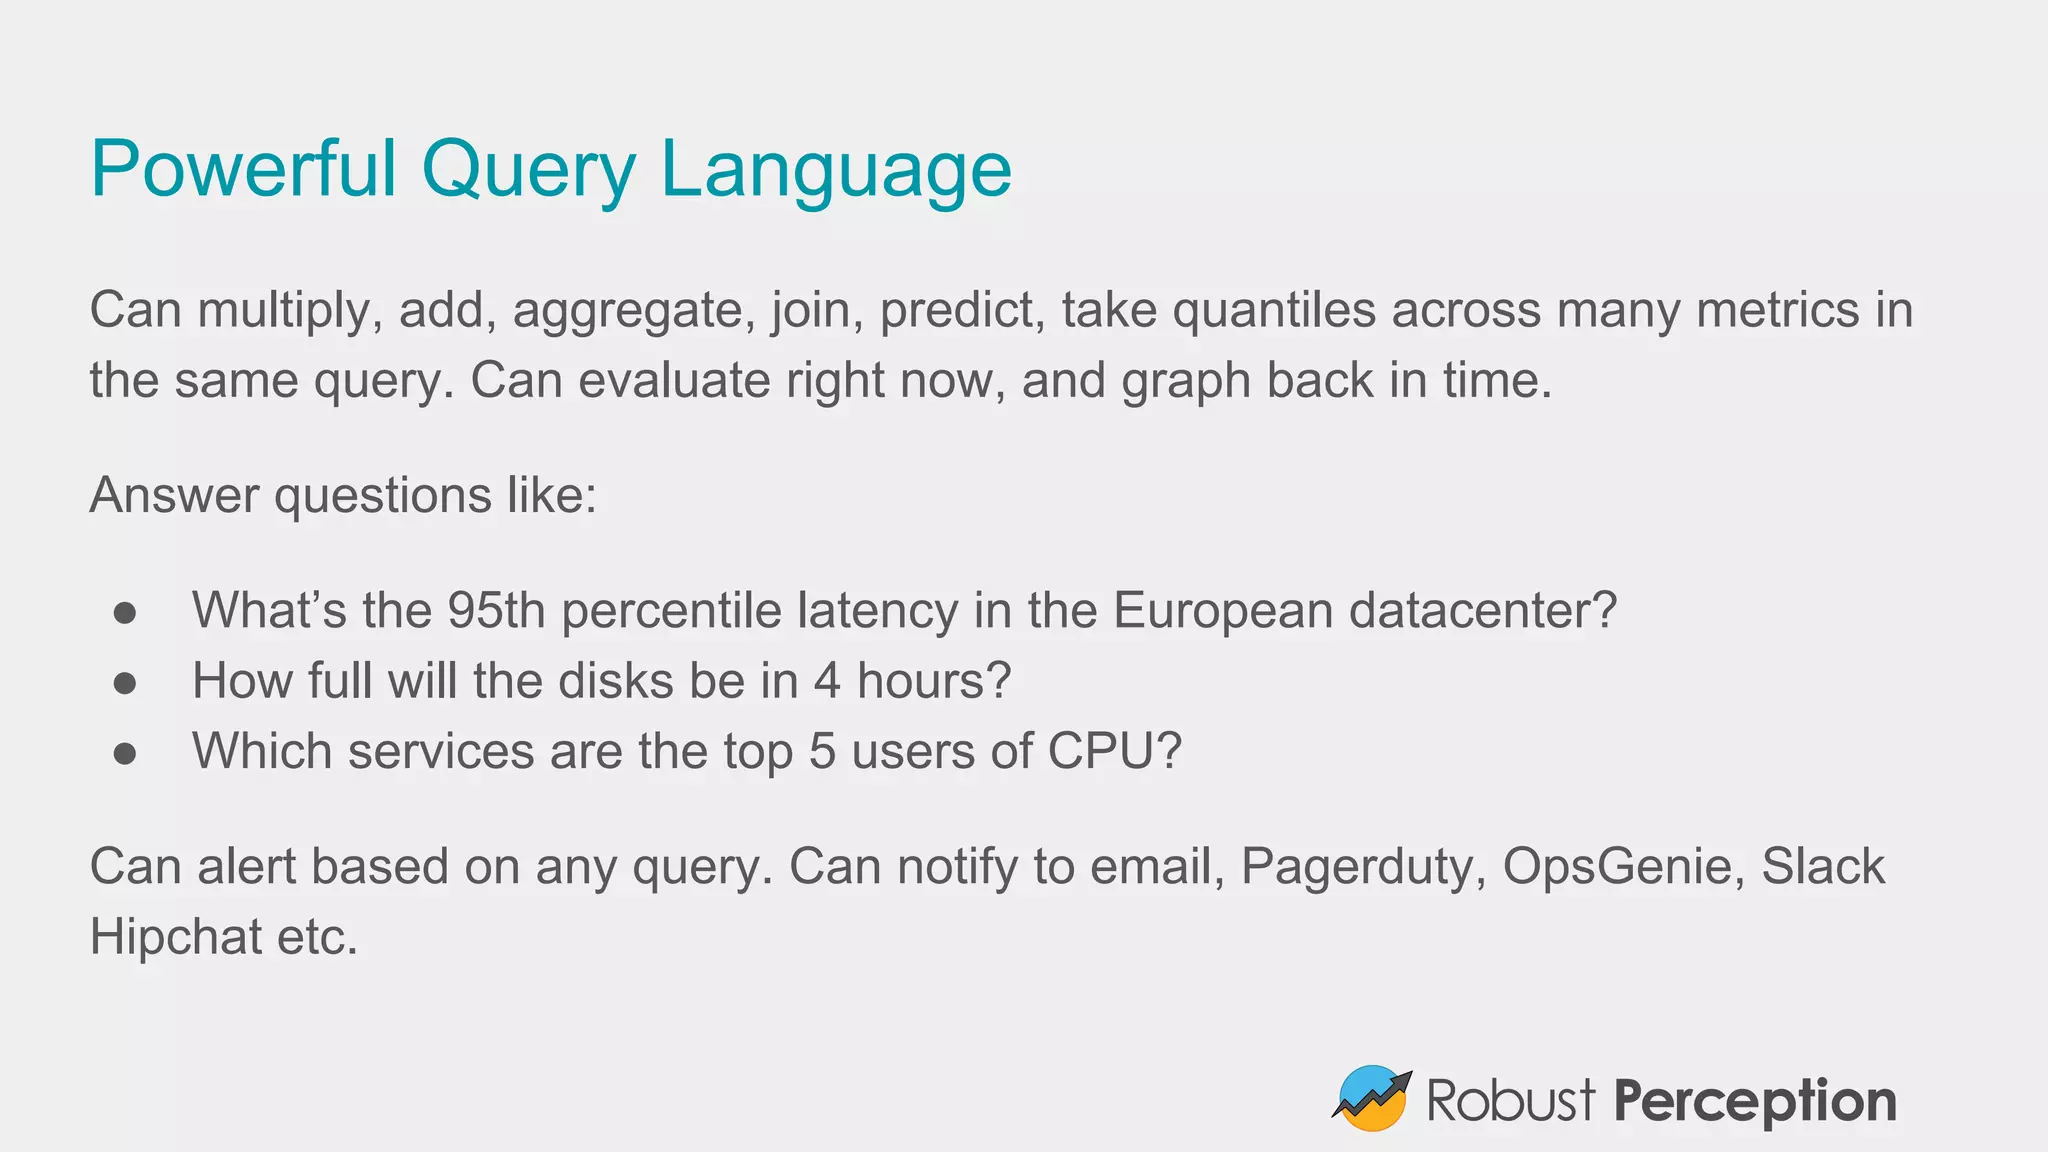
Brian Brazil, founder of Prometheus, a next-generation monitoring system, highlights his background as an engineer and core developer within the open-source ecosystem. Prometheus, inspired by Google's Borgmon, emphasizes ease of integration, powerful querying capabilities, and efficient manageability, enabling users to monitor systems effectively without being locked into a single solution. The Prometheus community is actively growing, supported by over 250 contributors and numerous third-party integrations.


![Number_Guessing_Game_Dsbsbssbzboc[1].pptx](https://cdn.slidesharecdn.com/ss_thumbnails/numberguessinggamedoc1-251206215042-a076fc05-thumbnail.jpg?width=640&height=640&fit=bounds)


