The document provides an overview of Prometheus, an open-source monitoring and alerting toolkit, including its architecture, comparison to Nagios, and features like PromQL for querying time series data. Prometheus gathers metrics, evaluates rules, and triggers alerts while enabling scalable data collection and operational simplicity, and is suitable for cloud-based environments. Additionally, it discusses the use of Grafana for visualizing Prometheus data and highlights the differences between Nagios and Prometheus in terms of monitoring approaches.


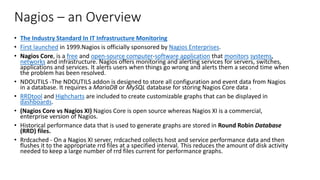

![Time Series Selectors
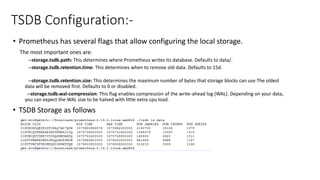
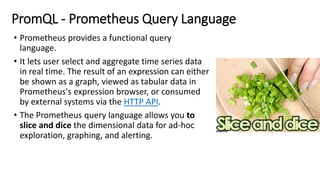
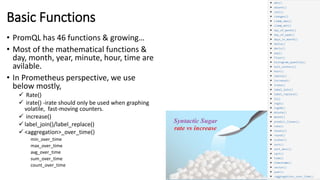
• Instant Vector - One Value per time series Guaranteed. In the simplest
form, only a metric name is specified
• Range Vector - Any Number of Value between two timestamps. a
range duration is appended in square brackets ([]) at the end of a
vector selector](https://image.slidesharecdn.com/prometheus-v4-200221112407/85/Prometheus-Intro-CNCF-TSDB-PromQL-Grafana-21-320.jpg)
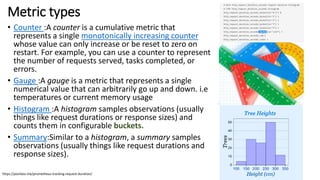
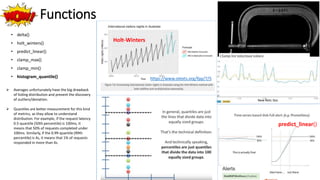
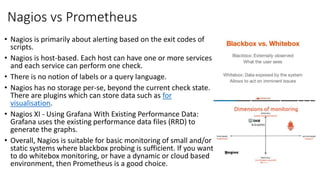
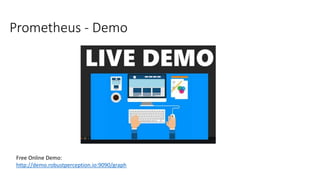
![Demo Queries
• max by(instance)(node_filesystem_size_bytes)
• max without(device, fstype, mountpoint)(node_filesystem_size_bytes)
• sum without(device, fstype, mountpoint)(node_filesystem_size_bytes)
• sum(node_filesystem_size_bytes)
• round(sum(node_filesystem_size_bytes)/1024/1024/1024)
• round(sum by(instance, device)(node_filesystem_size_bytes)/1024/1024/1024)
• rate(node_load1[5m])
• rate(node_cpu_seconds_total{mode="system"}[5m])
• min_over_time(node_load1[5m])
• max_over_time(node_load1[5m])
• avg_over_time(node_load1[5m])
• sum_over_time(node_load1[5m])
• count_over_time(node_load1[5m])
• delta(node_hwmon_temp_celsius[1h])
• clamp_max(node_load1,1.2)
• clamp_min(clamp_max(node_load1,1.2),1.05)
• predict_linear(node_load1[1h],4*3600)
• quantile without(cpu)(0.9, rate(node_cpu_seconds_total{mode="system"}[5m]))
• topk(3, sum by (mode) (node_cpu_seconds_total))
• bottomk(3, sum by (le) (alertmanager_http_request_duration_seconds_bucket))](https://image.slidesharecdn.com/prometheus-v4-200221112407/85/Prometheus-Intro-CNCF-TSDB-PromQL-Grafana-26-320.jpg)


![Getting Started with Apache Spark: Big Data Made Simple [Free Meetup]](https://cdn.slidesharecdn.com/ss_thumbnails/apachesparkgettingstarted-260203175547-8361bcc3-thumbnail.jpg?width=640&height=640&fit=bounds)


