Downloaded 124 times
![Monitoring
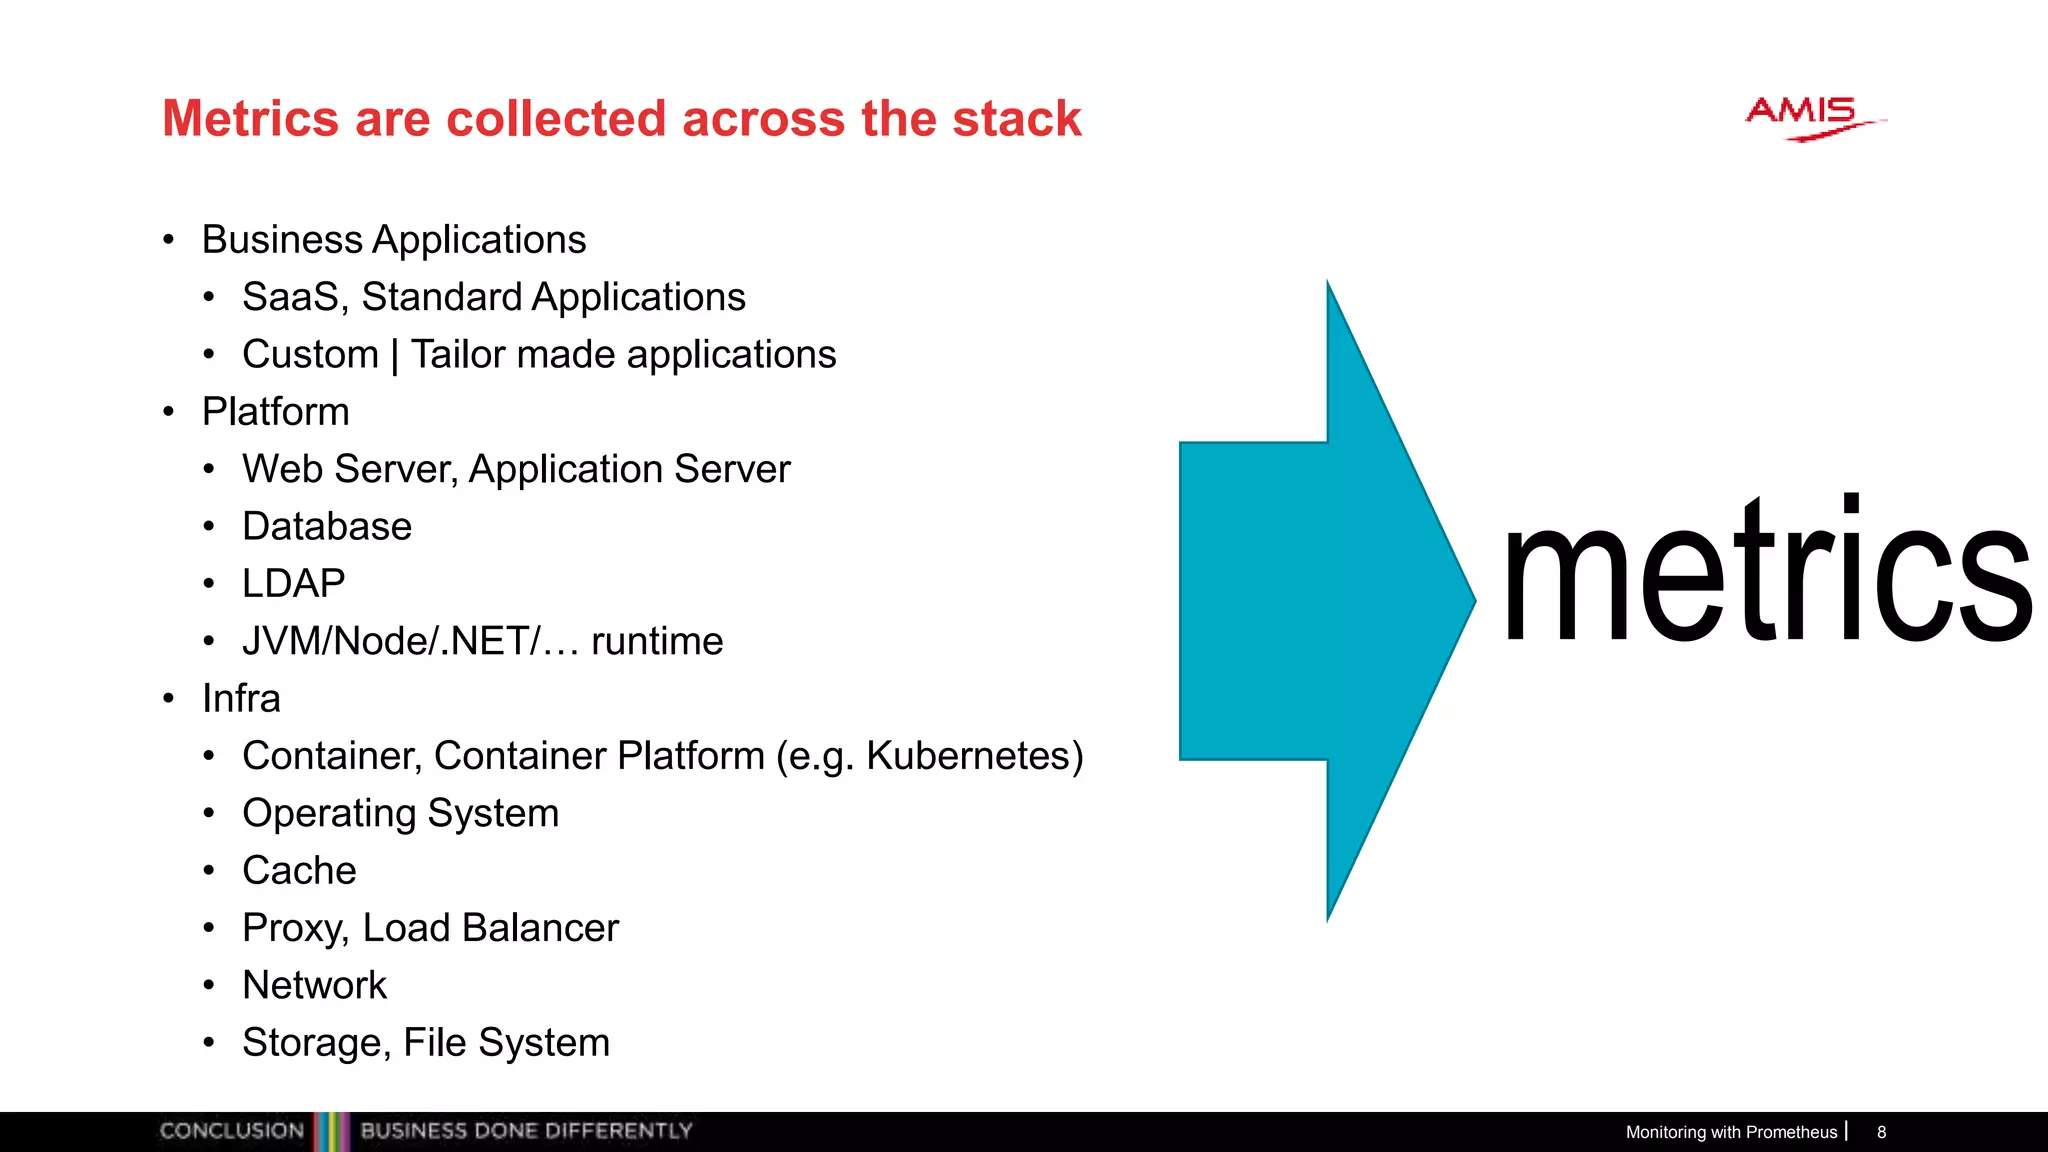
• Observe [non-functional] behavior of business functions/applications in
[near] real-time
• Availability and health
• Performance
• Access – when and as it should be for whom it should be
• Teams up with:
• Profiling & Debugging – maximum context for activity spikes
• Tracing – track paths through application [and platform & infra] stack
• Logging – per application or platform component output for off-line
processing
• Note: log agents such as Elastic Stack Beats and Elasticsearch
Monitoring with Prometheus 4](https://image.slidesharecdn.com/monitoring-with-prometheus-workshop2018lucasjellema-180923154213/75/MeetUp-Monitoring-with-Prometheus-and-Grafana-September-2018-4-2048.jpg)
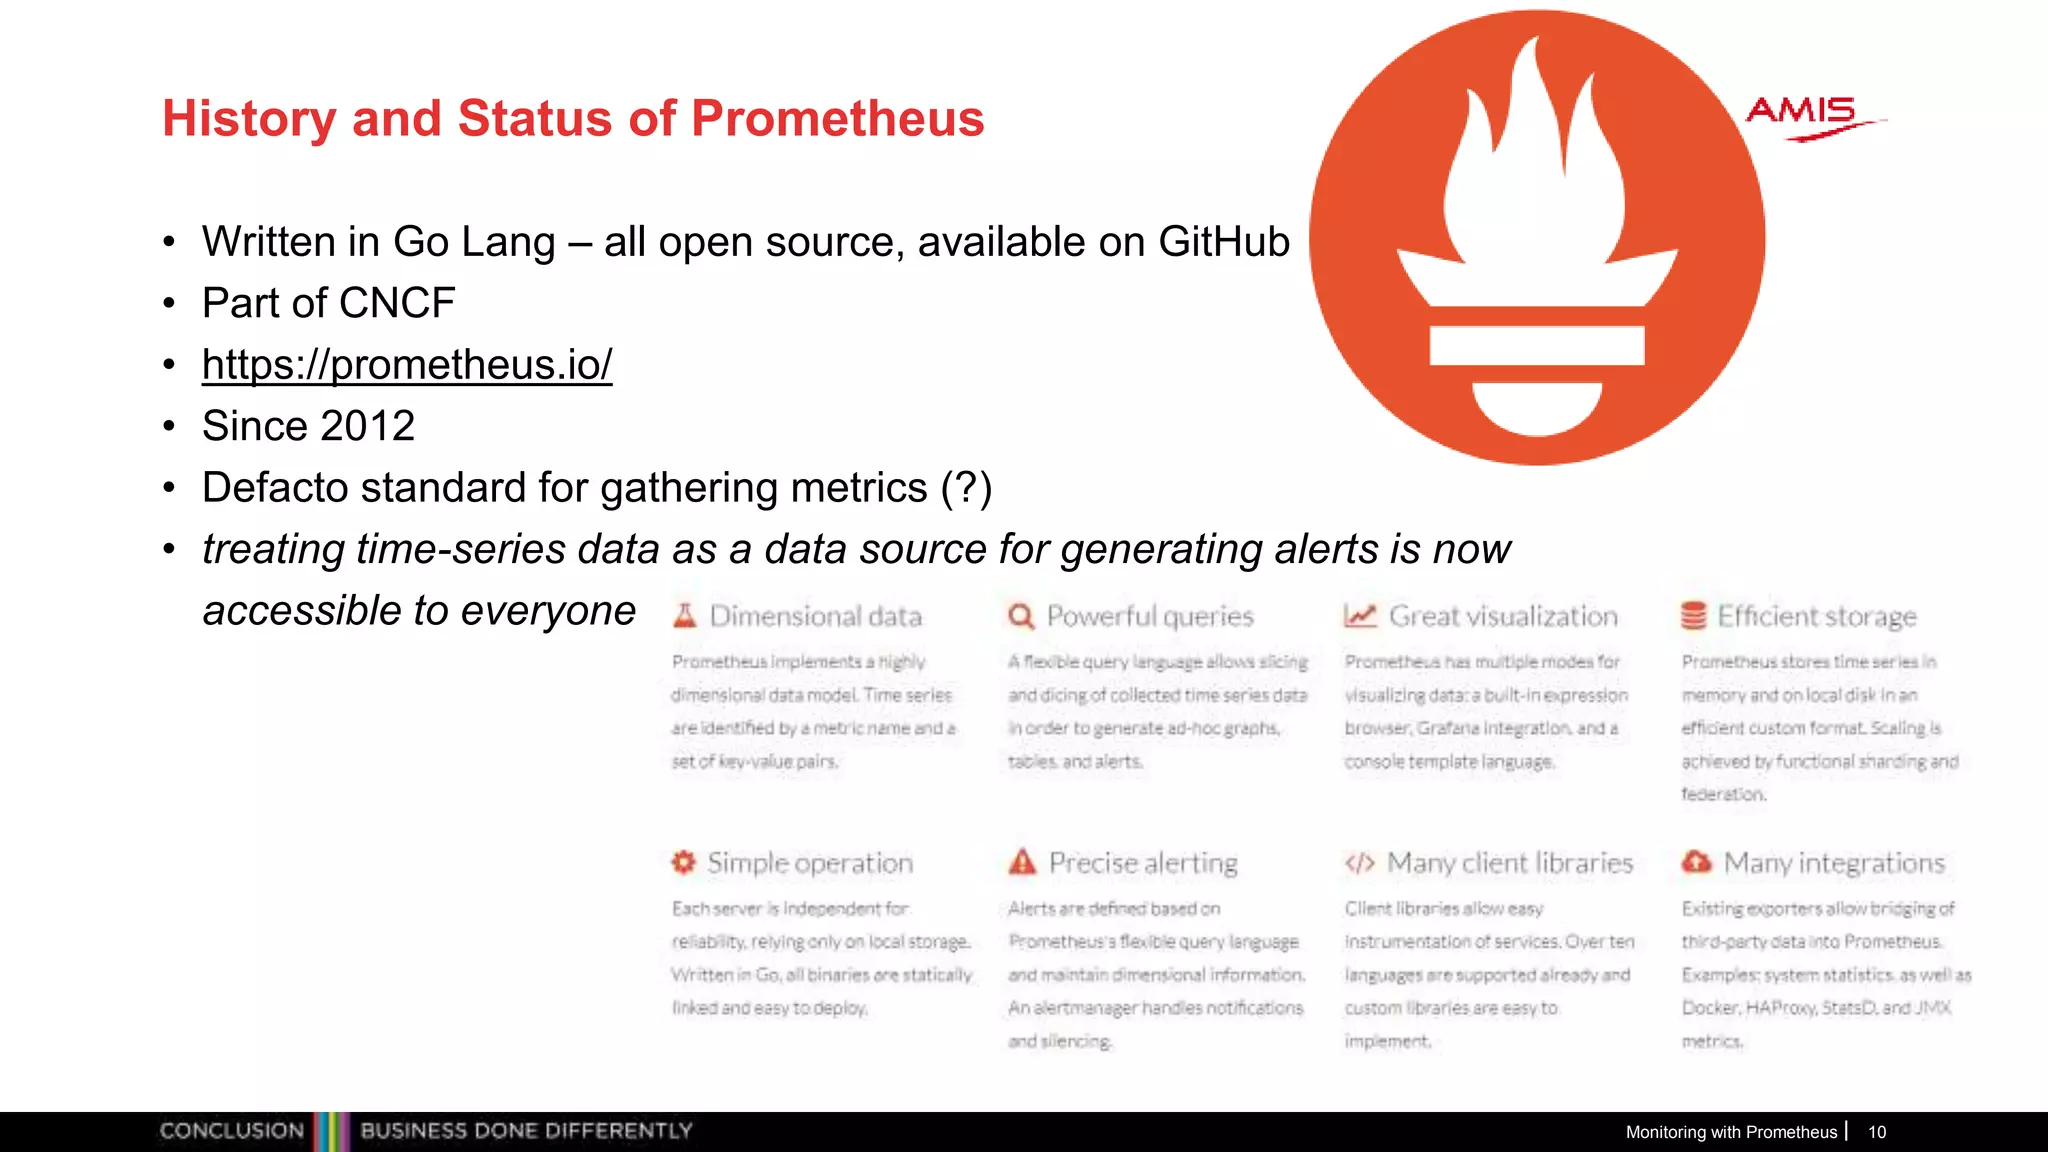
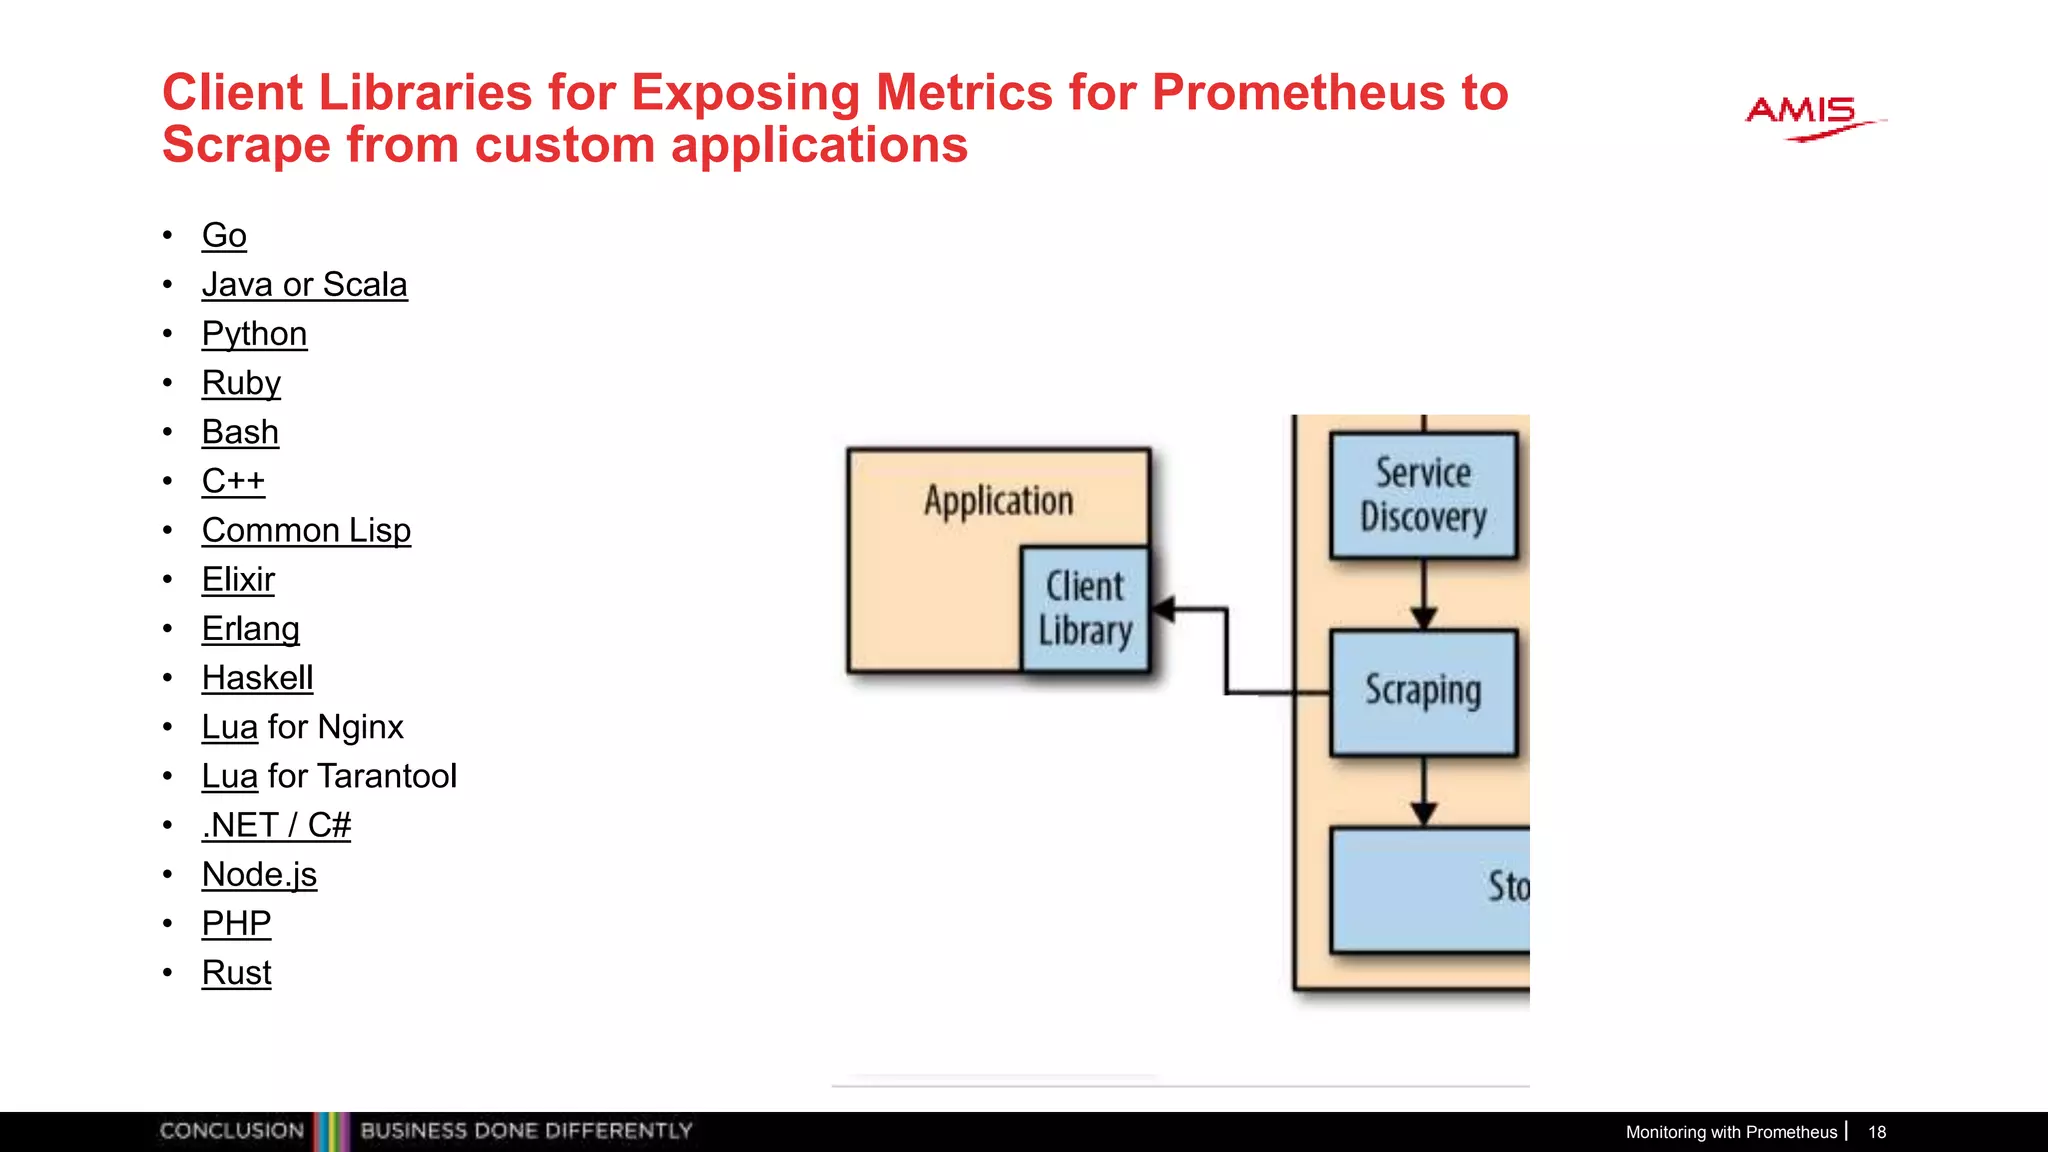
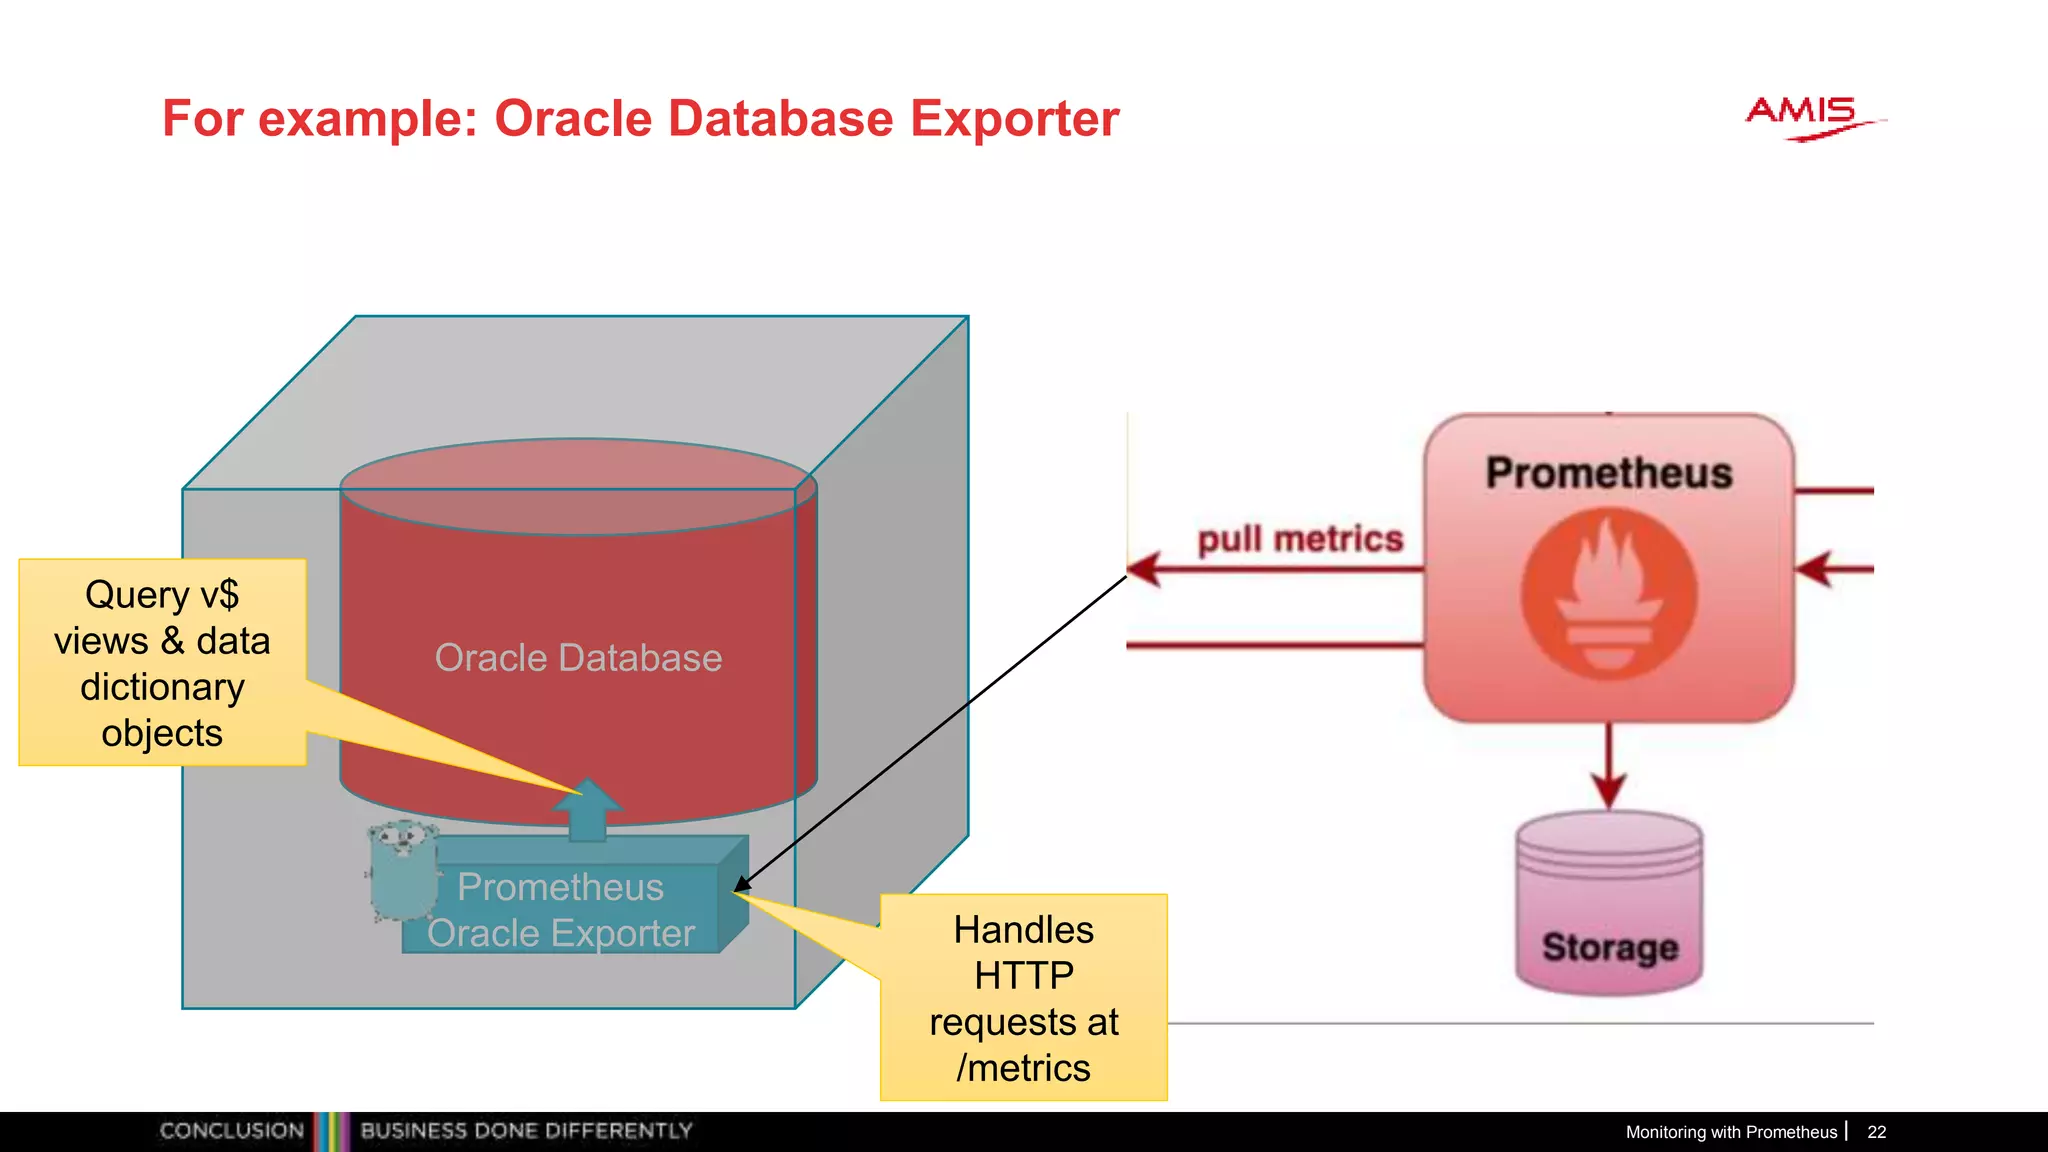
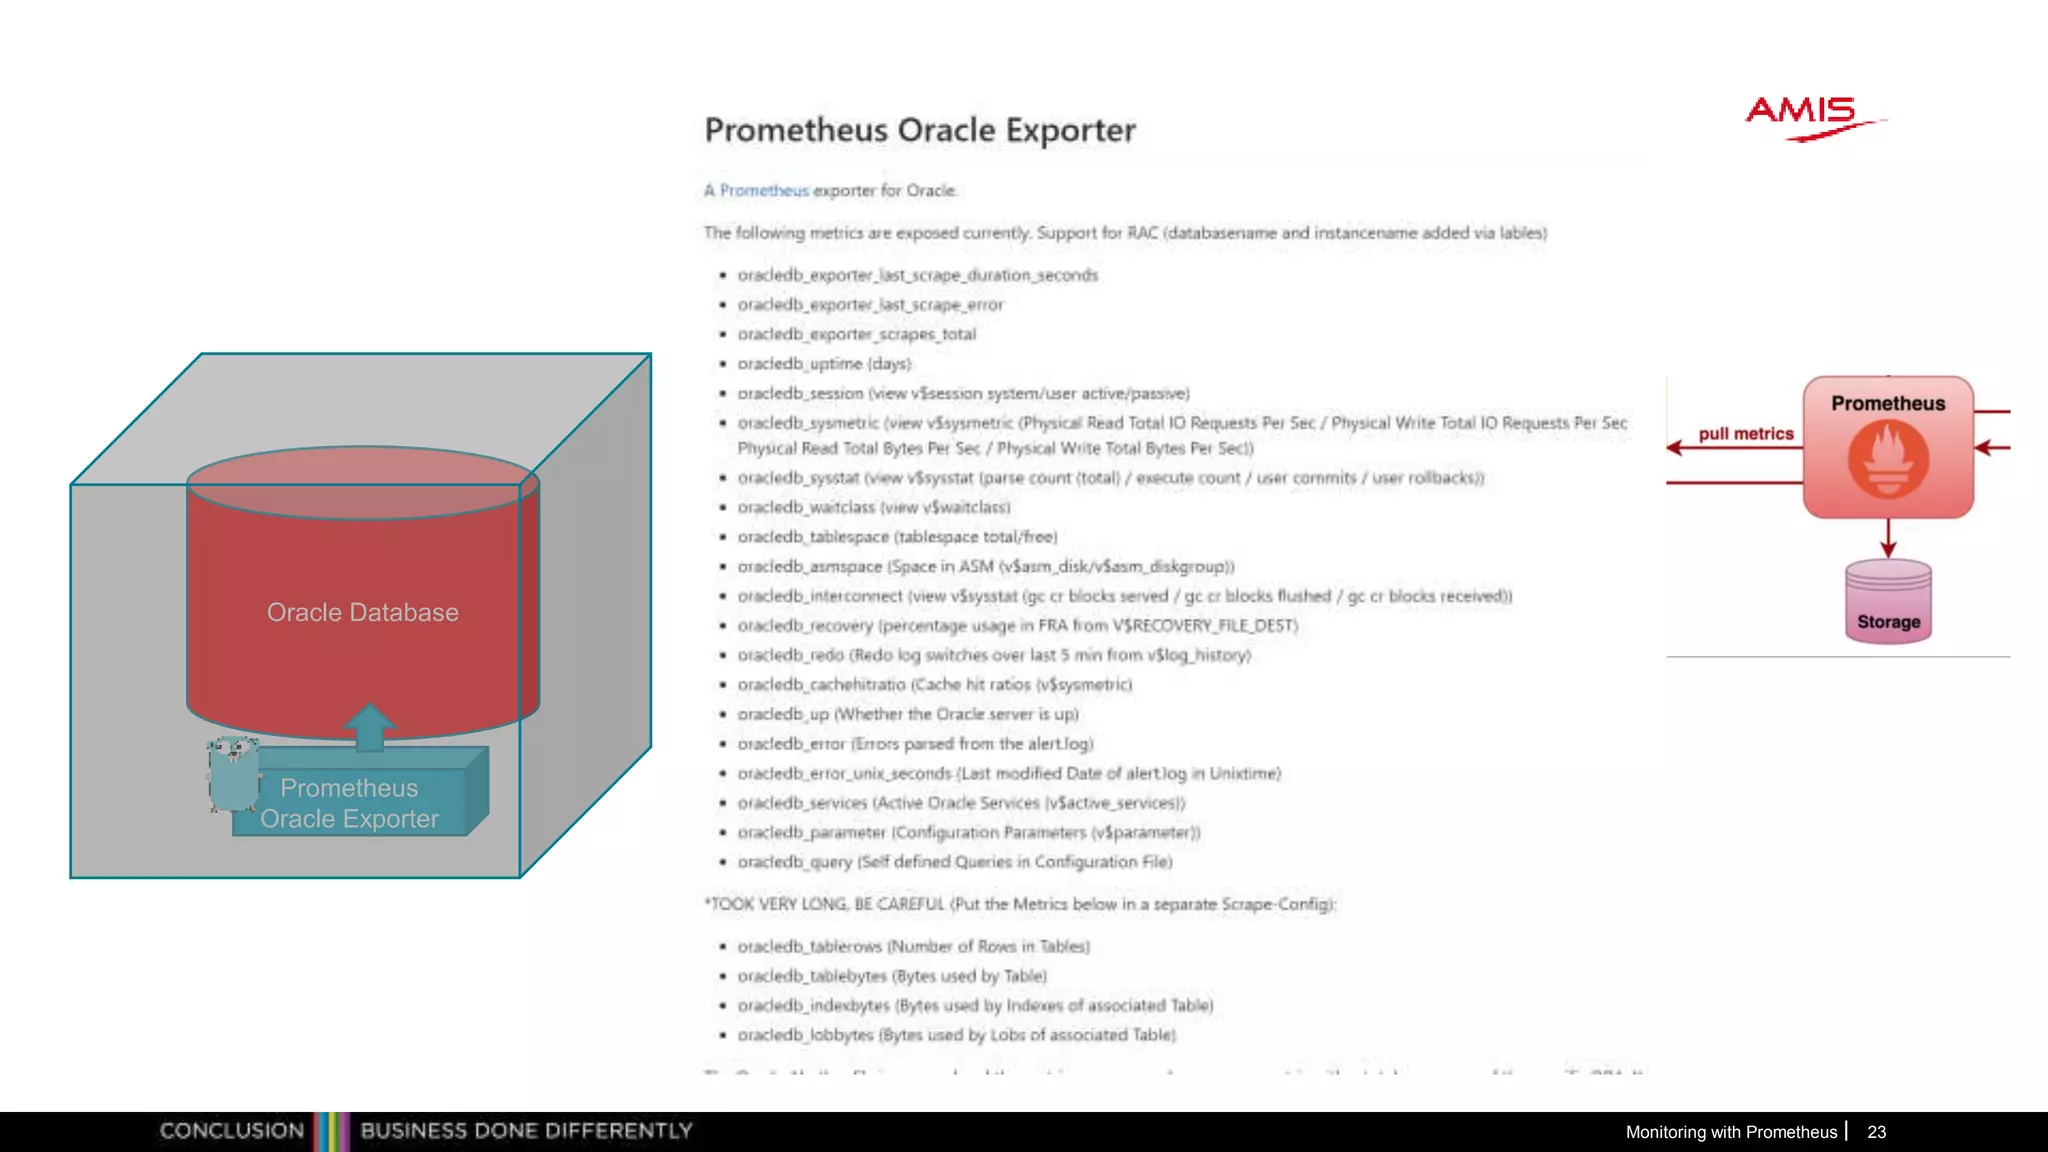
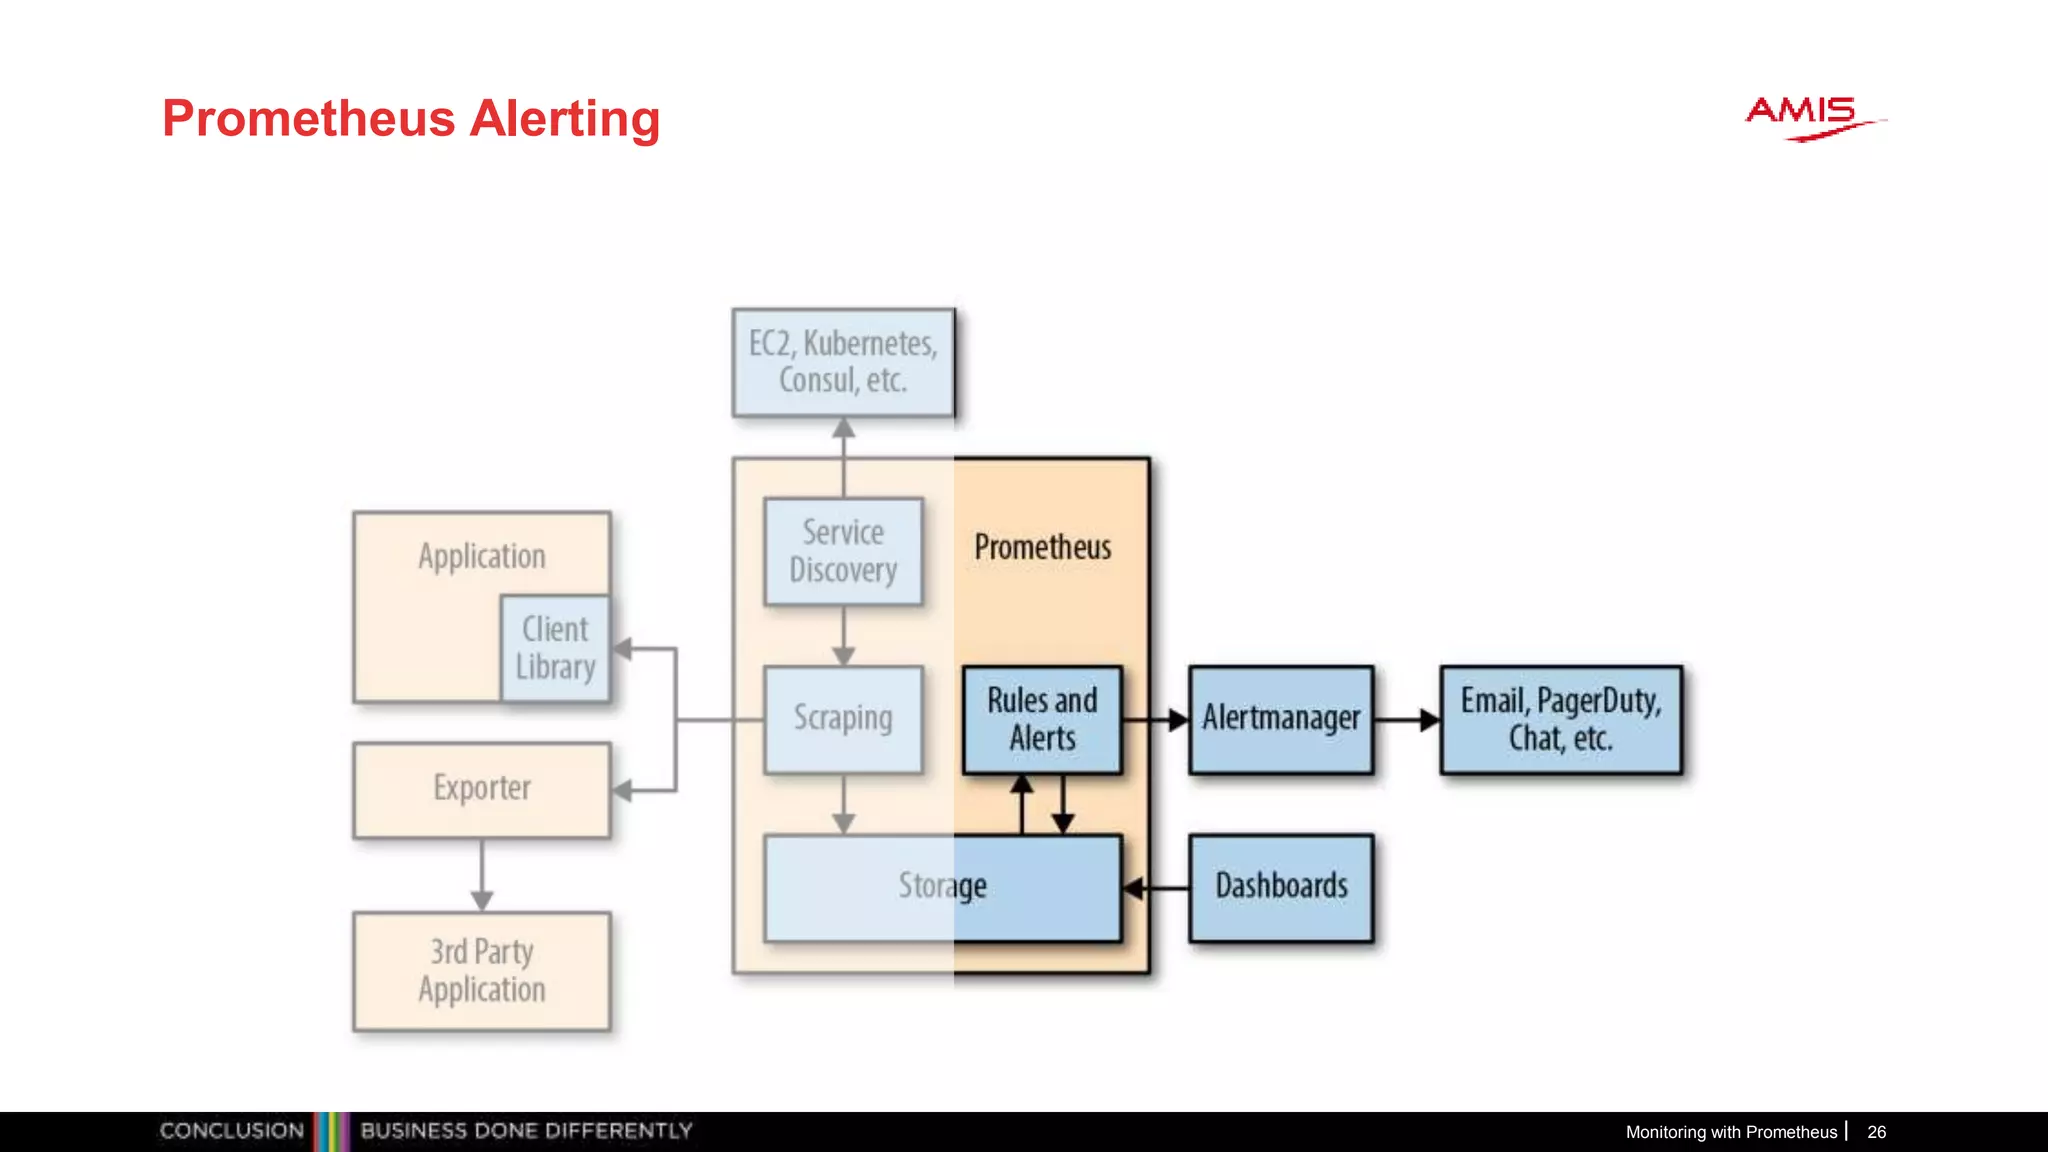
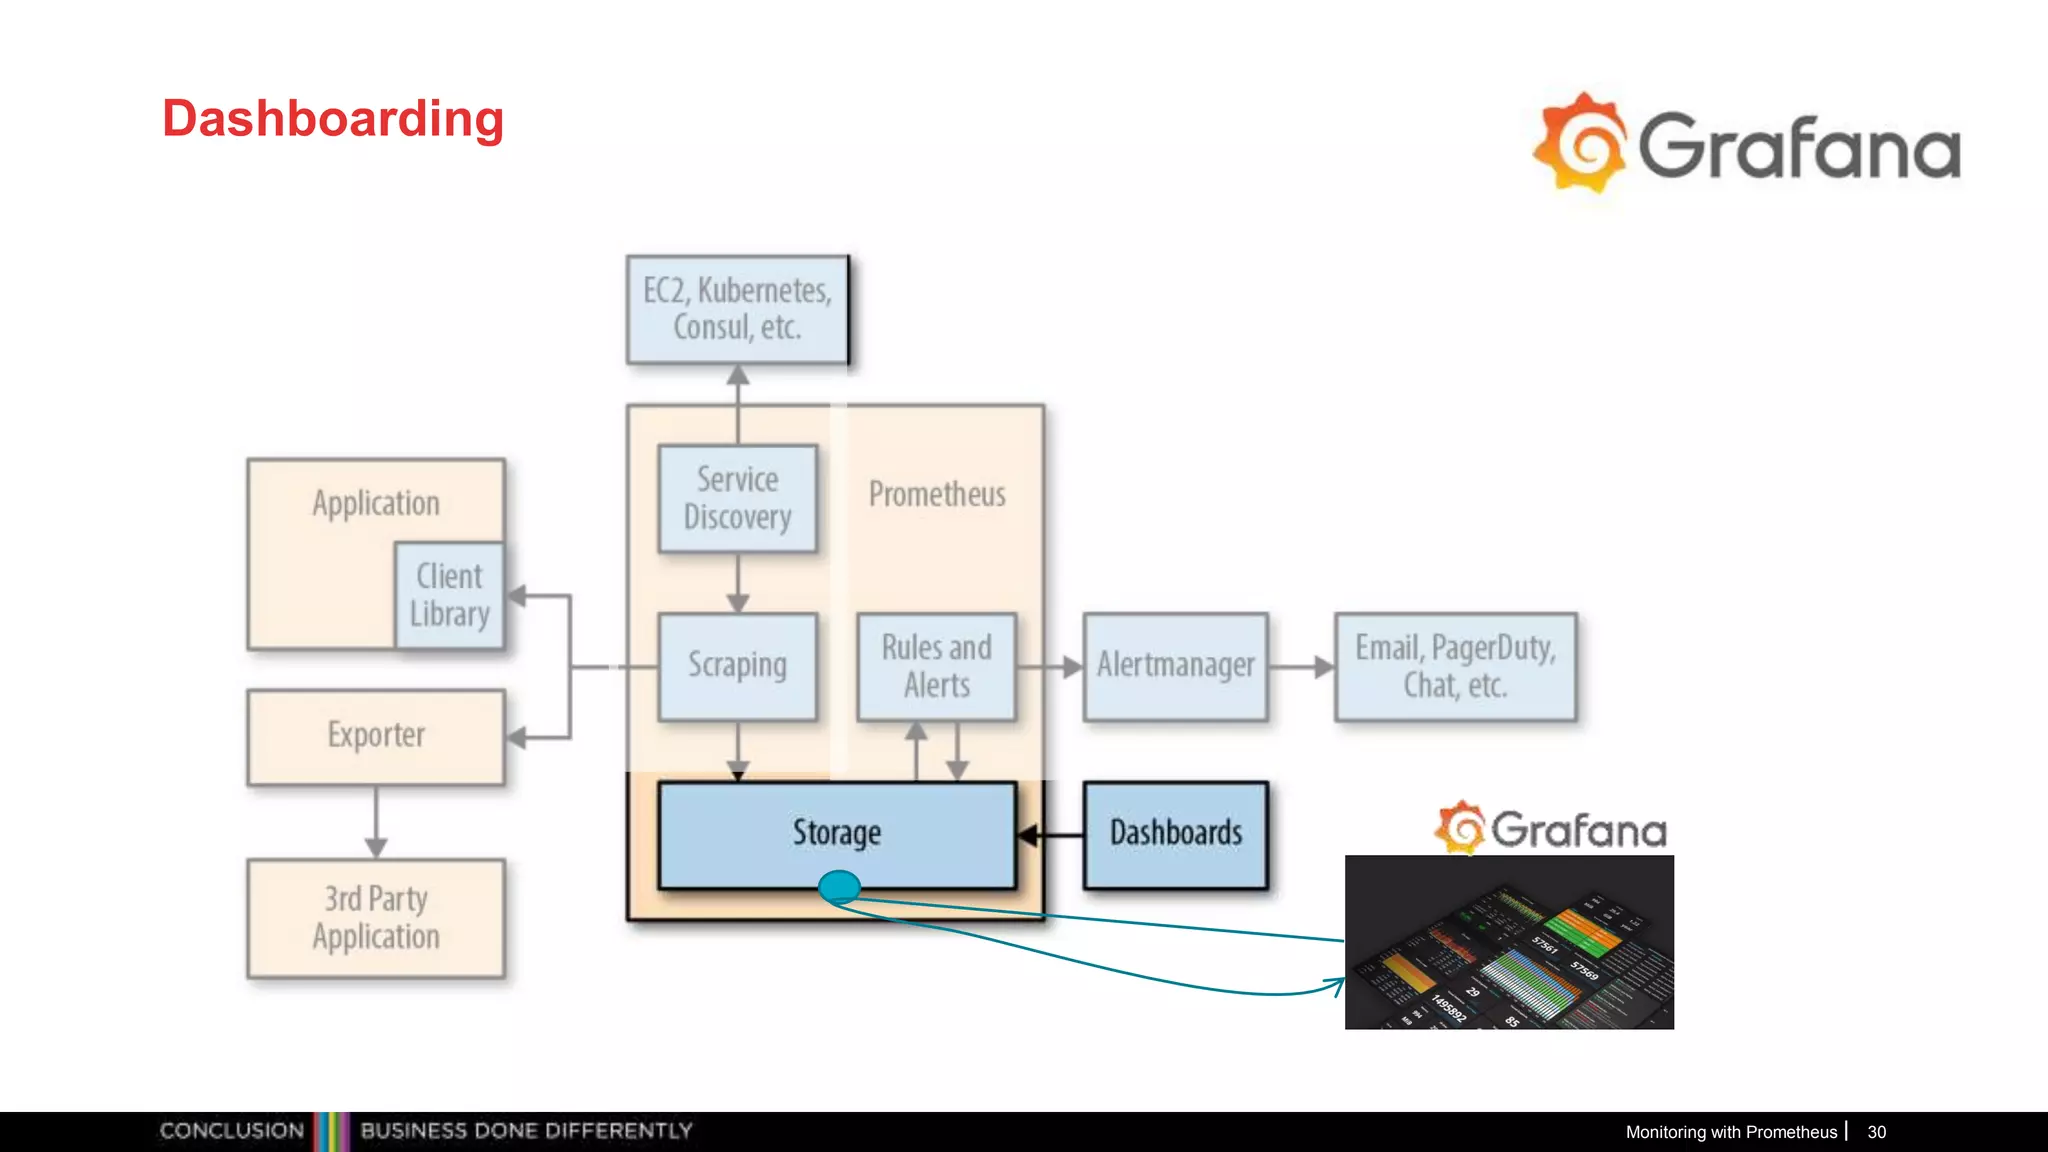
![Prometheus
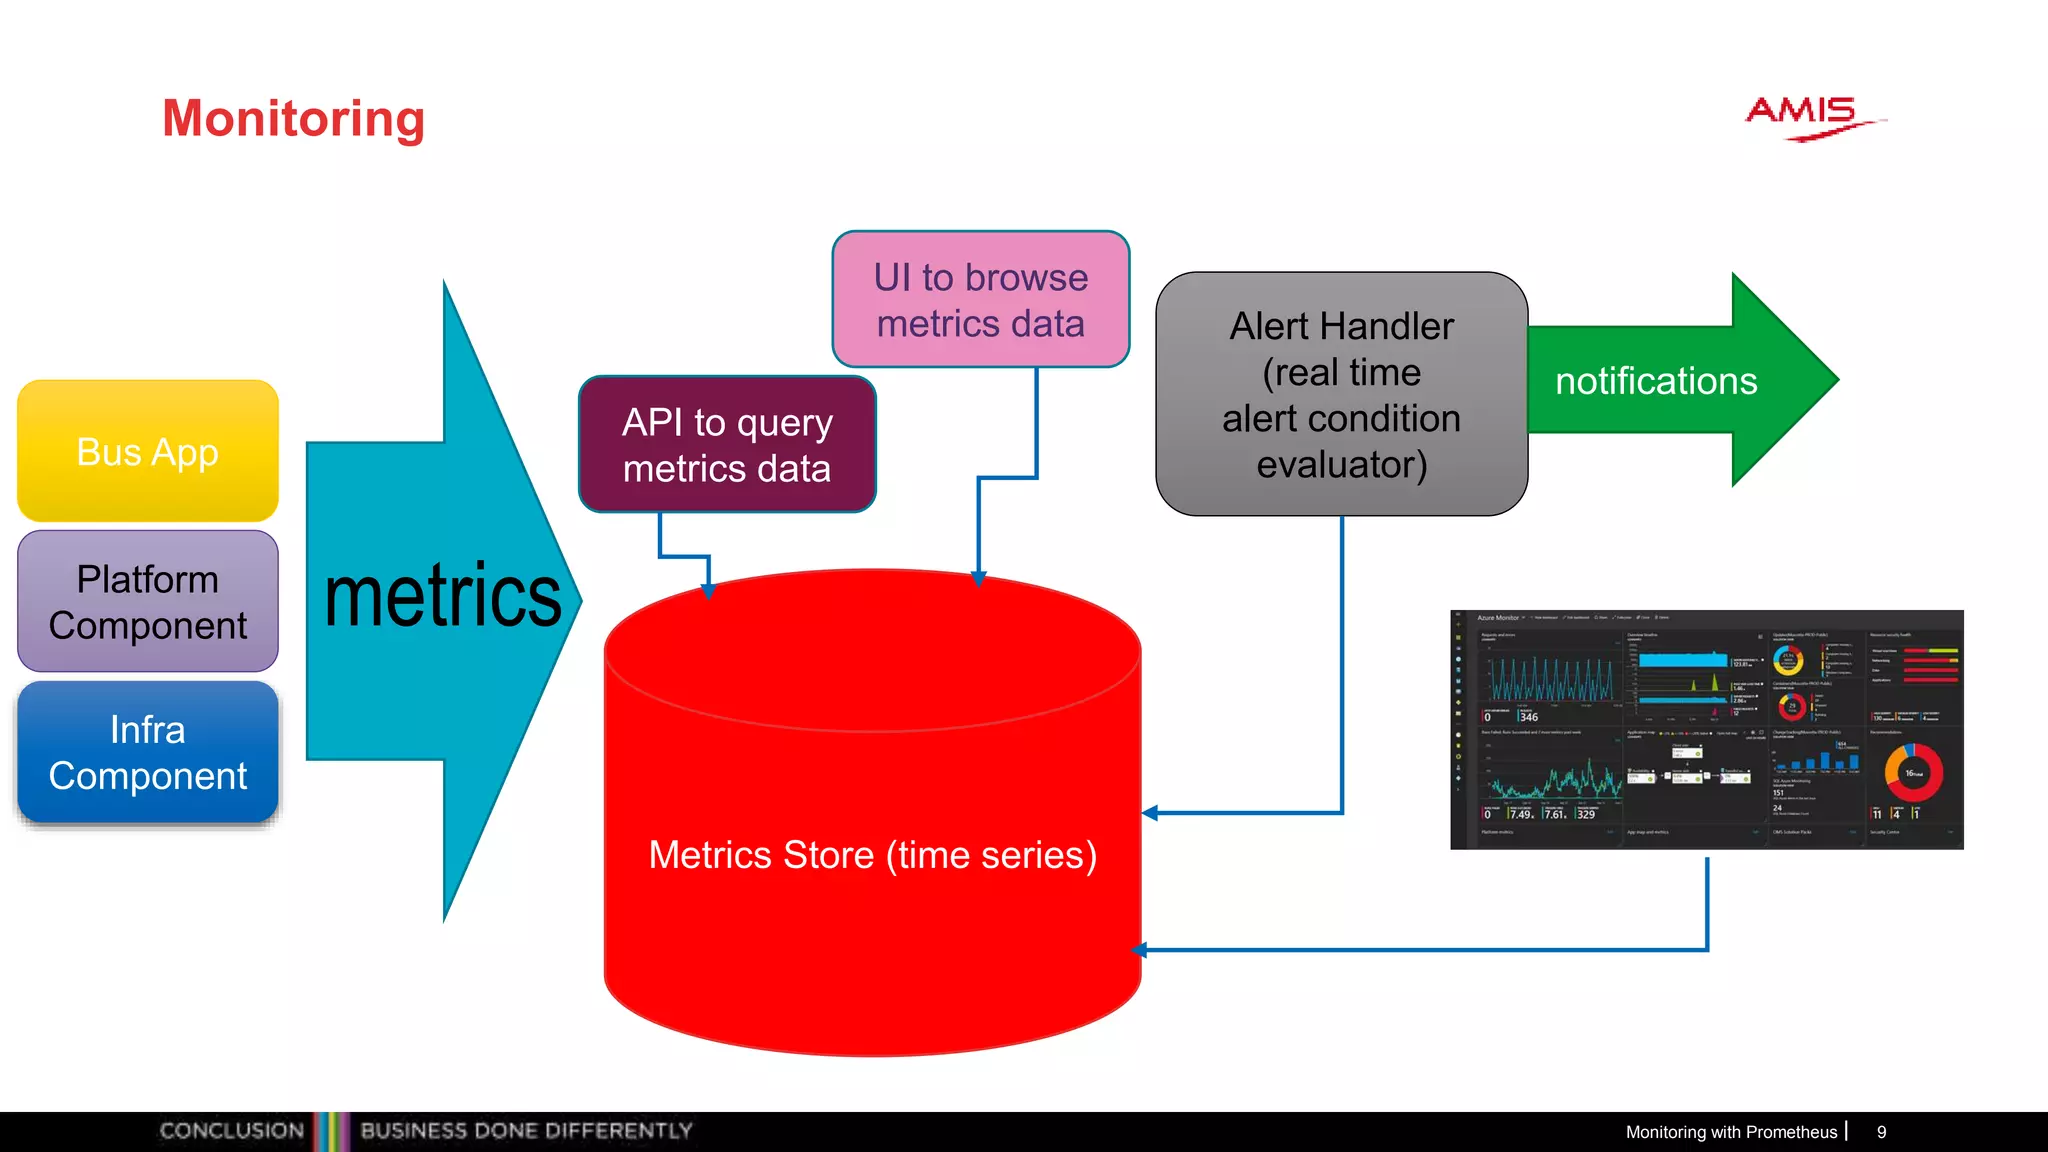
• Gather metrics into database
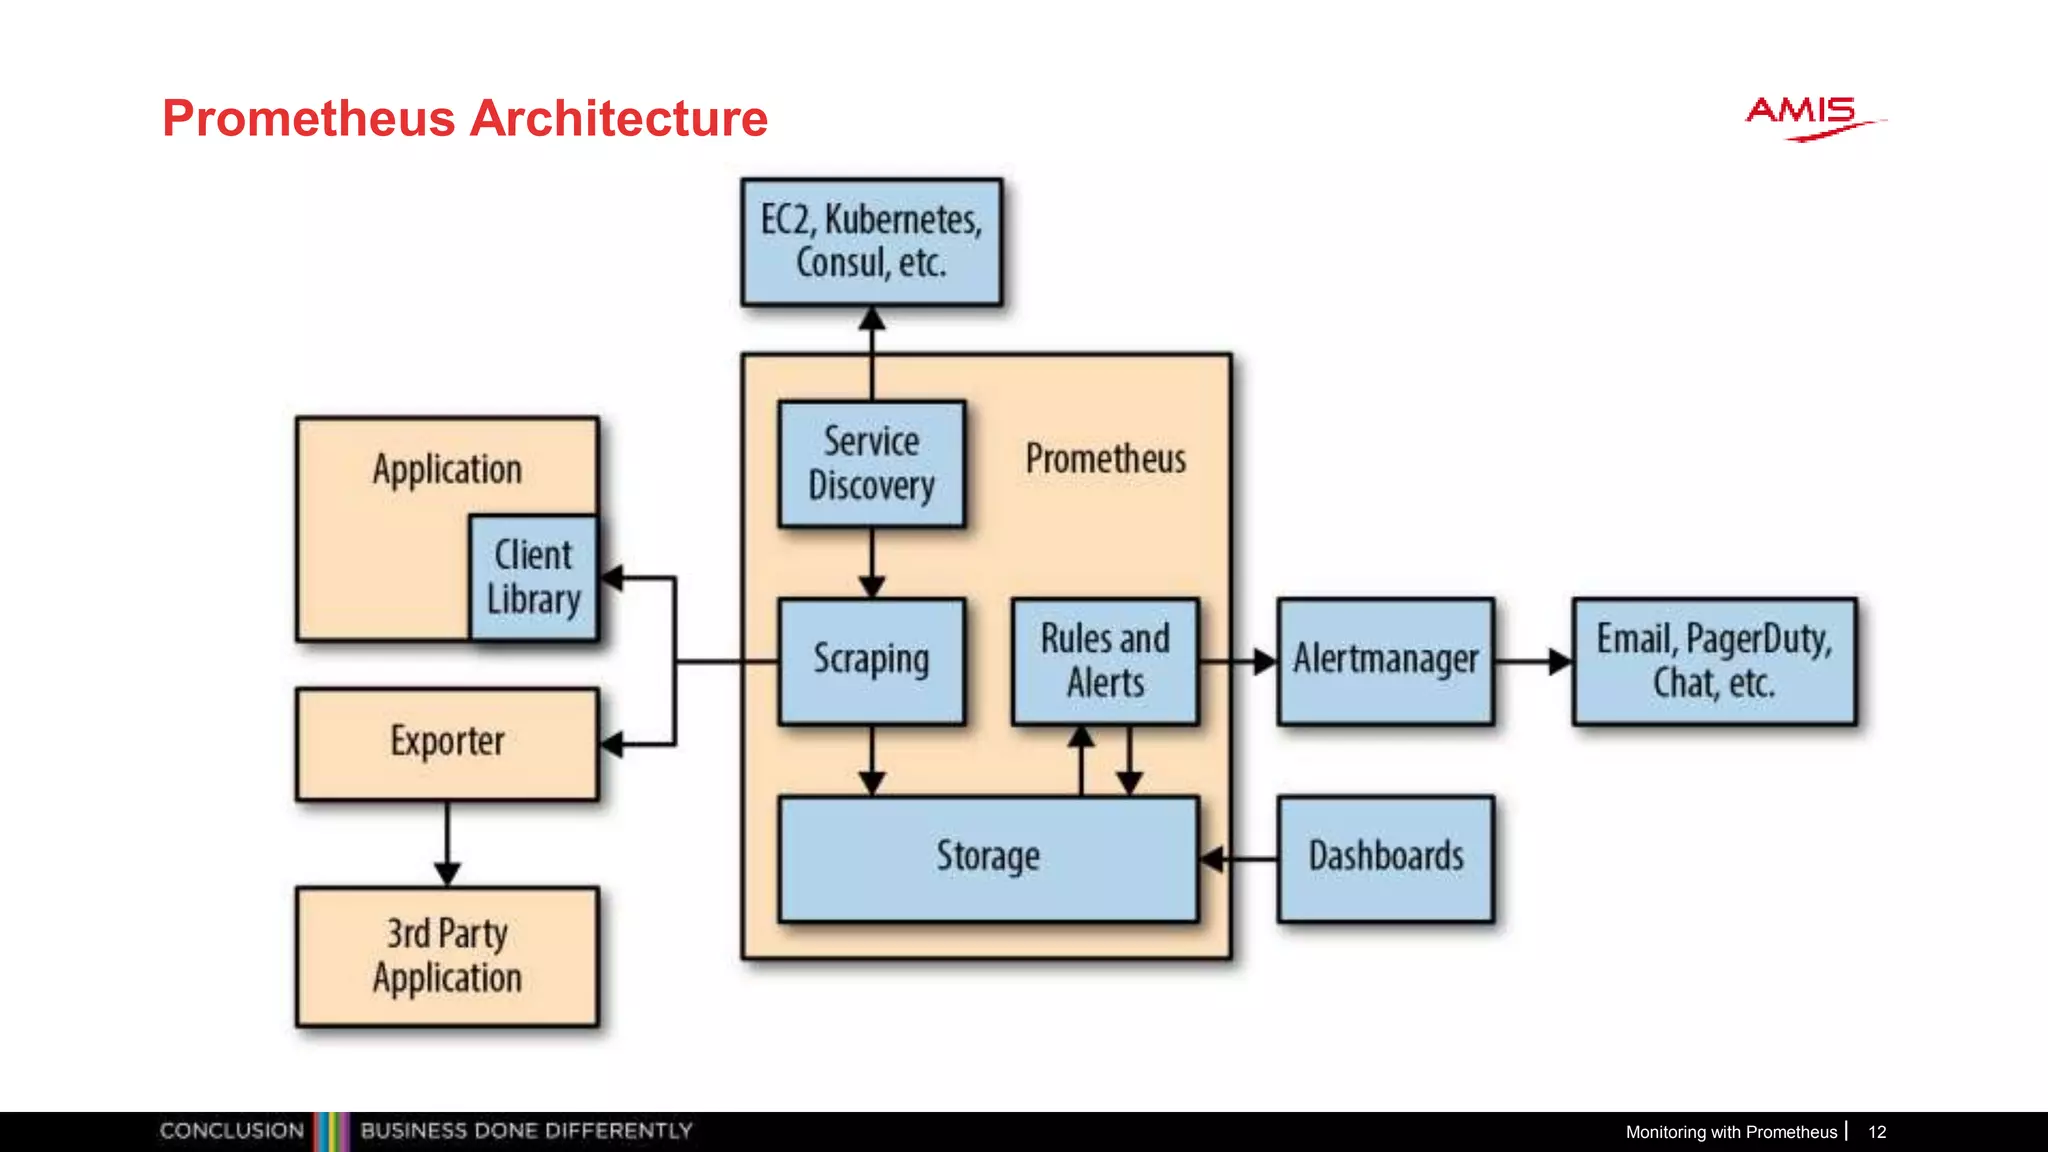
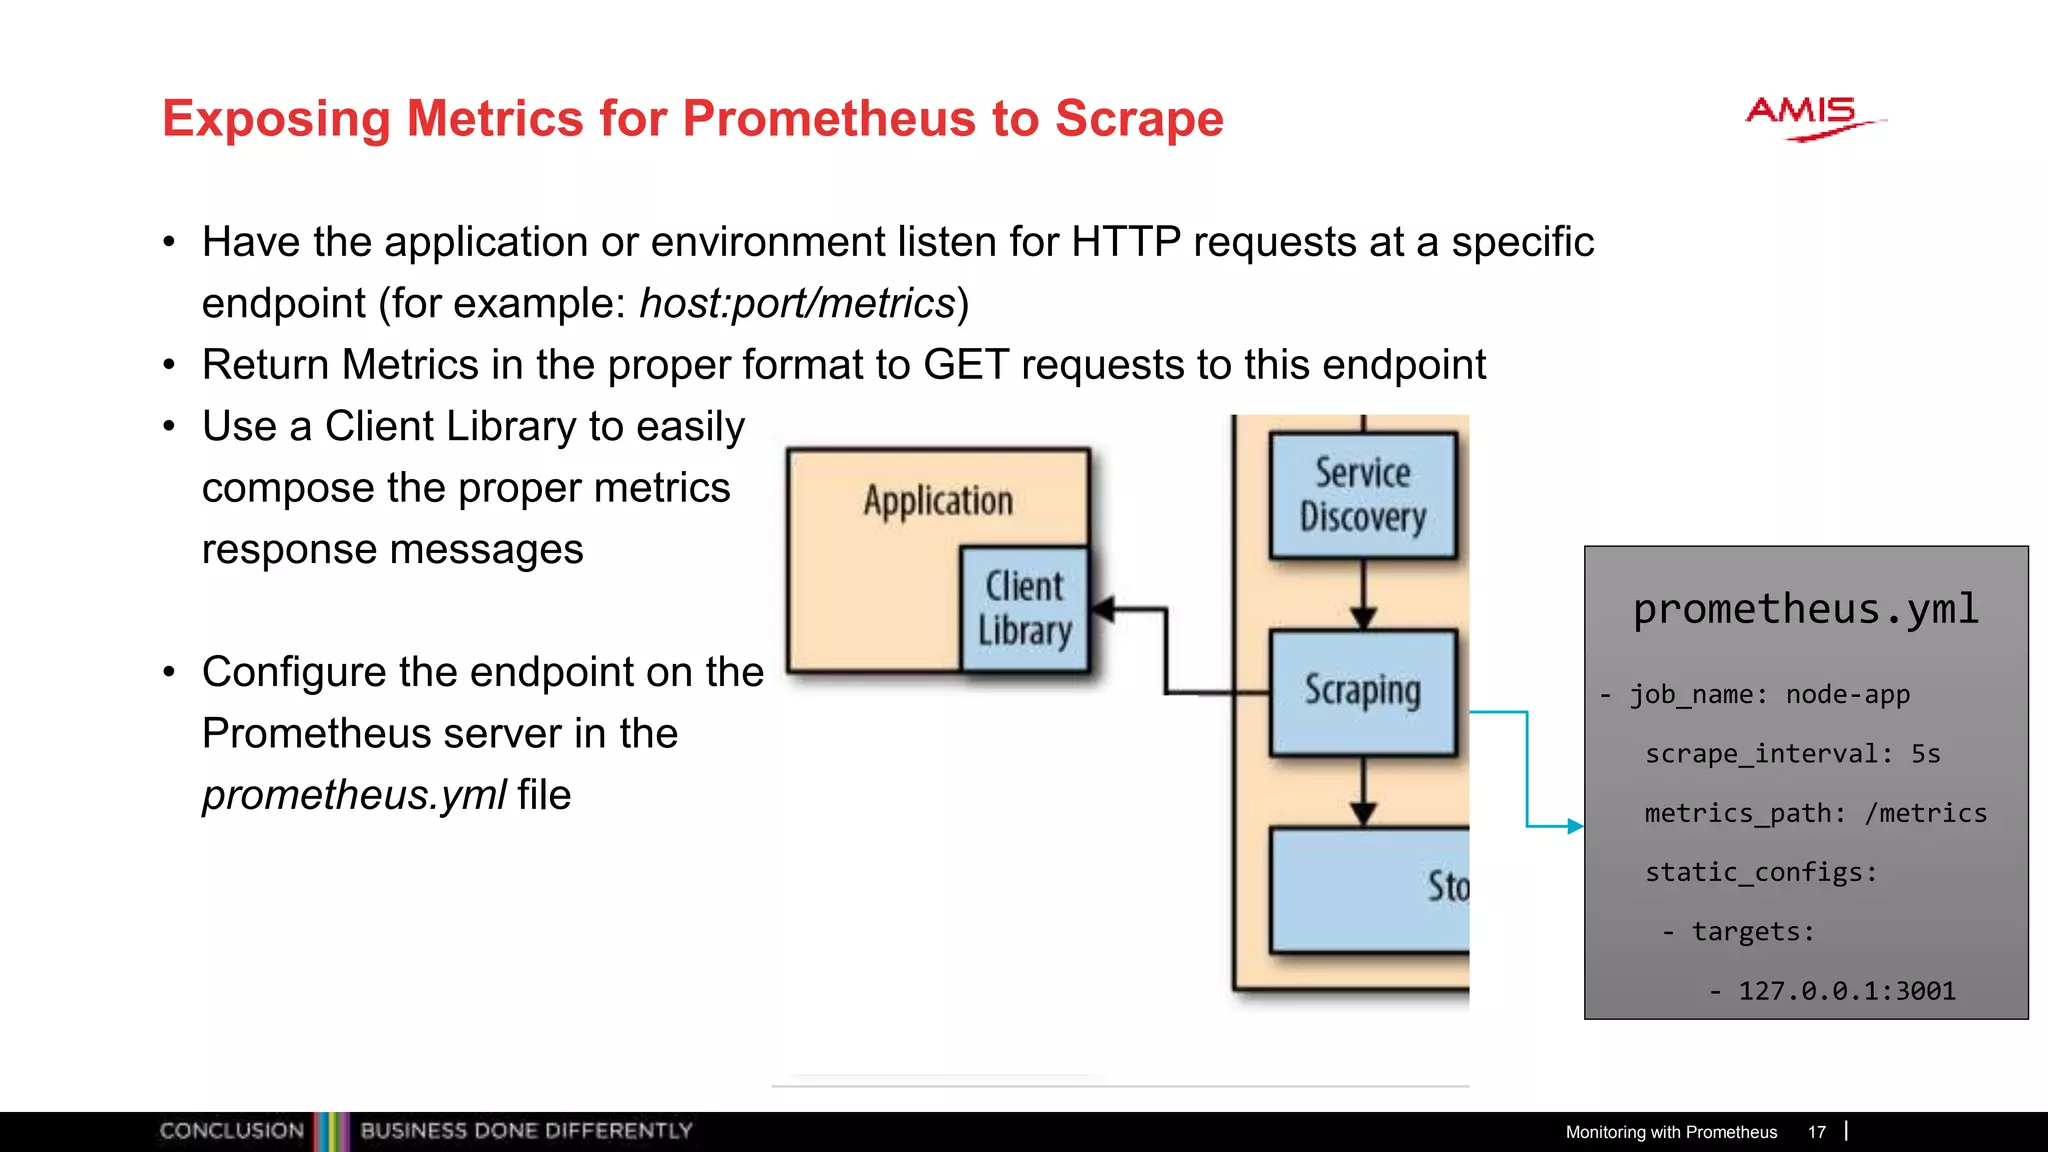
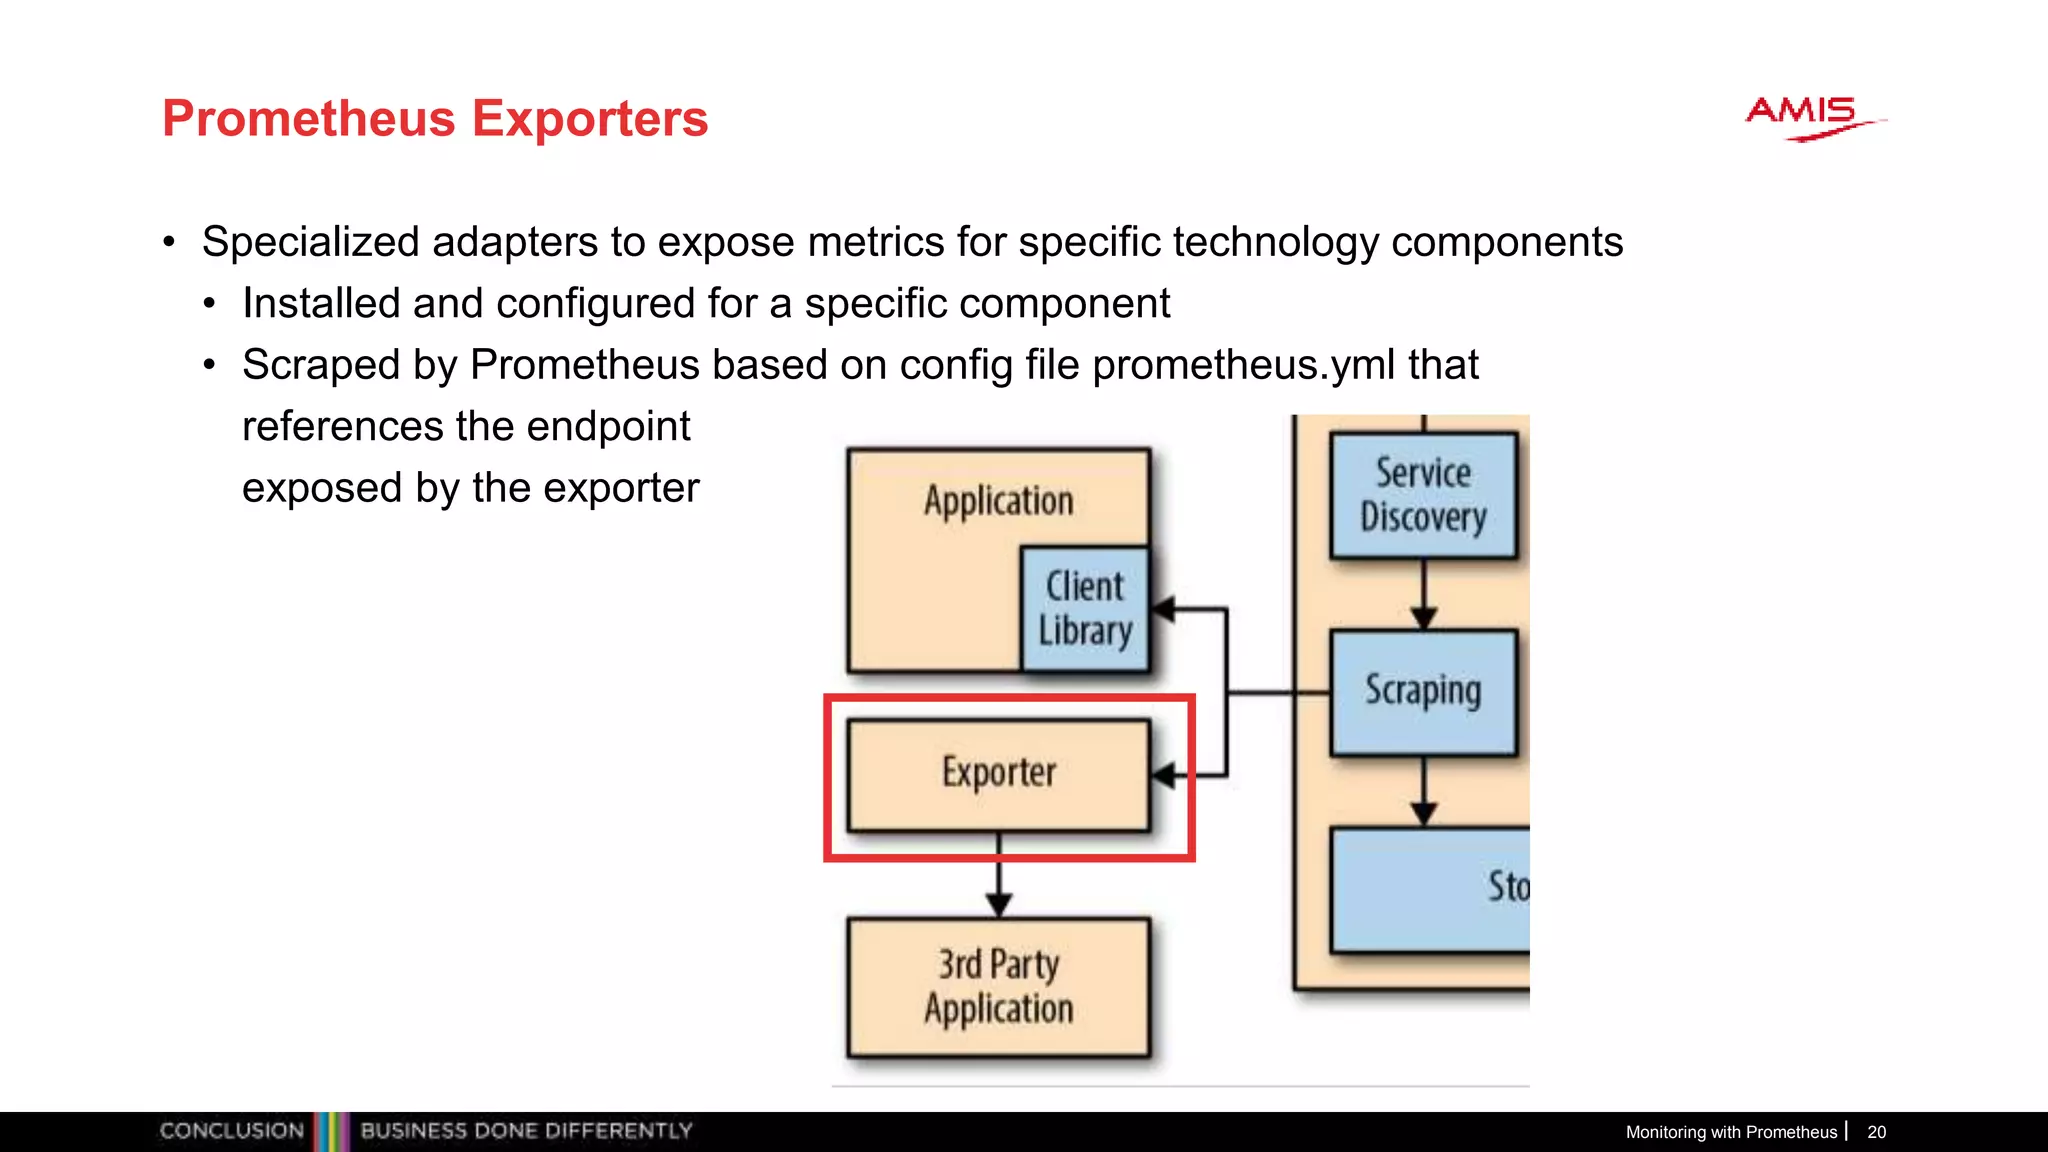
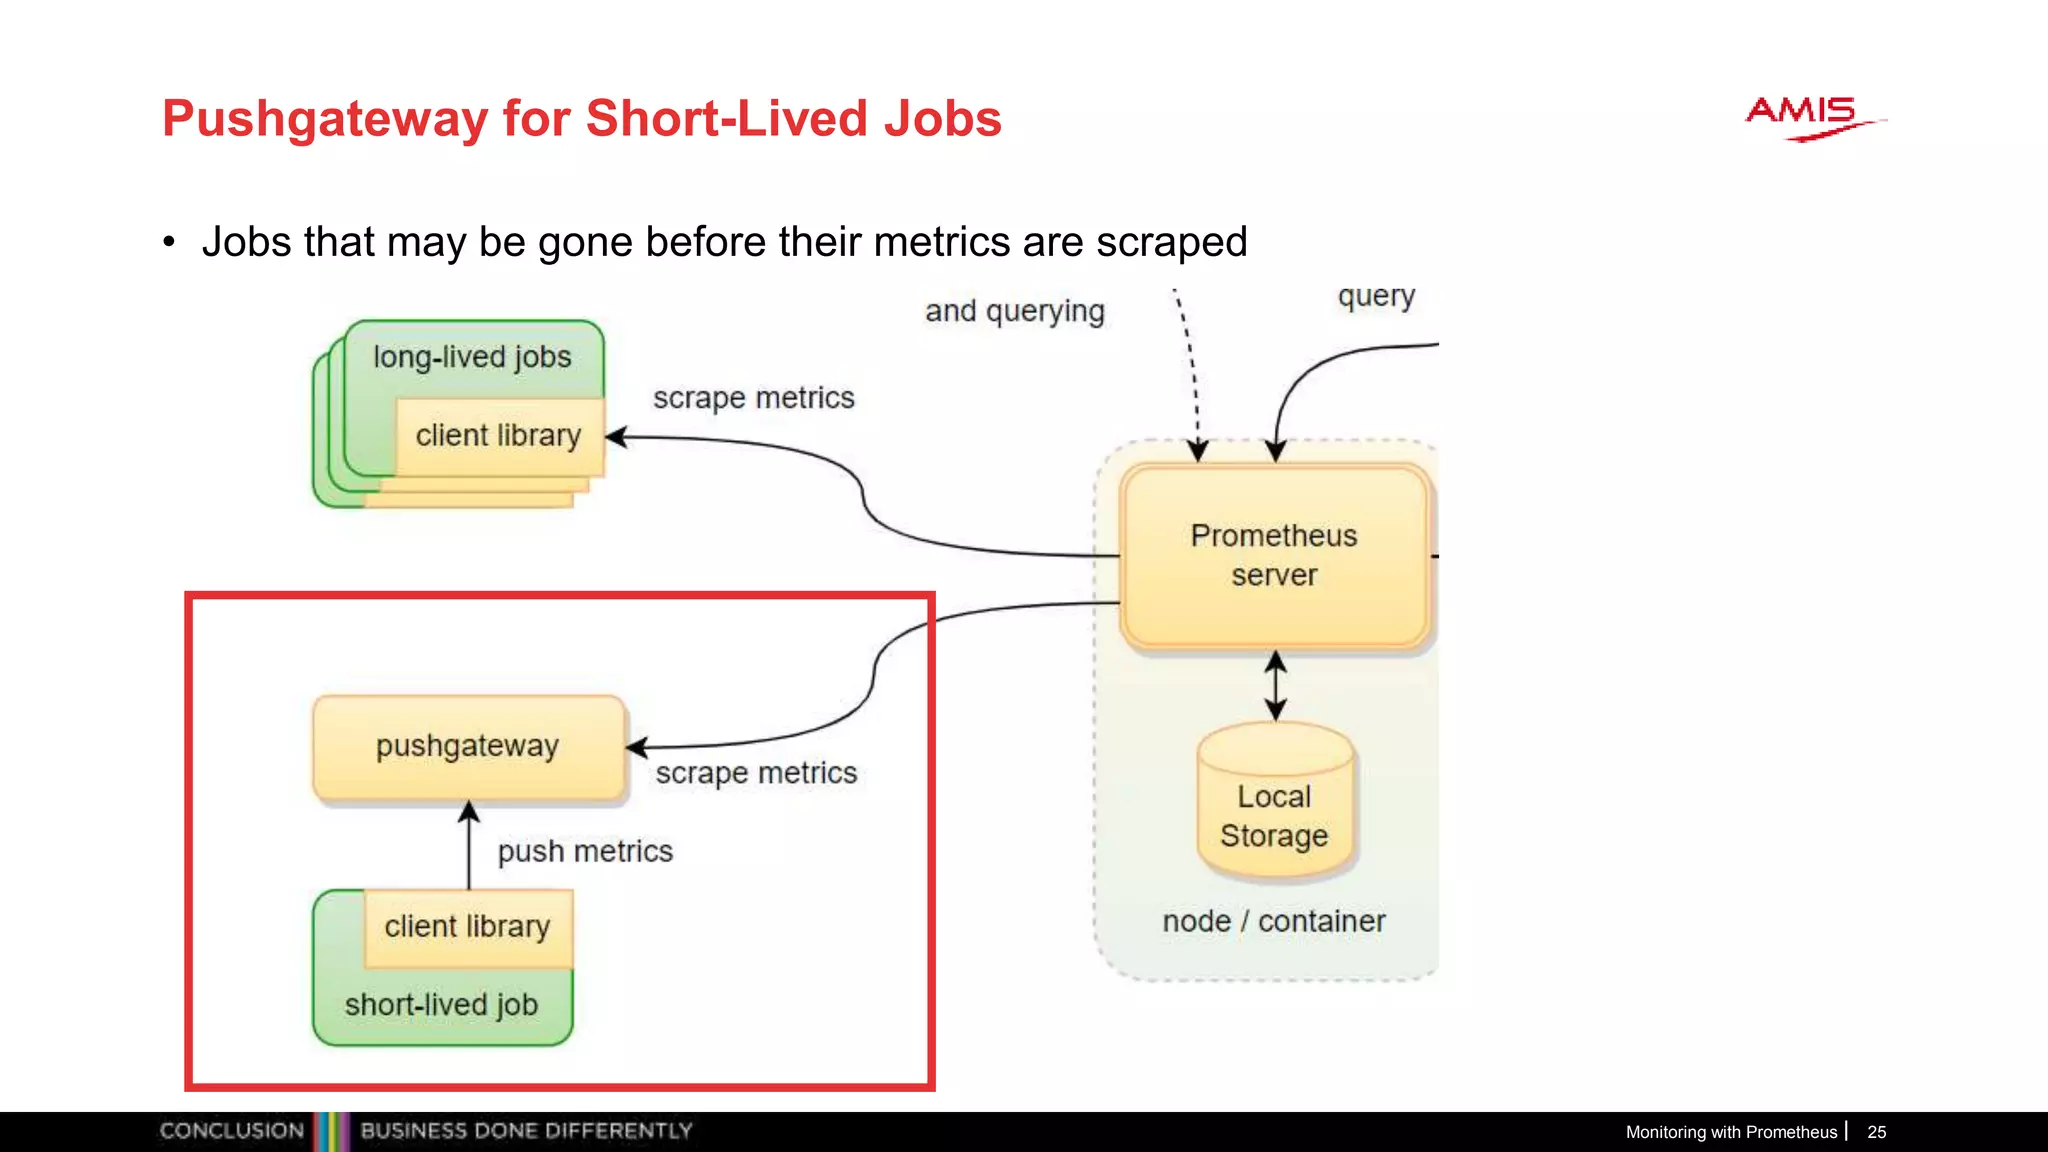
• Scheduled pull |harvest| scrape actions – HTTP/TCP requests
• Accessing Exporters and built in (scrape) endpoints
• Make metrics availabe to consuming systems and humans
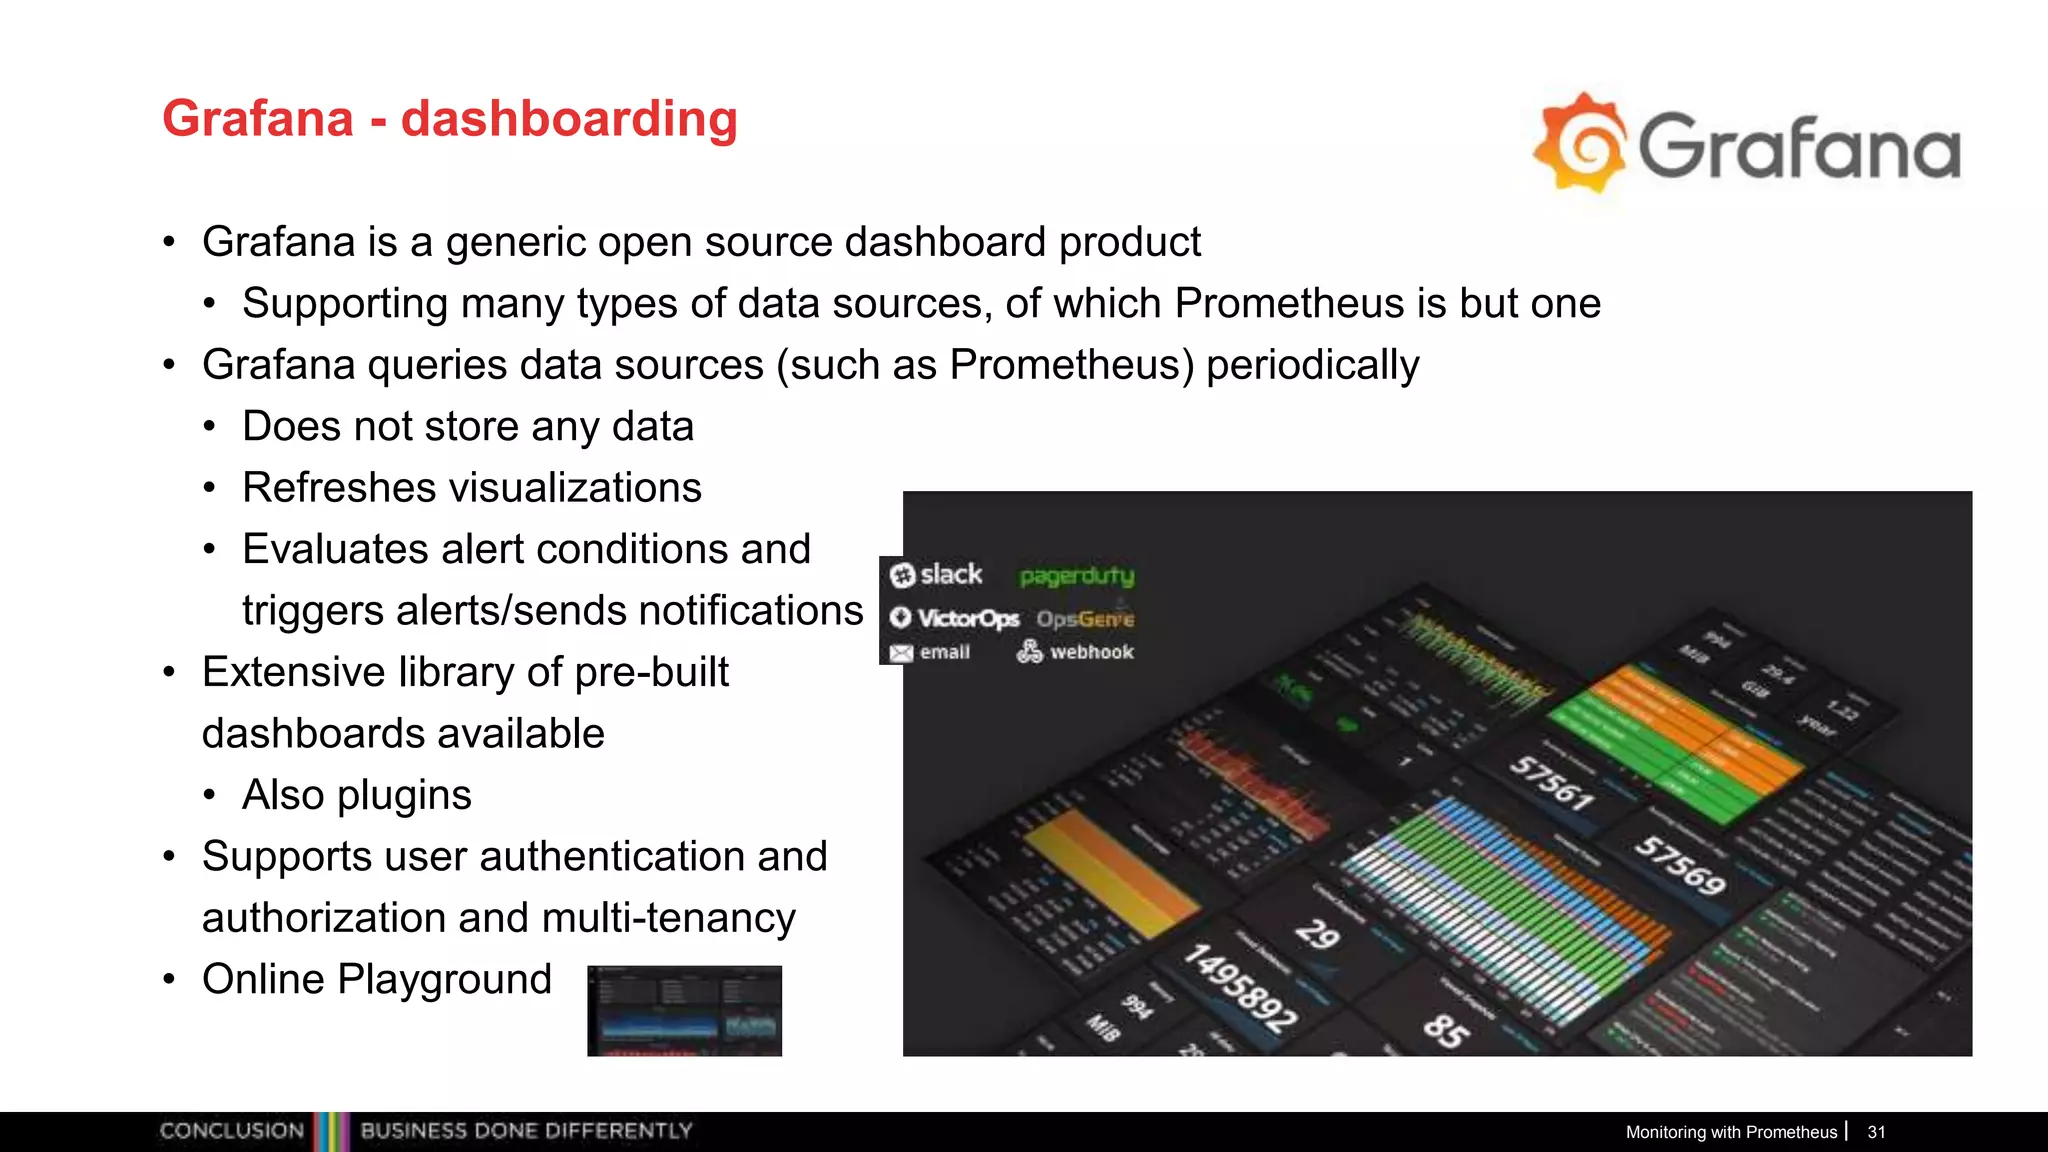
• Such as Grafana (for dashboarding)
• REST APIs
• Prometheus UI – Graphs, Console, PromQL
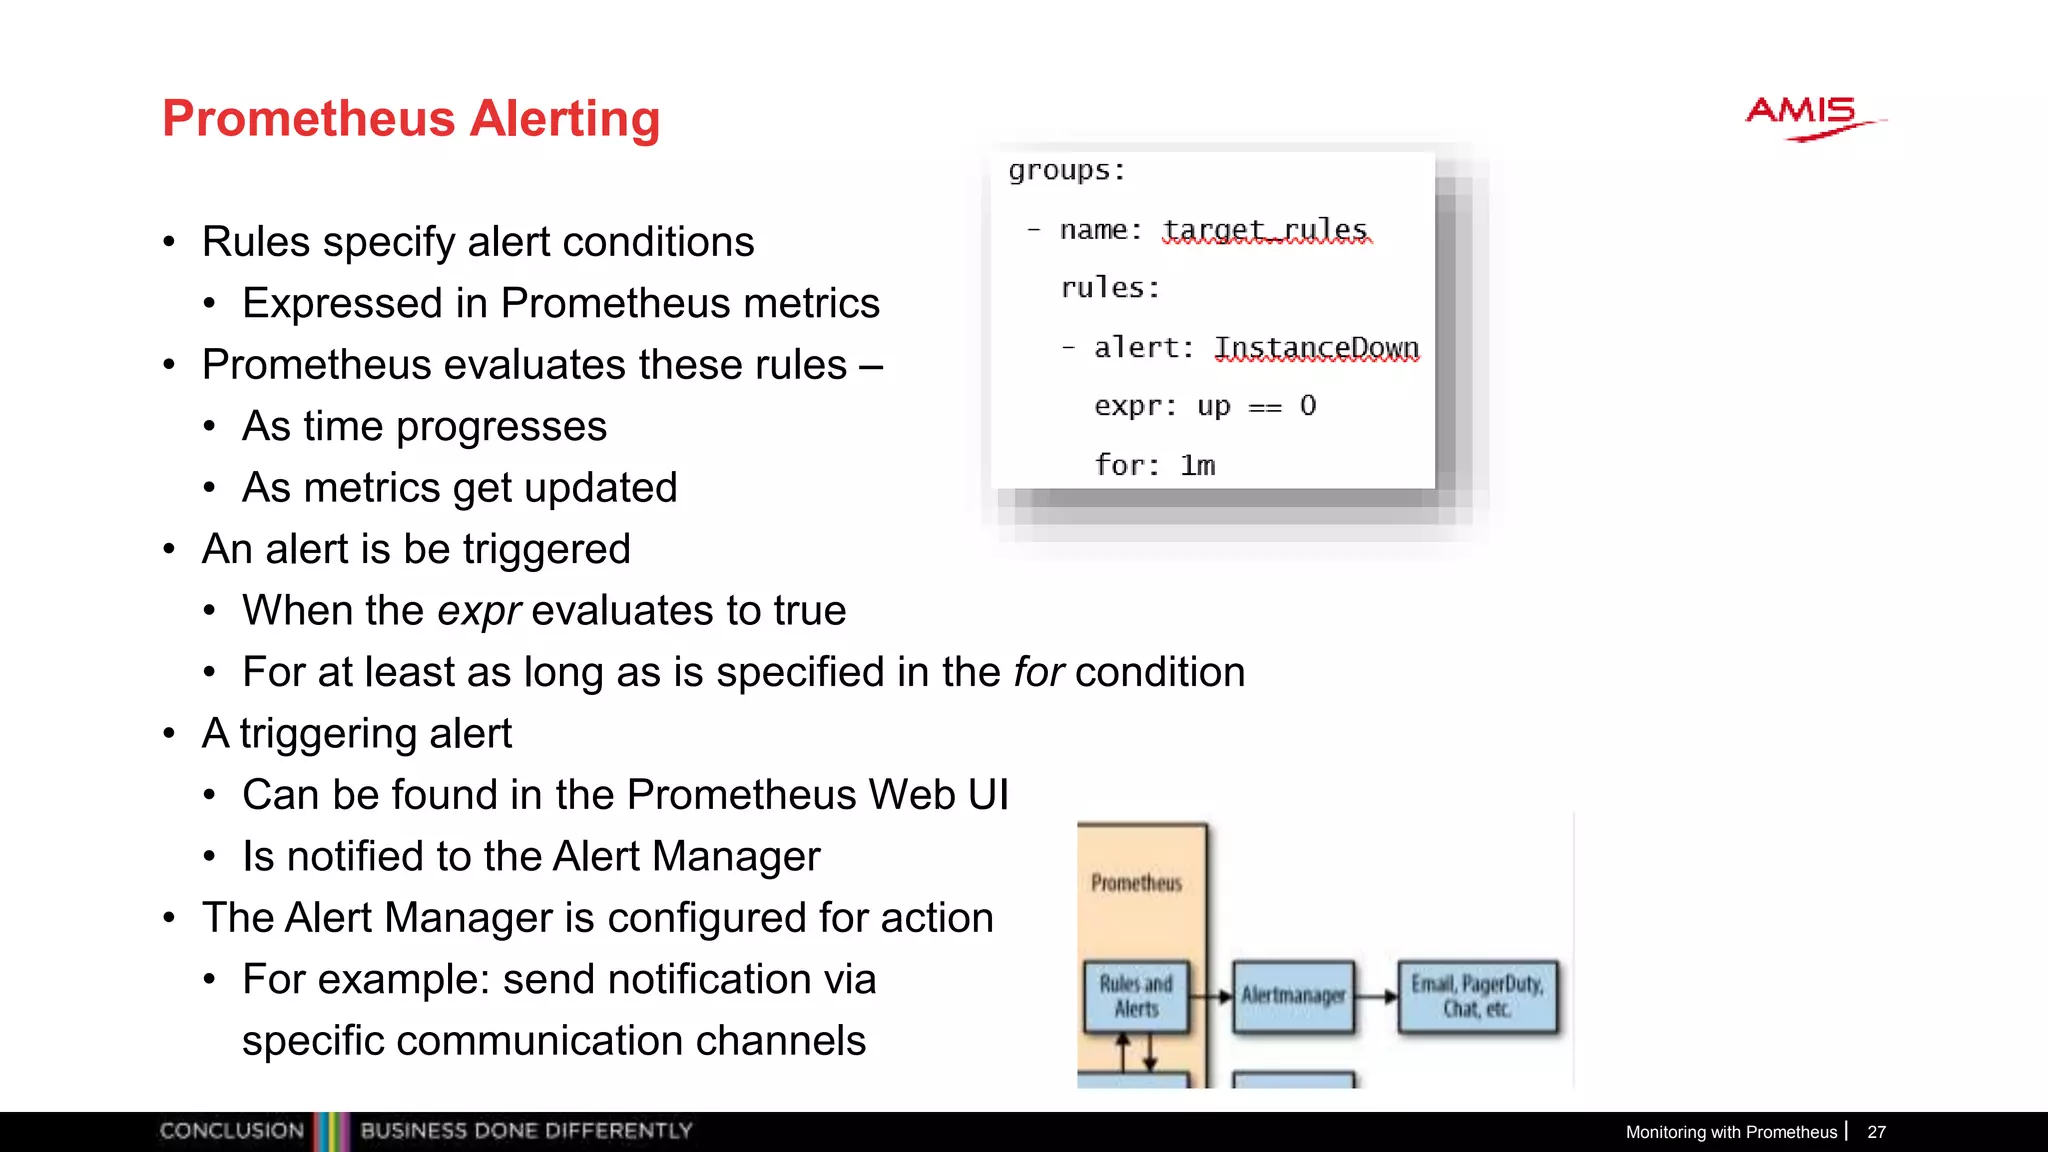
• Analyze metrics according to [alert] rules
• Determine if alerts are “firing”
• Act on firing alerts
• Send notifications
• Supports federation – global view over local environments and
recovery of local environment
Monitoring with Prometheus 11](https://image.slidesharecdn.com/monitoring-with-prometheus-workshop2018lucasjellema-180923154213/75/MeetUp-Monitoring-with-Prometheus-and-Grafana-September-2018-11-2048.jpg)
![Demo – Getting started with Prometheus
Monitoring with Prometheus 14
prometheus.yml
- job_name: 'prometheus'
# metrics_path defaults to /metrics
# scheme defaults to 'http'.
static_configs:
- targets: ['localhost:9090']](https://image.slidesharecdn.com/monitoring-with-prometheus-workshop2018lucasjellema-180923154213/75/MeetUp-Monitoring-with-Prometheus-and-Grafana-September-2018-14-2048.jpg)
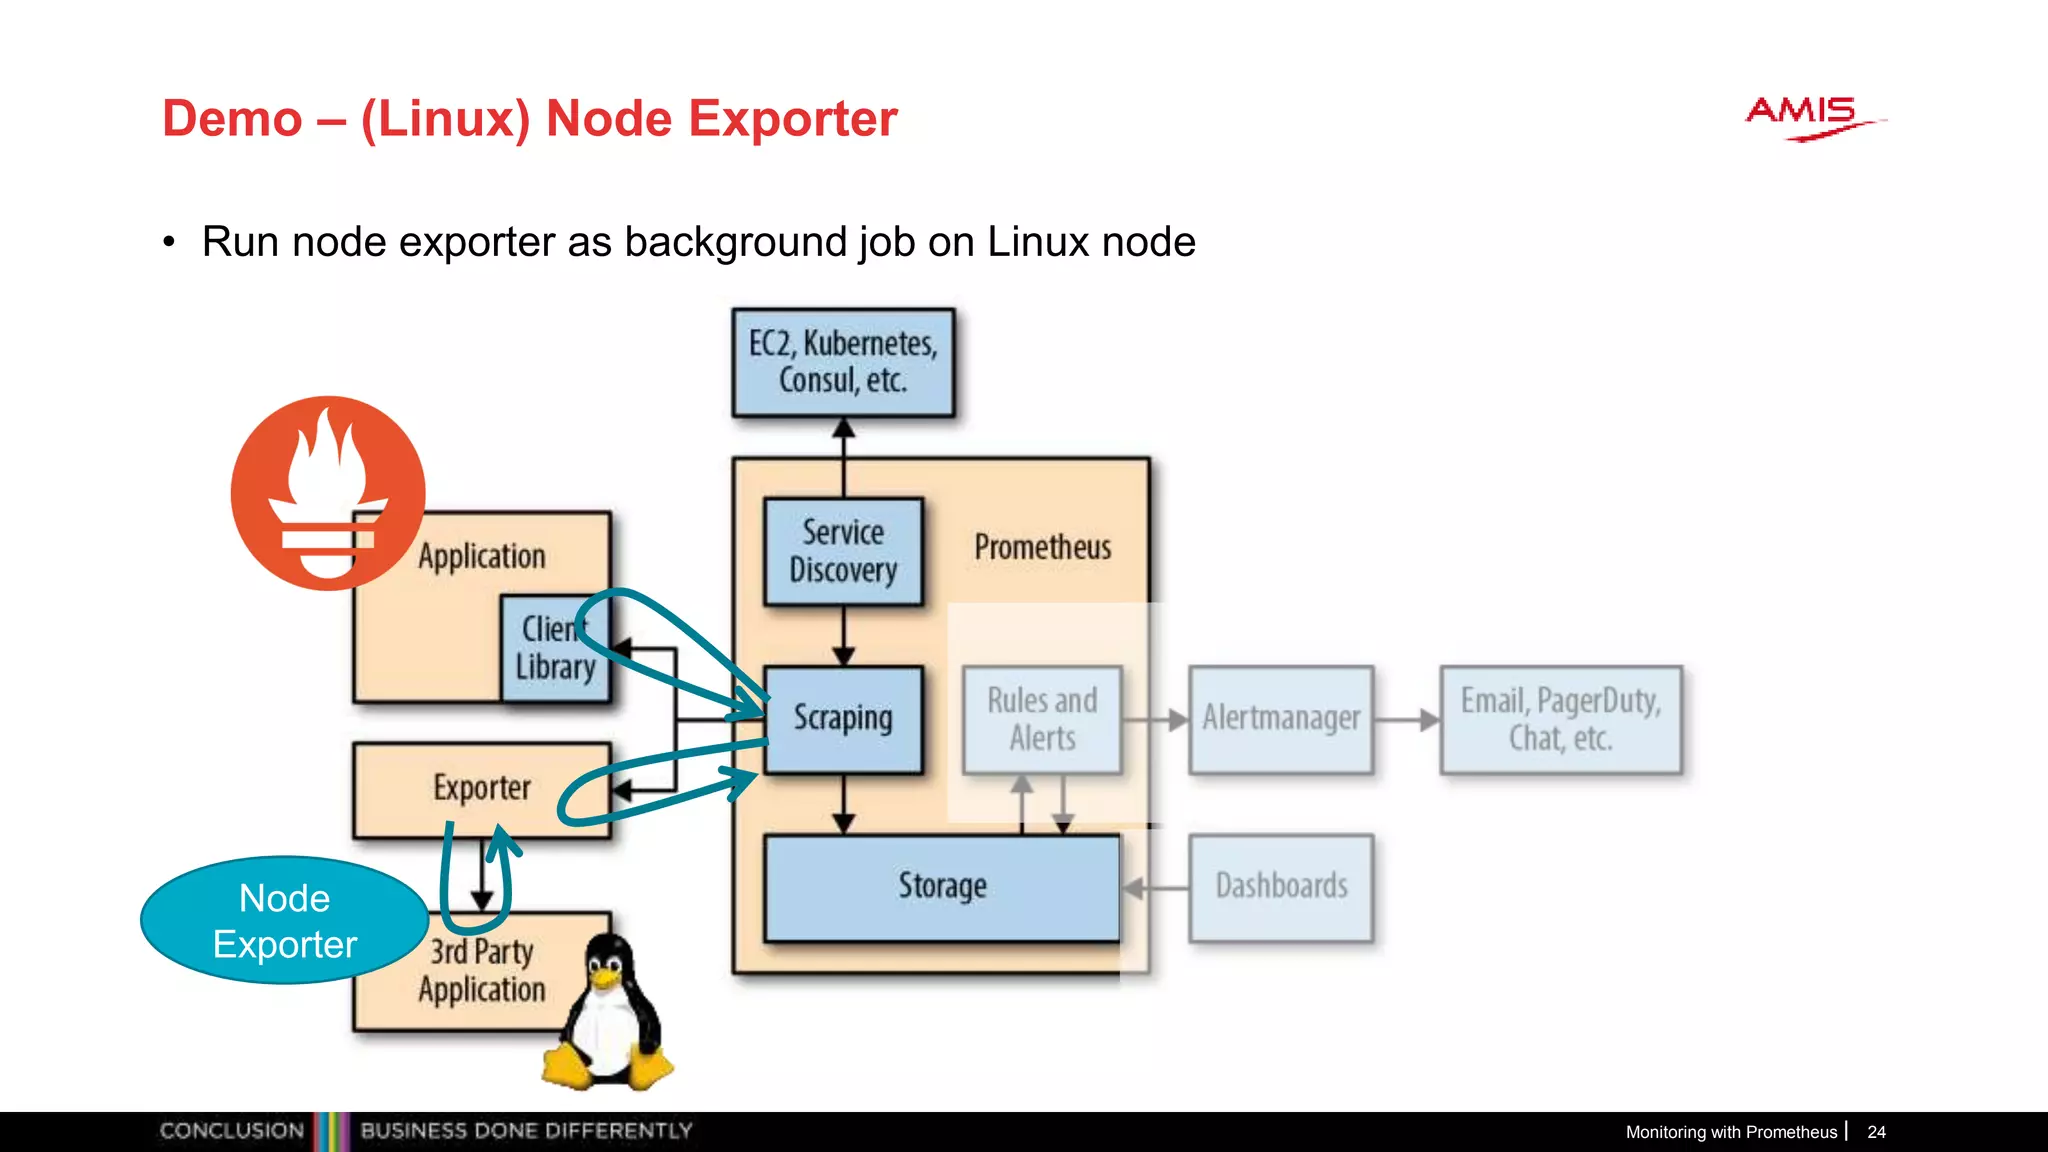
![Workshop
• Prometheus
• First steps
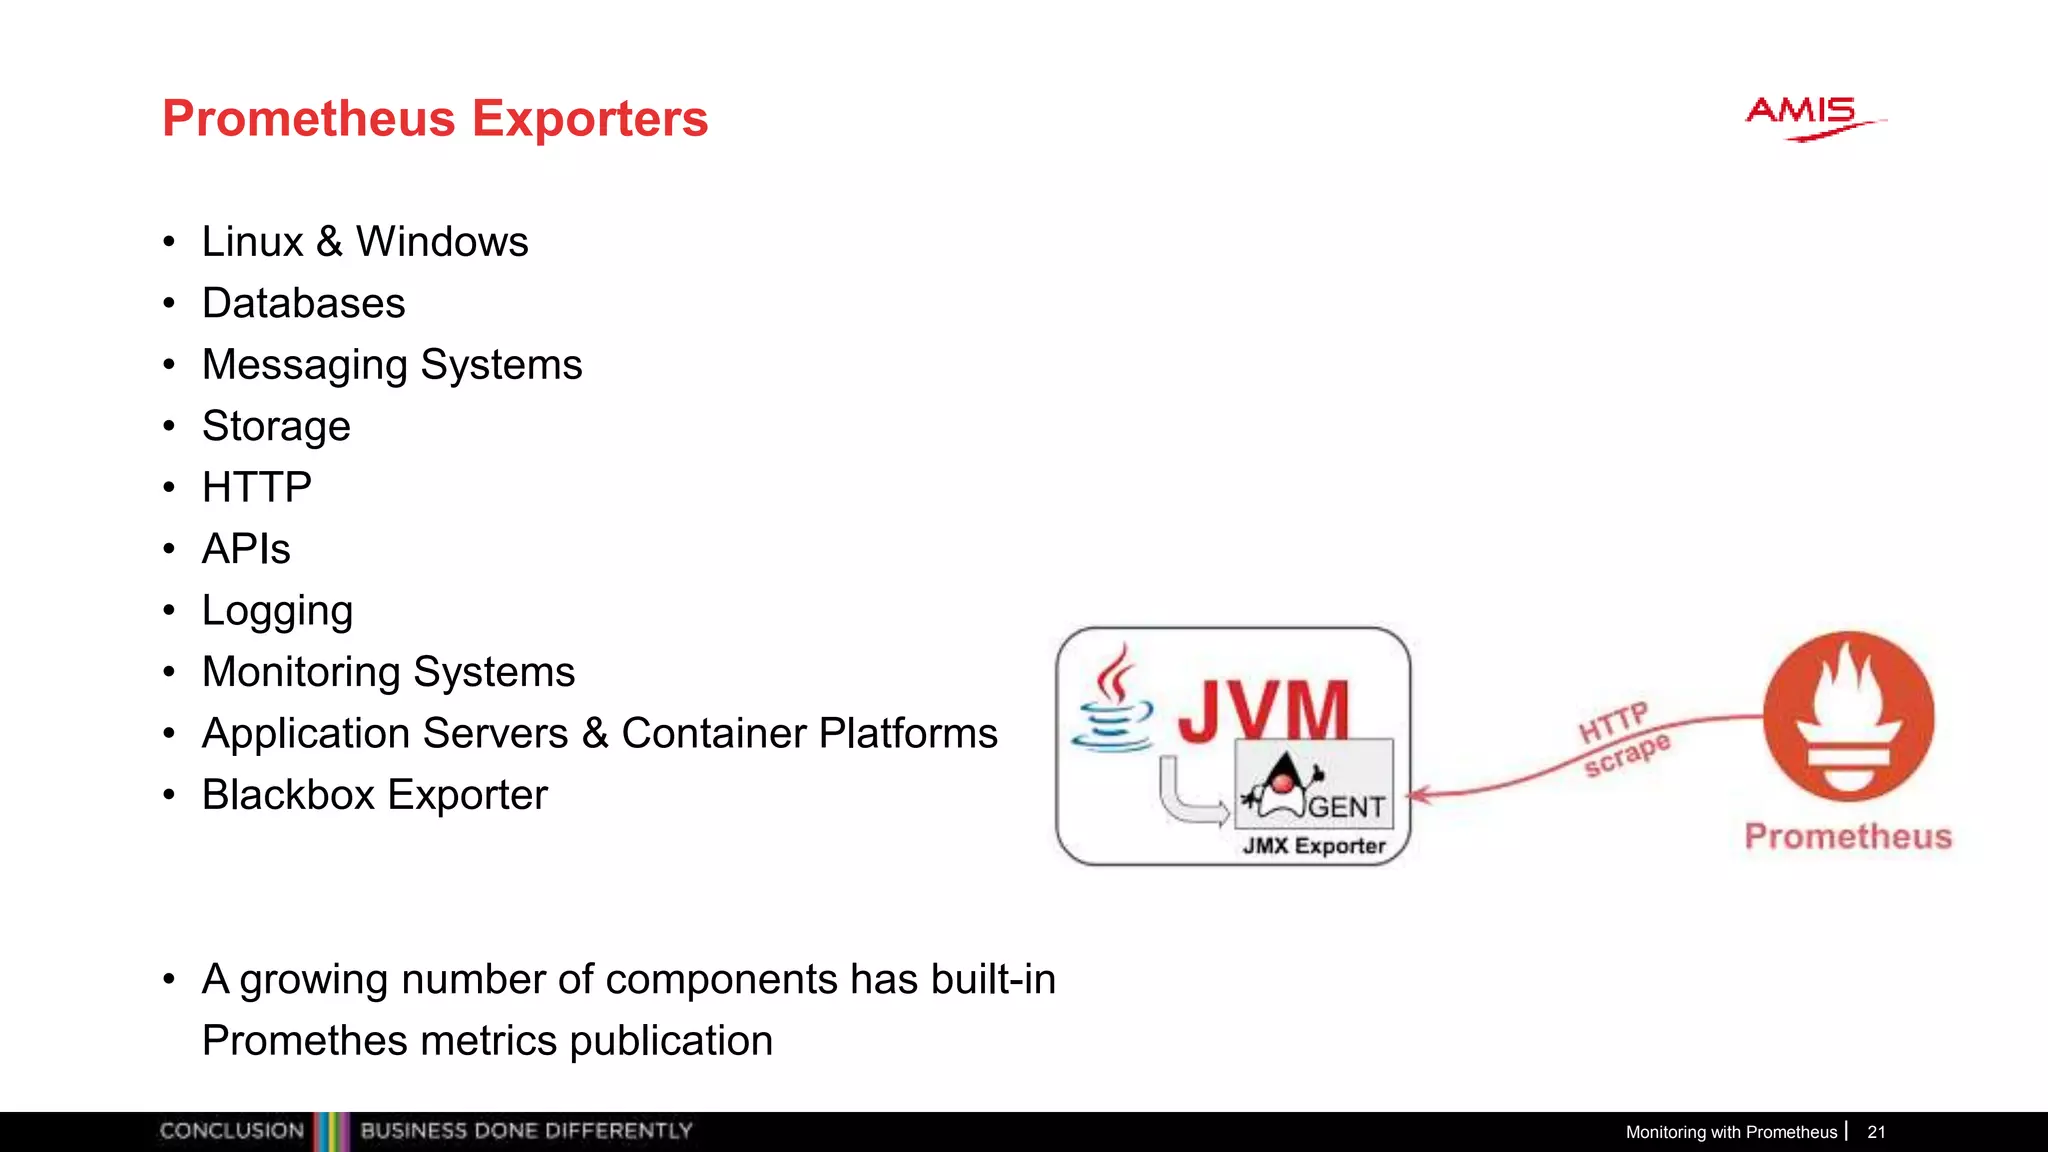
• Exporters for Linux, MySQL, Docker, Blackbox
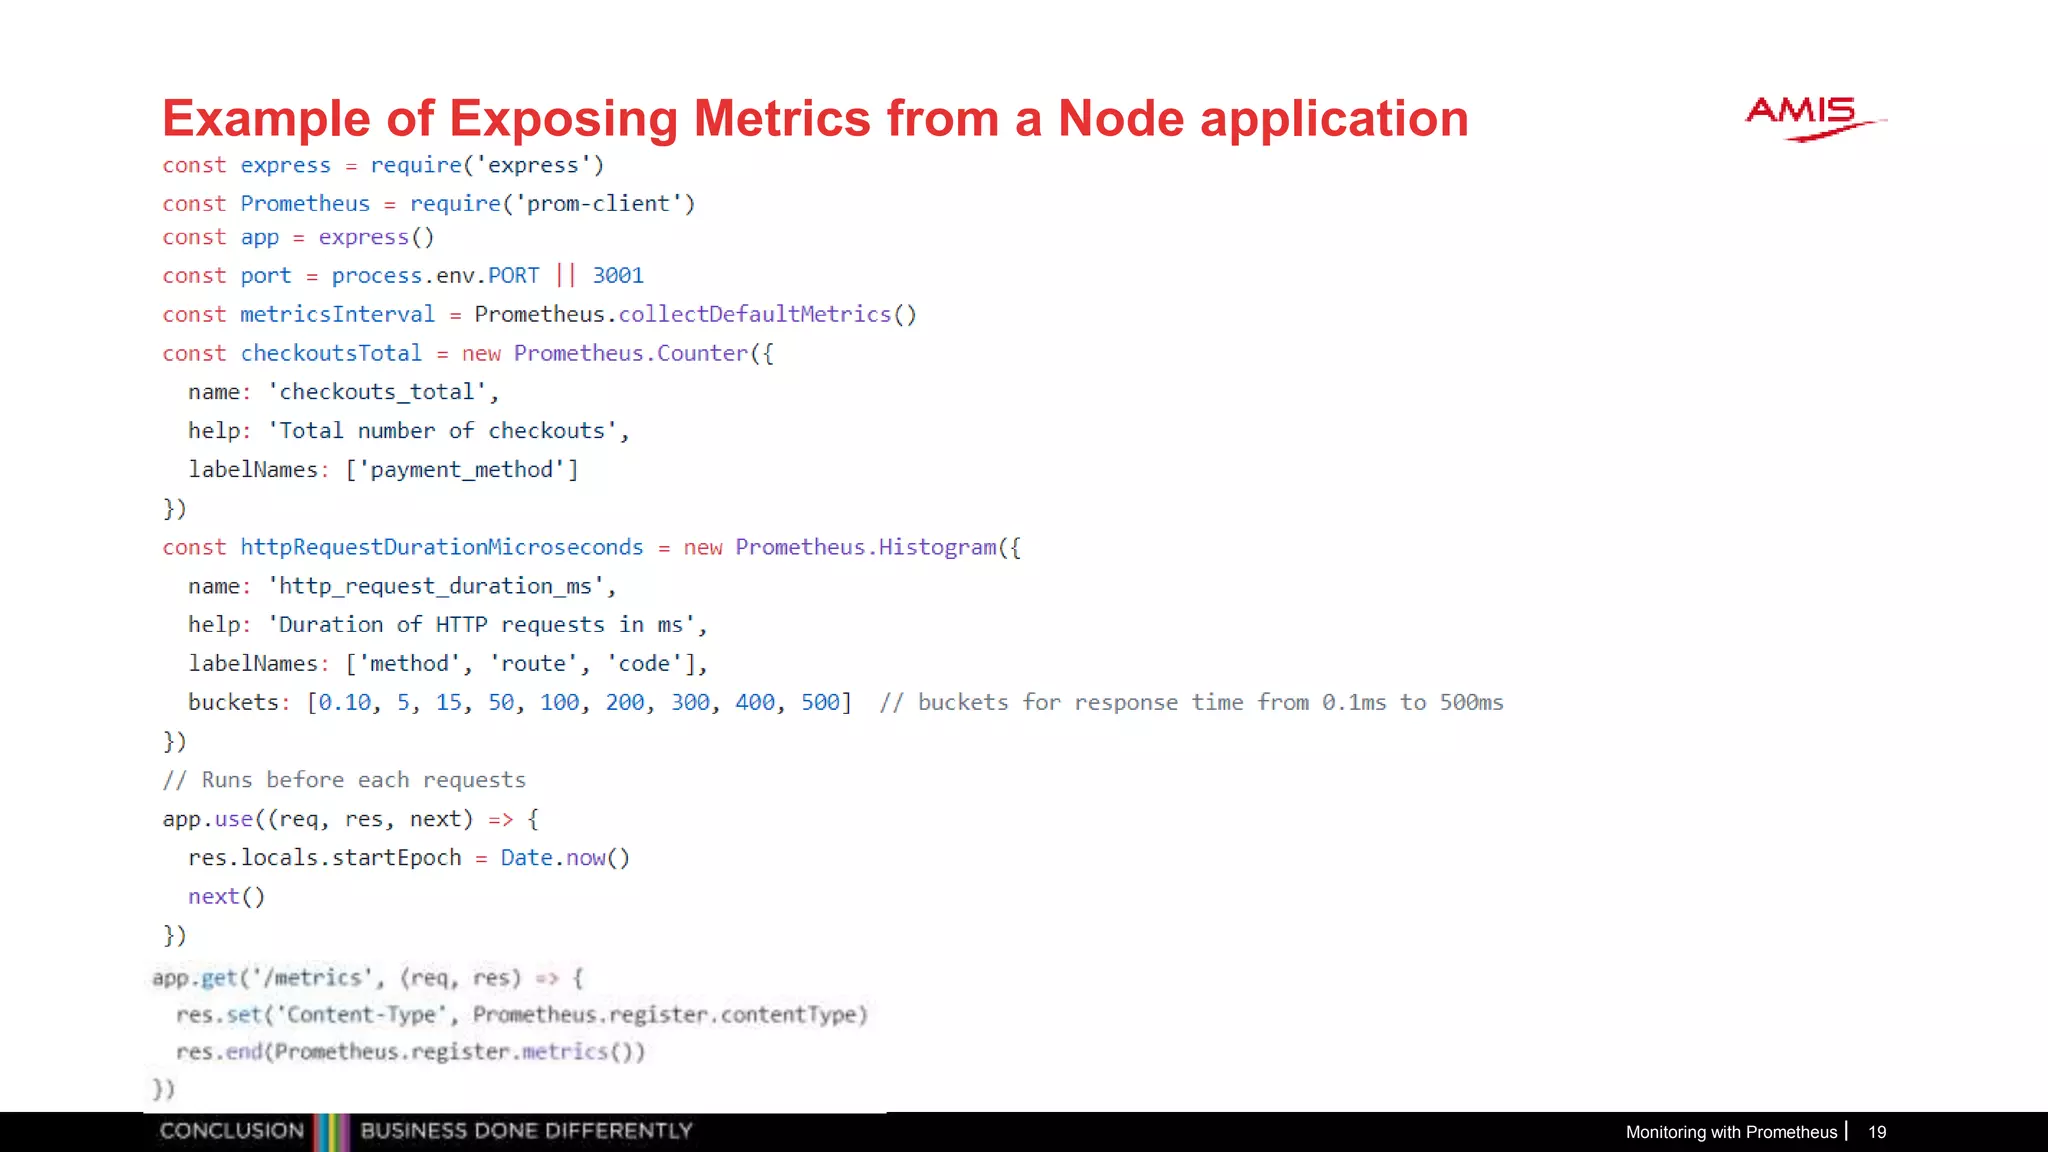
• Custom Application instrumentation (Node application)
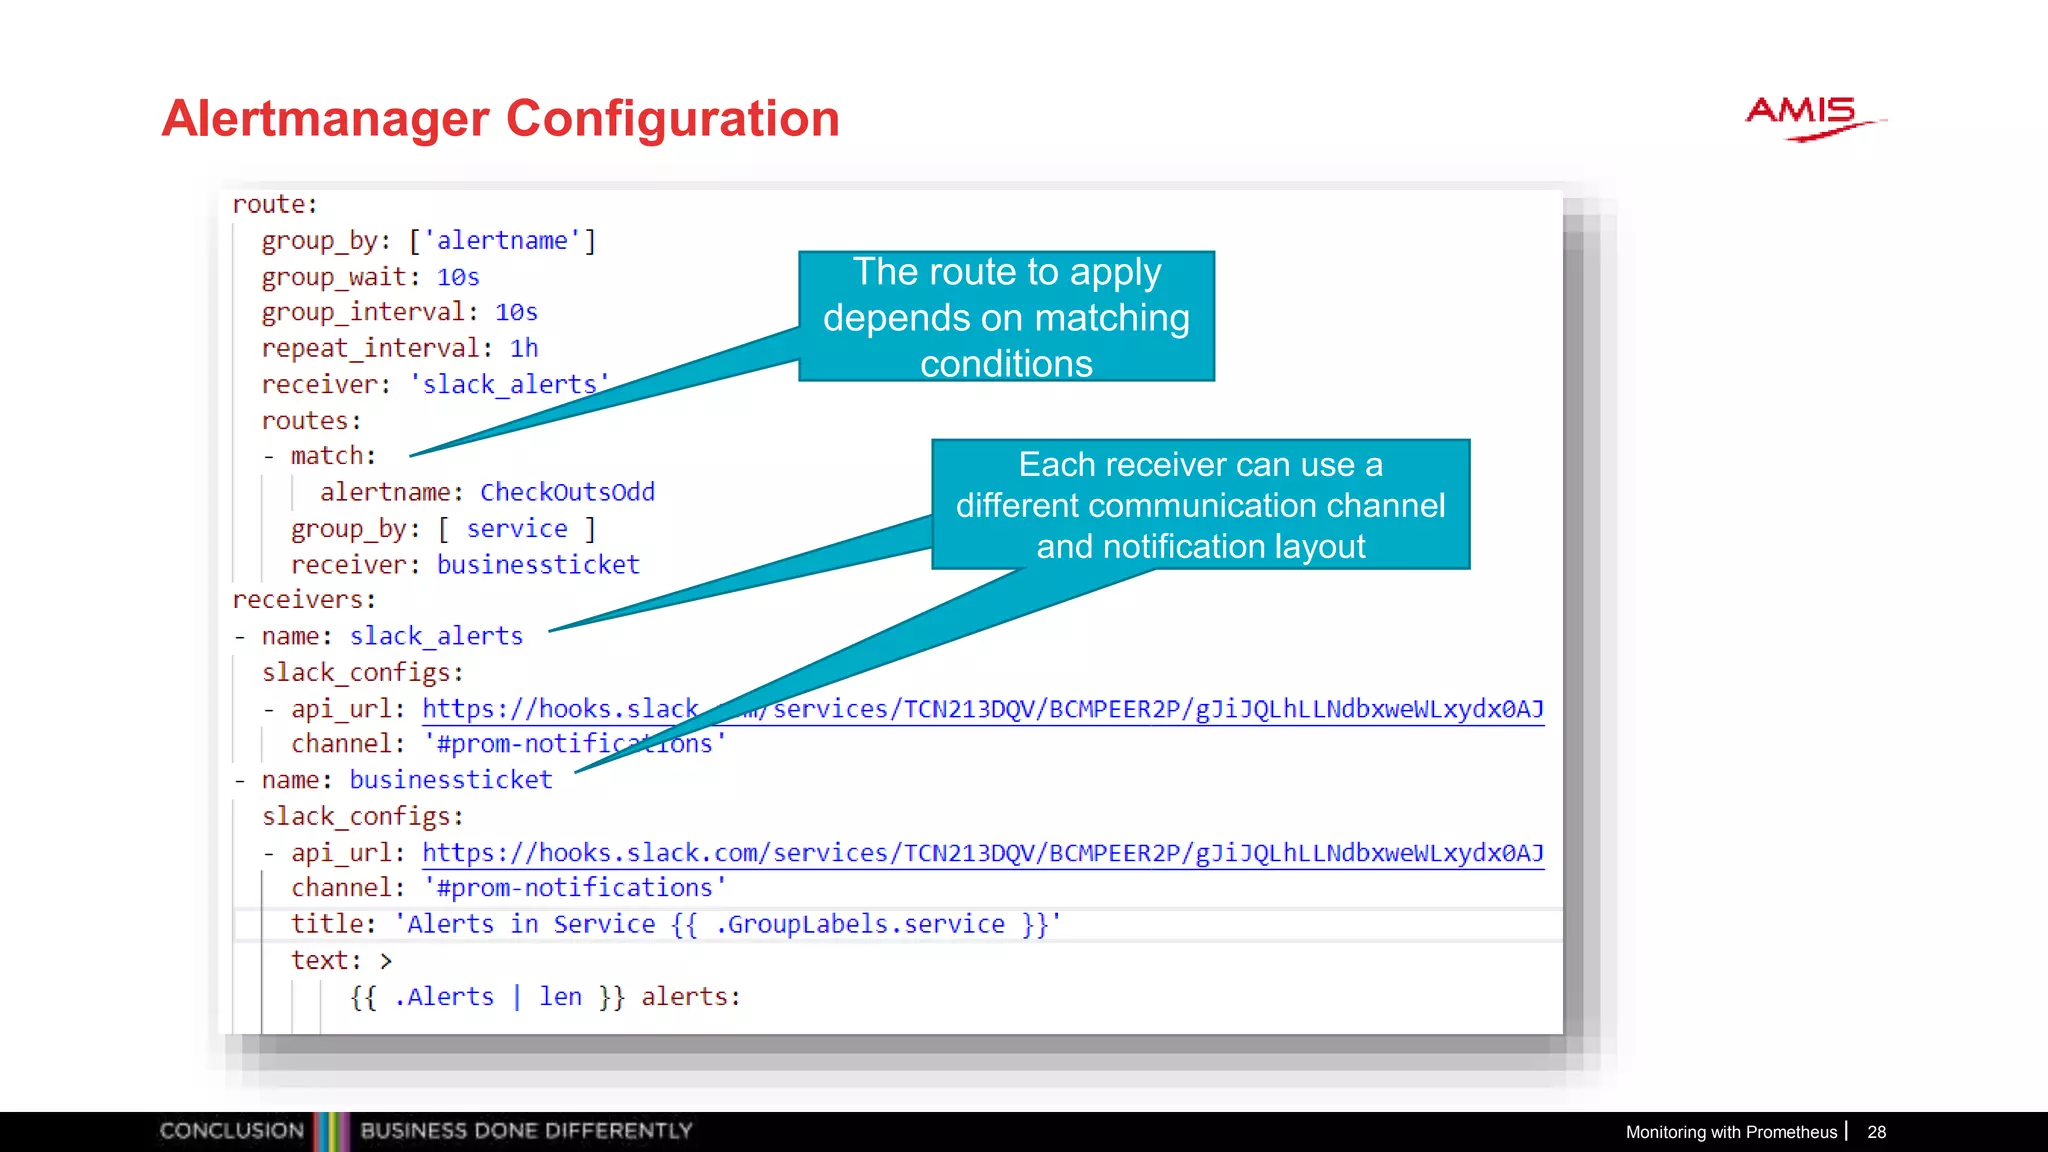
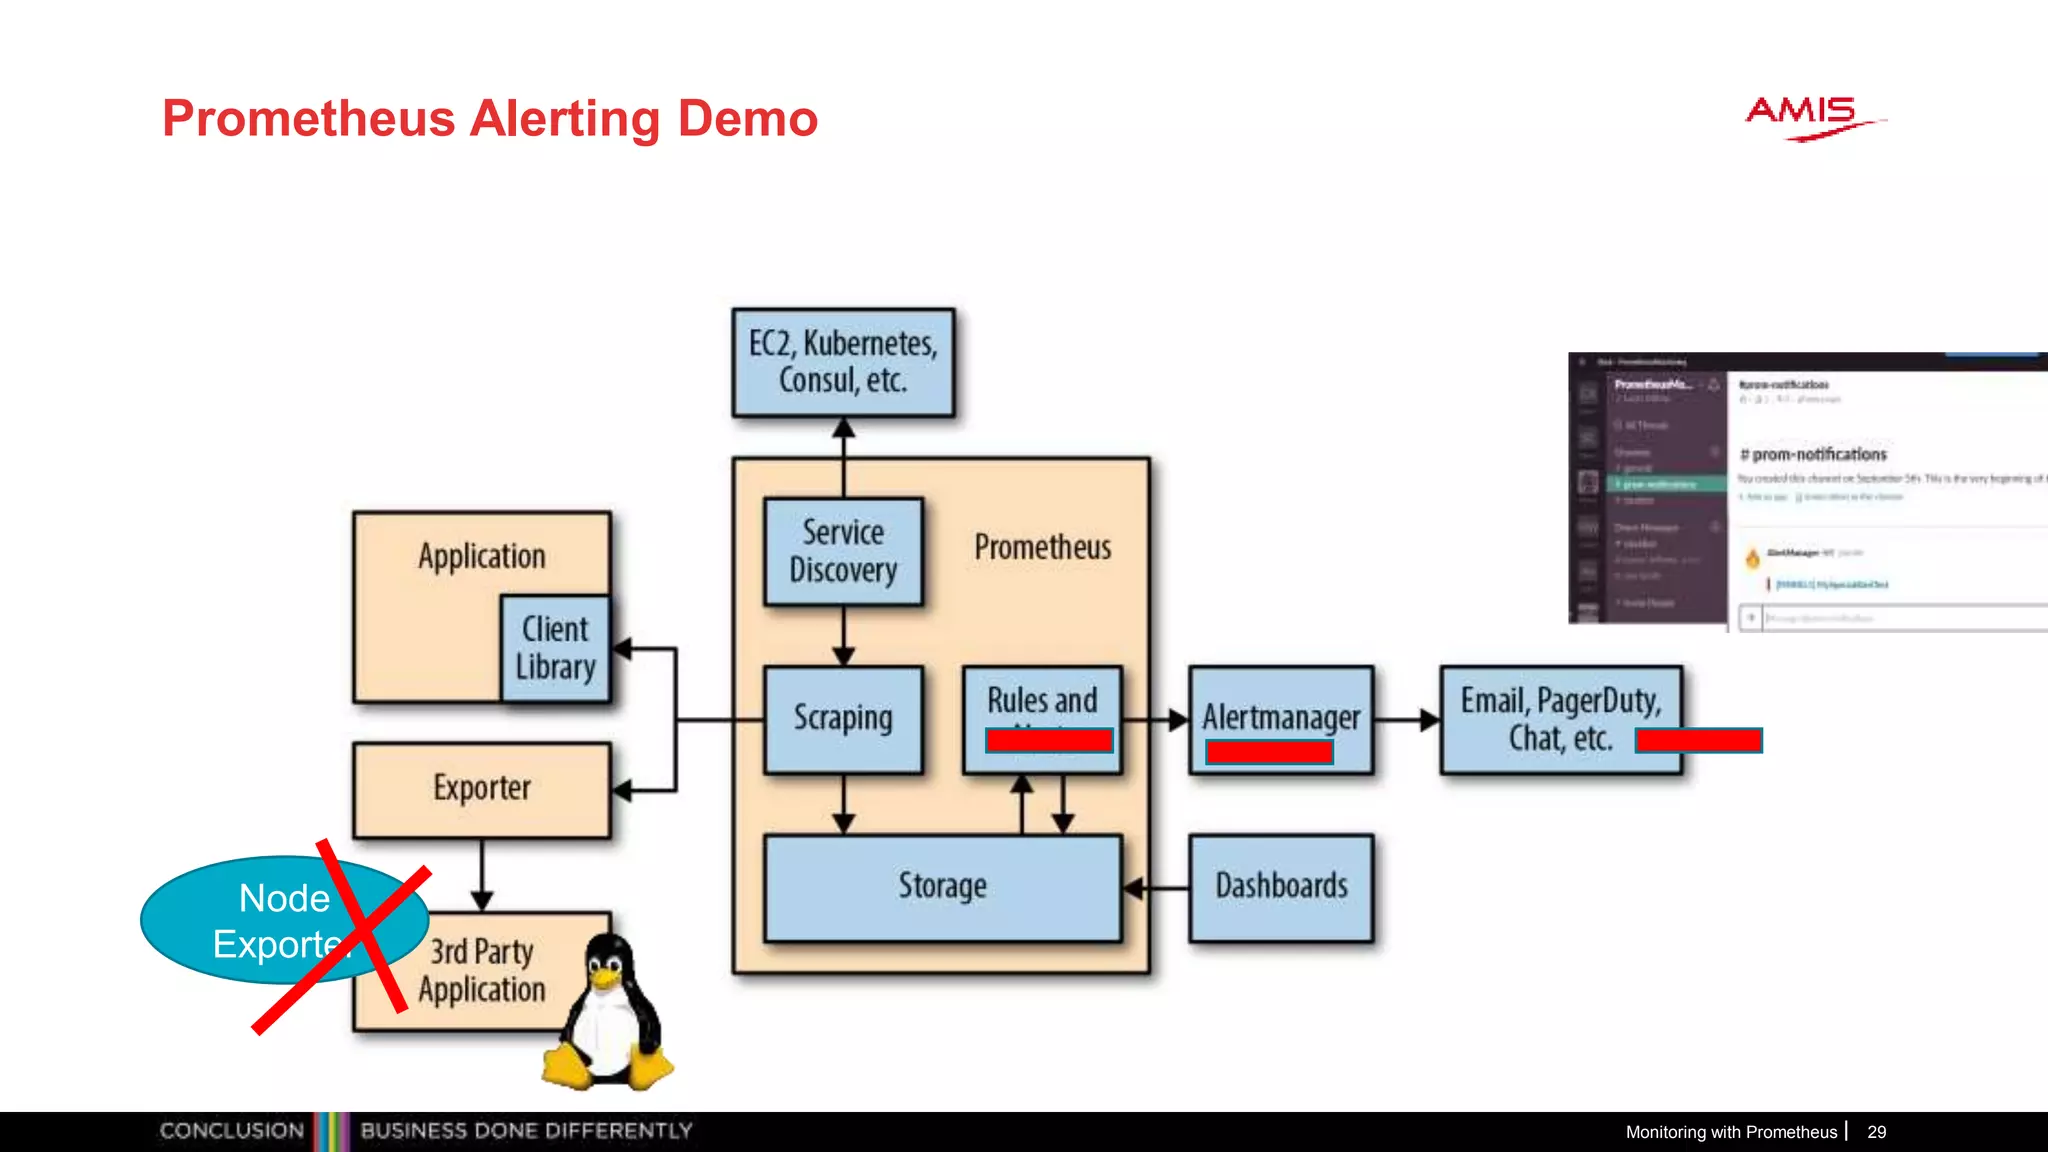
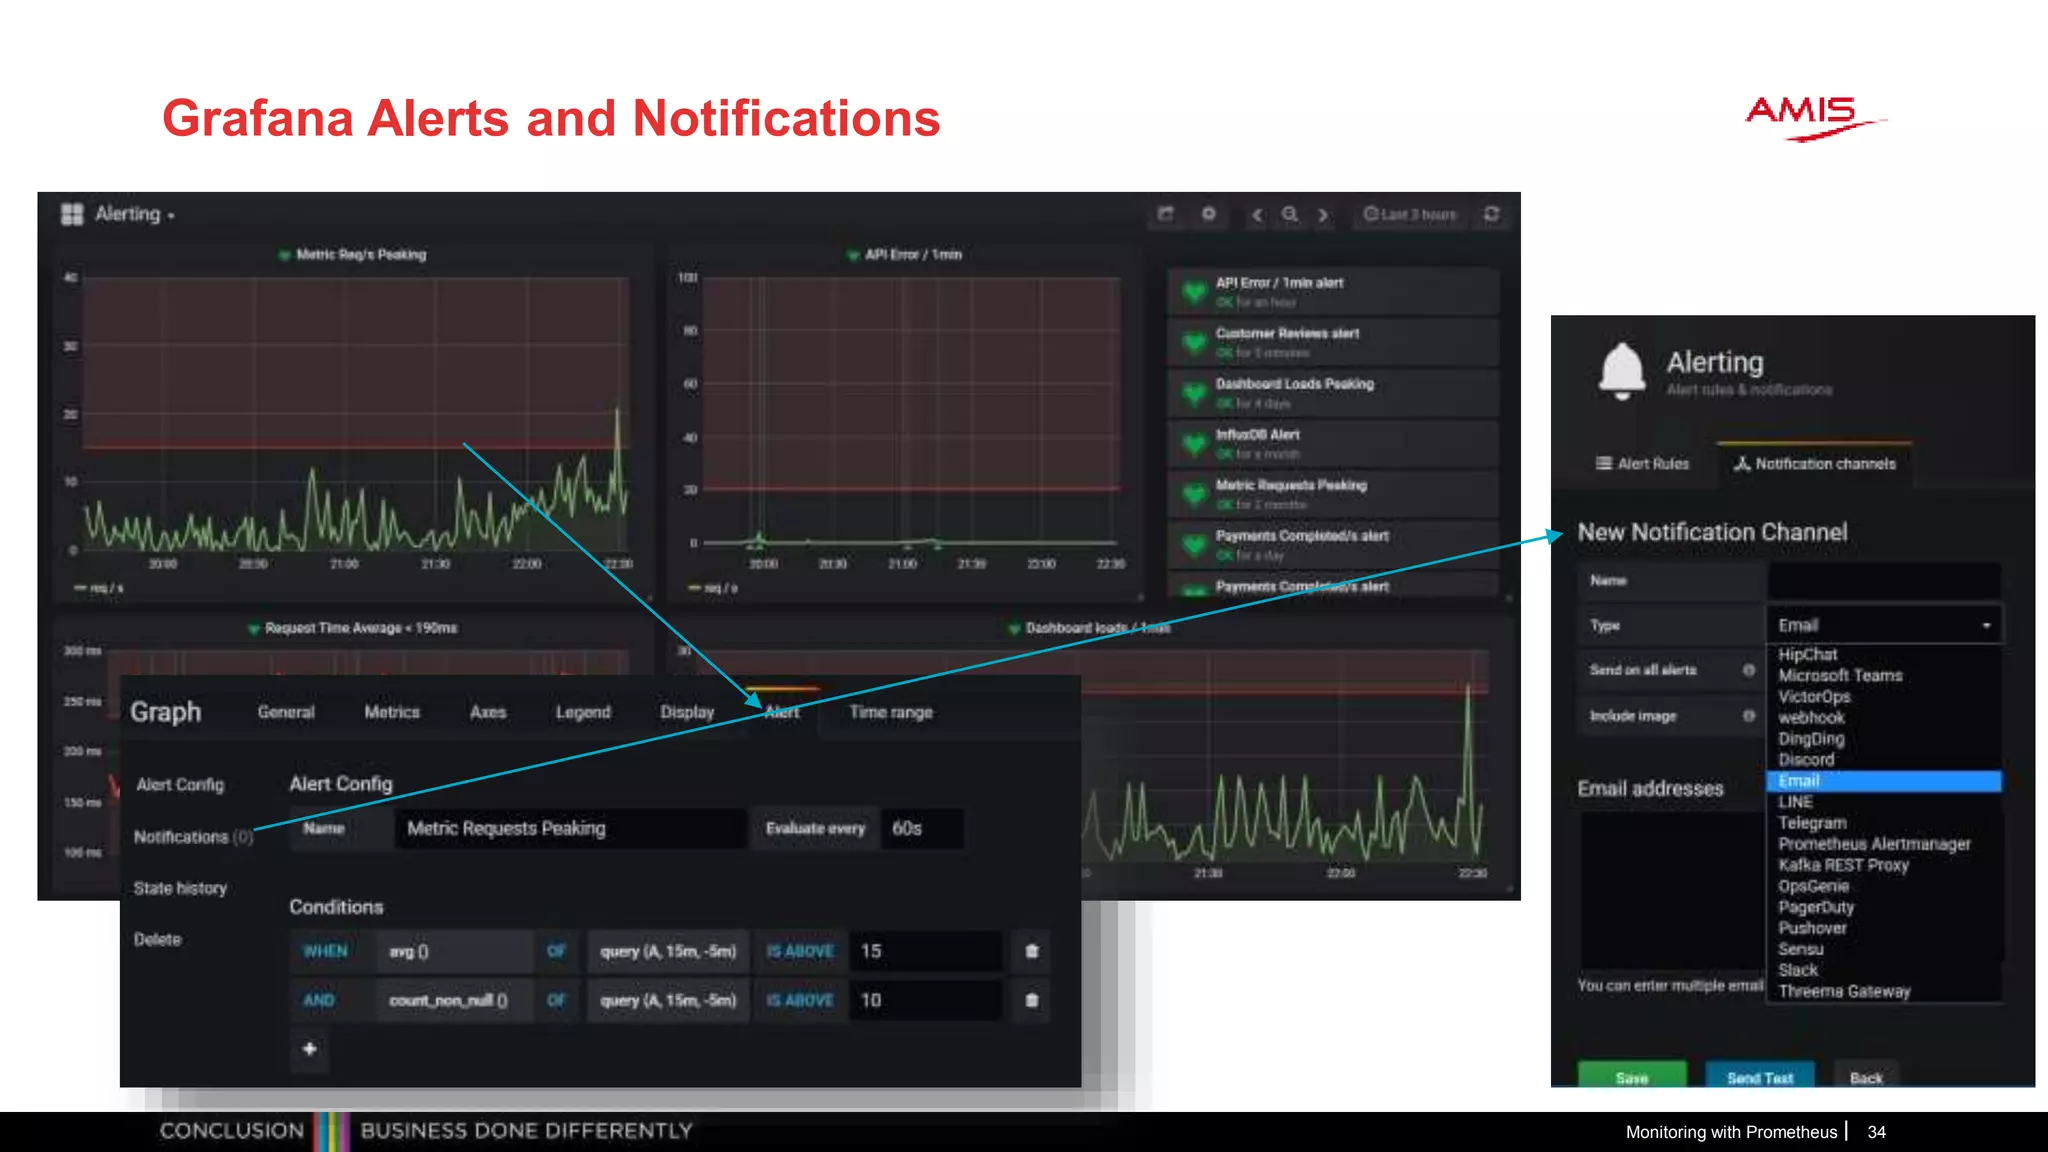
• Alerting
• Alert Manager and Notifications (to Slack)
• Grafana
• First steps
• Preconfigured Prometheus dashboard
• Custom Dashboard based on Prometheus metrics
• Alerts and notifications
• Use prebuilt VM image or build VM from scratch
• Need VirtualBox in both cases [and Vagrant for build from scratch]
Monitoring with Prometheus 35
Materials: http://bit.ly/prometheus-amis](https://image.slidesharecdn.com/monitoring-with-prometheus-workshop2018lucasjellema-180923154213/75/MeetUp-Monitoring-with-Prometheus-and-Grafana-September-2018-35-2048.jpg)

The document provides an overview of monitoring using Prometheus and Grafana, emphasizing the importance of real-time observation of application performance and health. It discusses the types of metrics, the architecture of Prometheus, and the integration with Grafana for visualization and alerting. Additionally, it details the setup process for metrics gathering and notification configurations, along with resources for getting started.