Downloaded 15 times


![PromQL & Label based queries
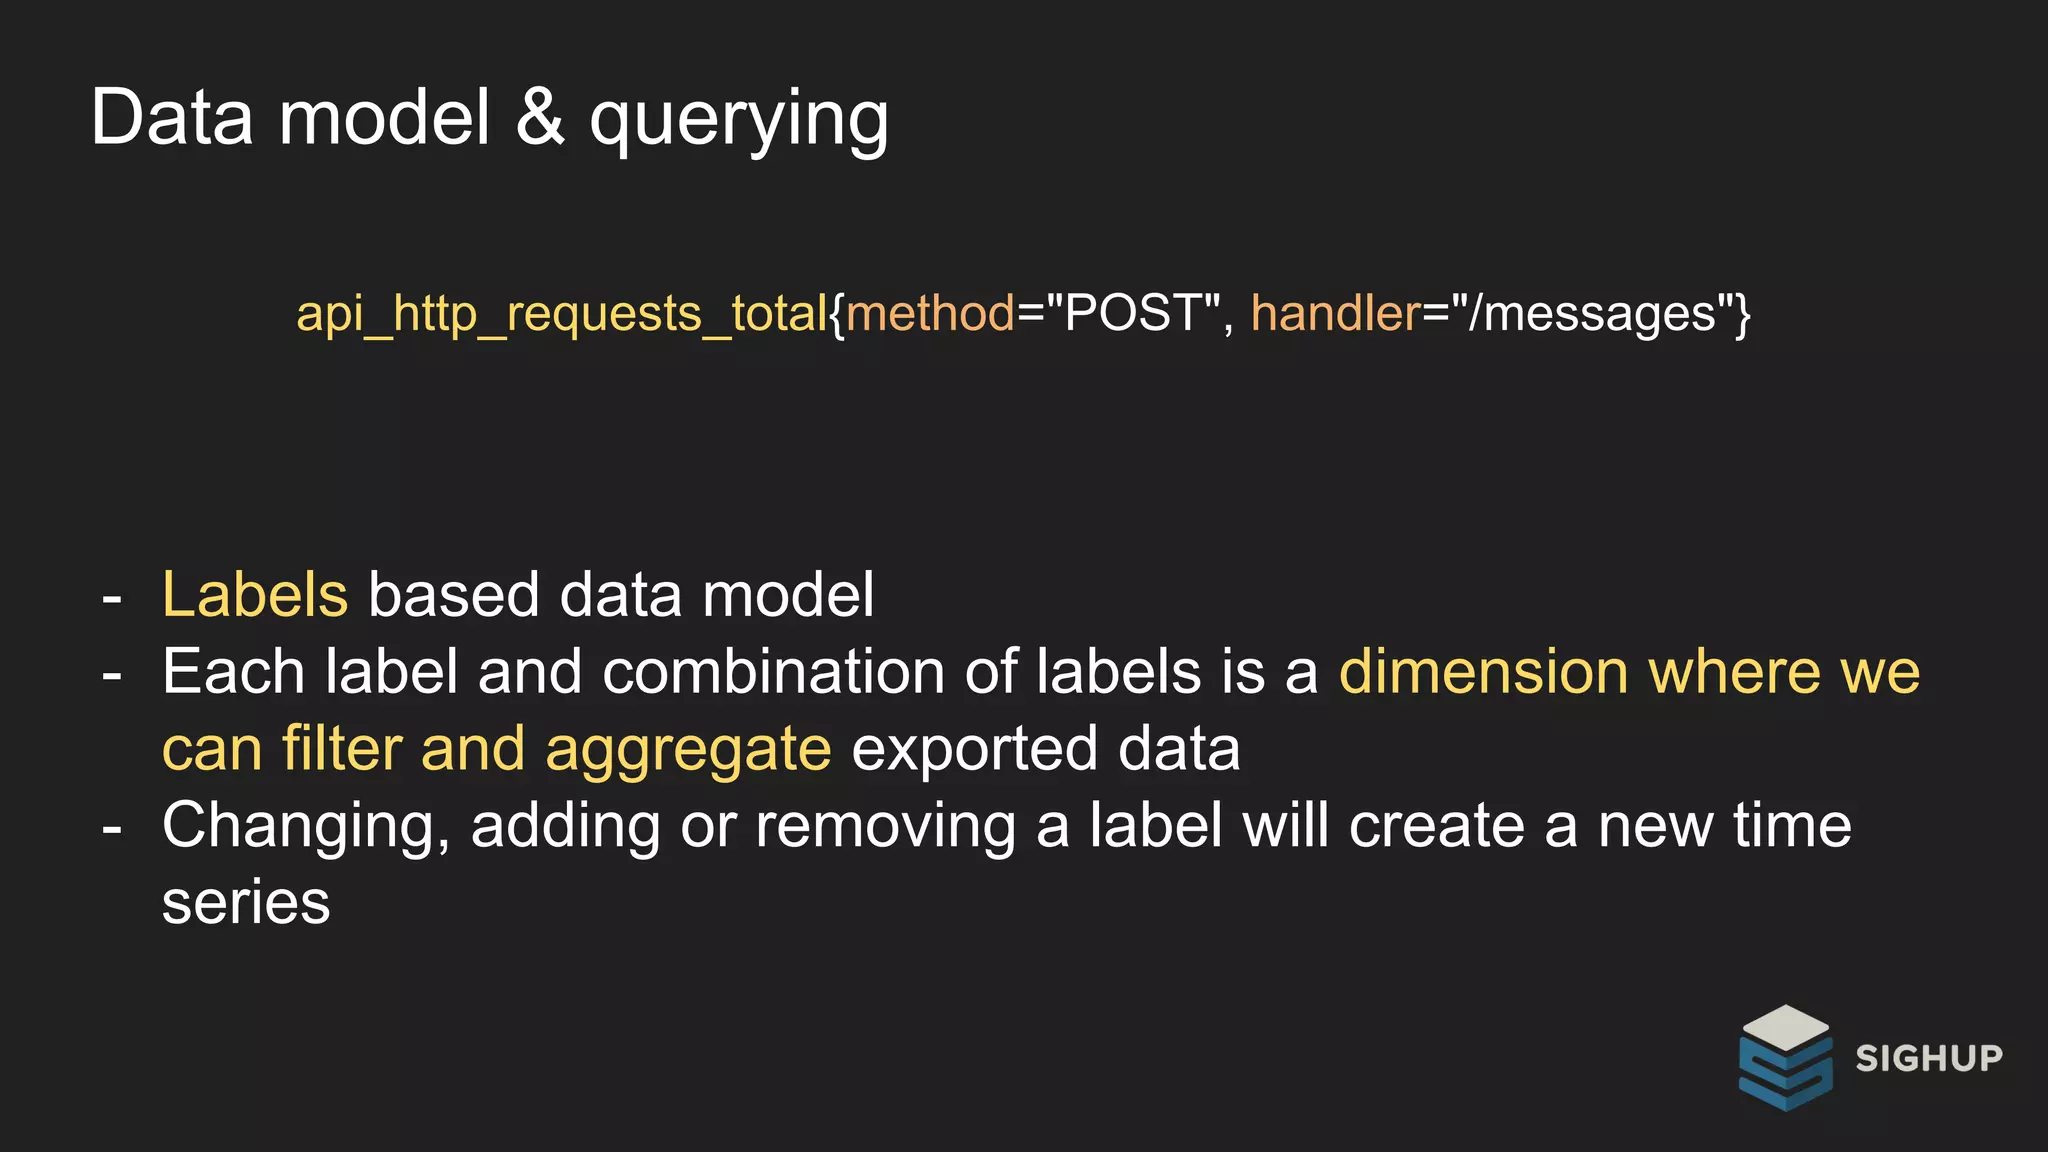
http_requests_total all time series related to the metric http_requests_total
http_requests_total{code="200",method="get"} time series related to successful request with
method get for the metric http_requests_total
http_requests_total{code="200",method="get"}[5m] returns a range vector](https://image.slidesharecdn.com/l2dmltbttogcx8c5iswp-signature-ff1ab46738215e4b8a3c9eaa527c9eabe0cba5e5ec75c65eedf9de224487410f-poli-171116163045/75/Jacopo-Nardiello-Monitoring-Cloud-Native-applications-with-Prometheus-Codemotion-Milan-2017-27-2048.jpg)
![PromQL & Label based queries
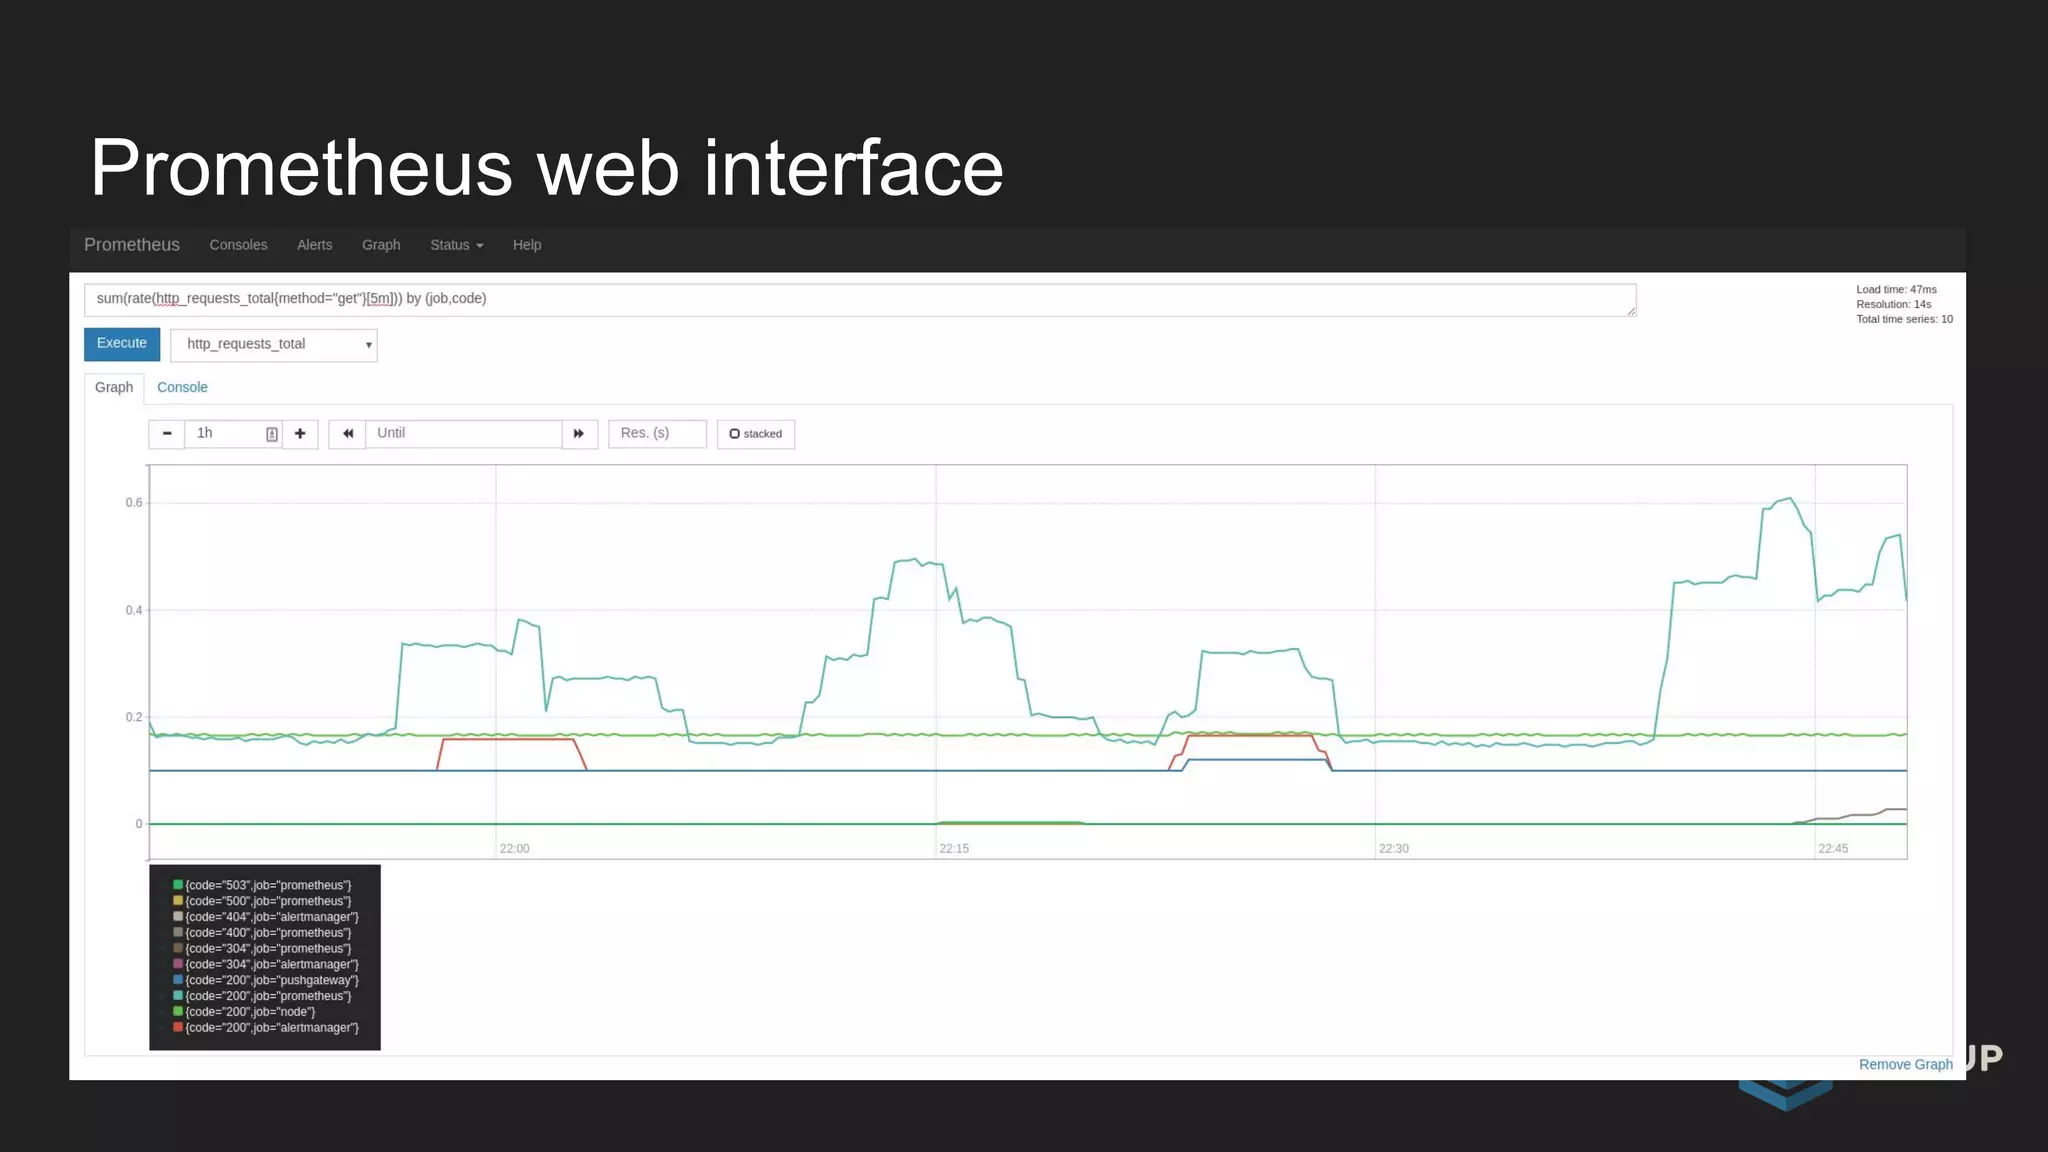
http_requests_total{status!~"^4..$"}
Selecting all errors-related time series using
regexes
sum(rate(http_requests_total[5m])) by (job) Applying functions, in this case we sum over a
range vector and aggregating by job](https://image.slidesharecdn.com/l2dmltbttogcx8c5iswp-signature-ff1ab46738215e4b8a3c9eaa527c9eabe0cba5e5ec75c65eedf9de224487410f-poli-171116163045/75/Jacopo-Nardiello-Monitoring-Cloud-Native-applications-with-Prometheus-Codemotion-Milan-2017-28-2048.jpg)
![Re-labeling
- Relabeling is a very powerful mechanism that allow us to further manipulate labels from the targets.
- It’s a very effective way to turn targets from an API and apply sophisticated targeting strategies (i.e.
manipulating addresses or ports, filtering a subset of targets, etc..)
A quick configuration example:
- job_name: 'kubernetes-pods'
kubernetes_sd_configs:
- role: pod
relabel_configs:
- source_labels: [__meta_kubernetes_pod_annotation_prometheus_io_scrape]
action: keep
regex: true](https://image.slidesharecdn.com/l2dmltbttogcx8c5iswp-signature-ff1ab46738215e4b8a3c9eaa527c9eabe0cba5e5ec75c65eedf9de224487410f-poli-171116163045/75/Jacopo-Nardiello-Monitoring-Cloud-Native-applications-with-Prometheus-Codemotion-Milan-2017-36-2048.jpg)


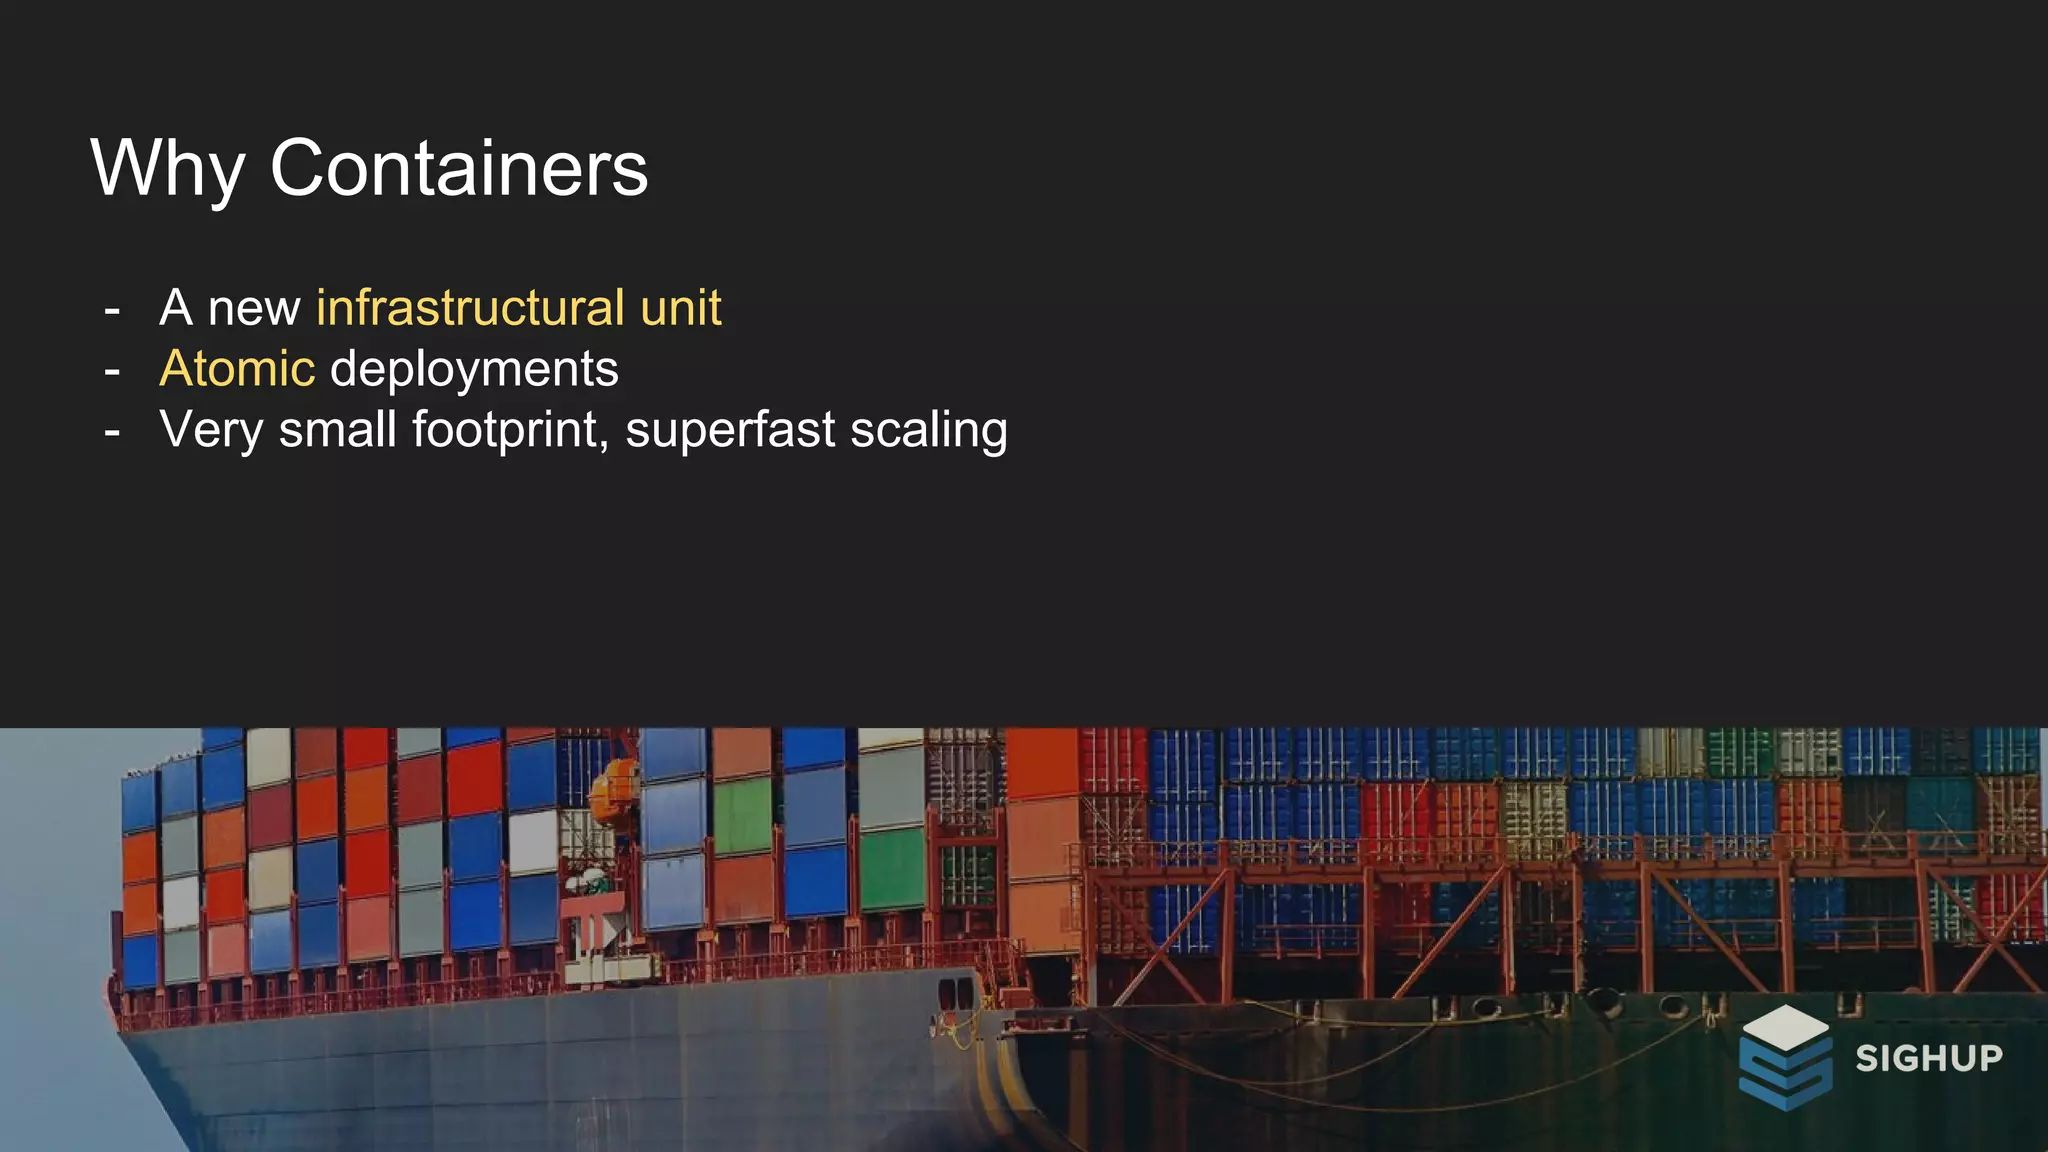
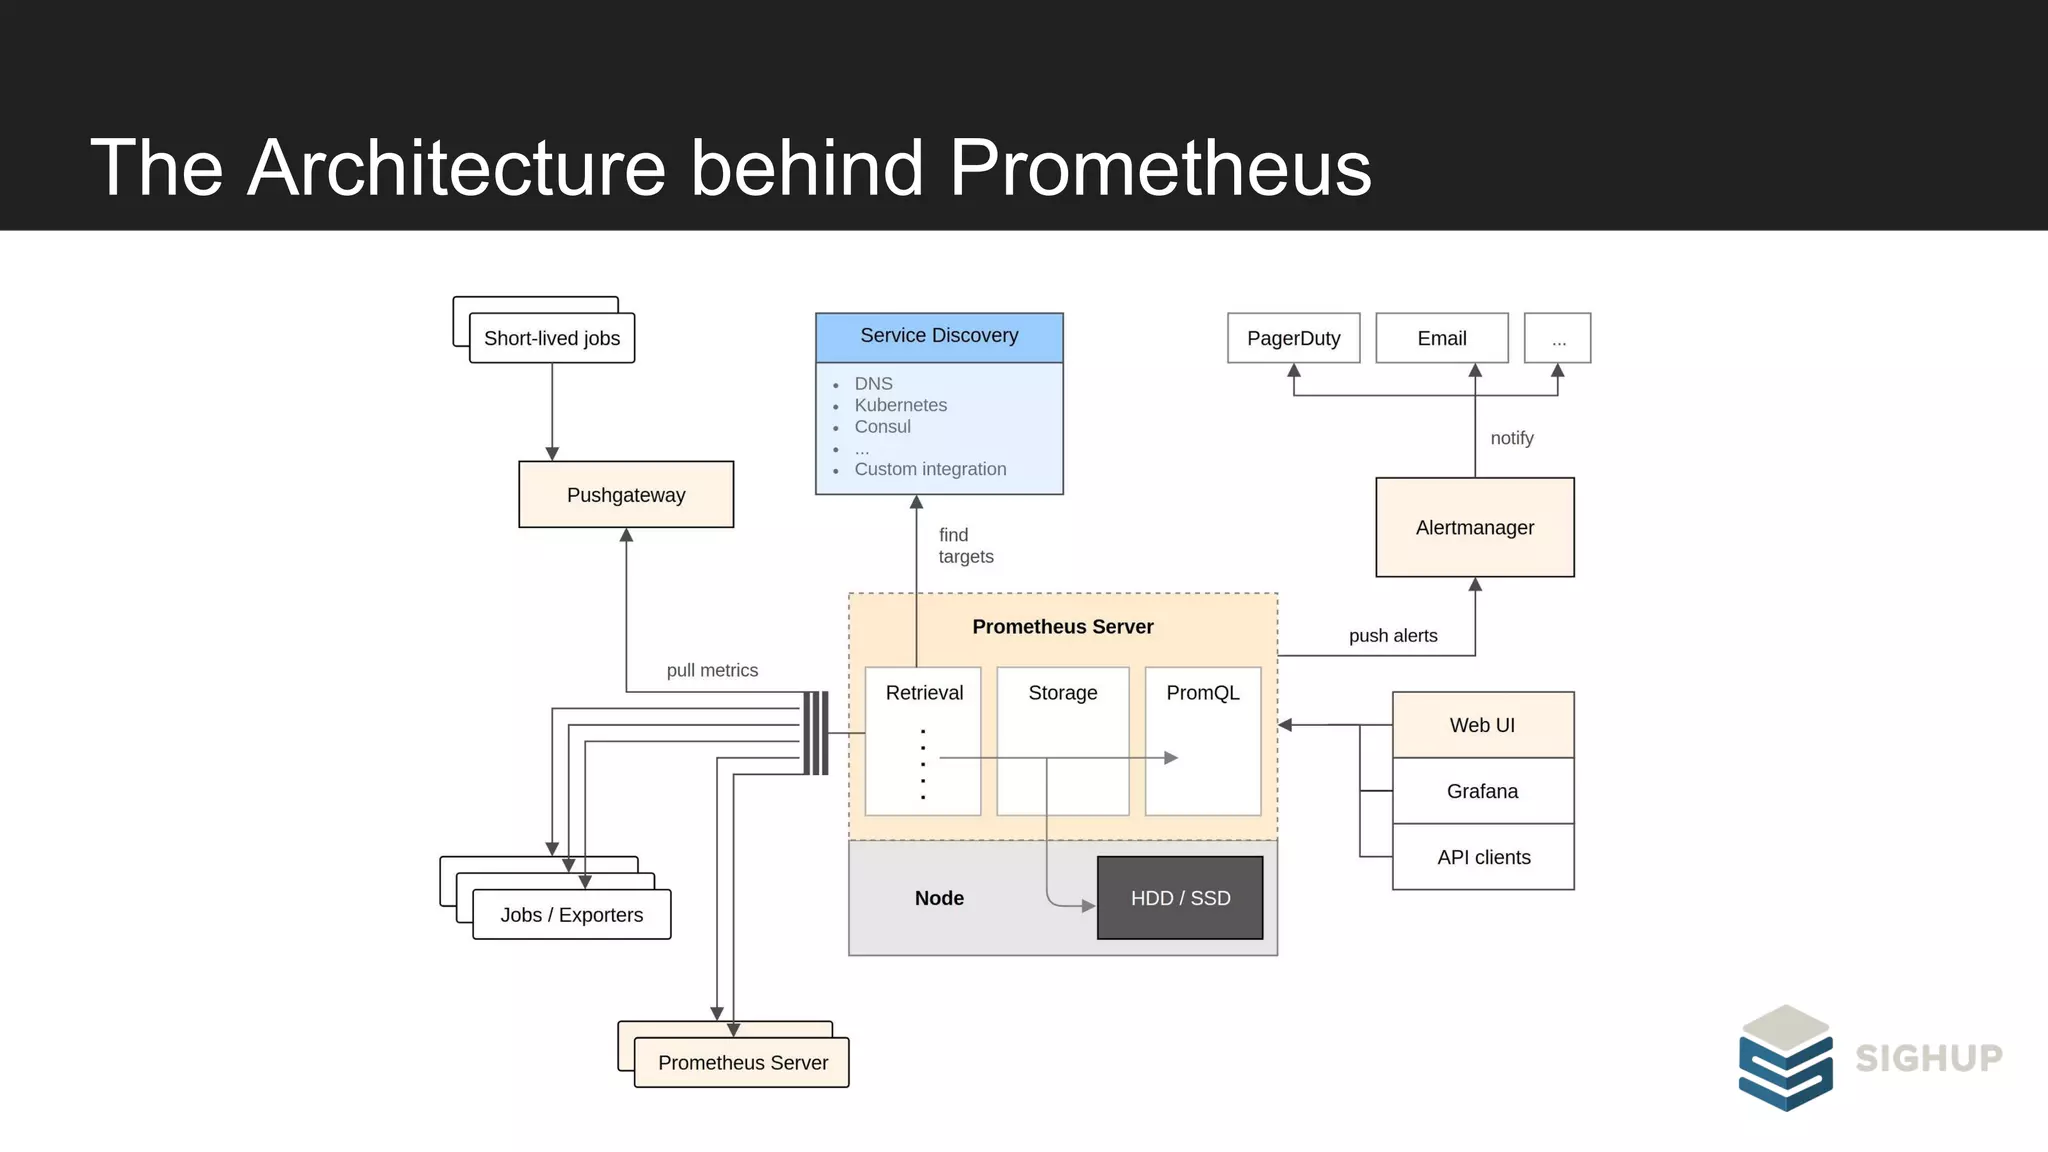
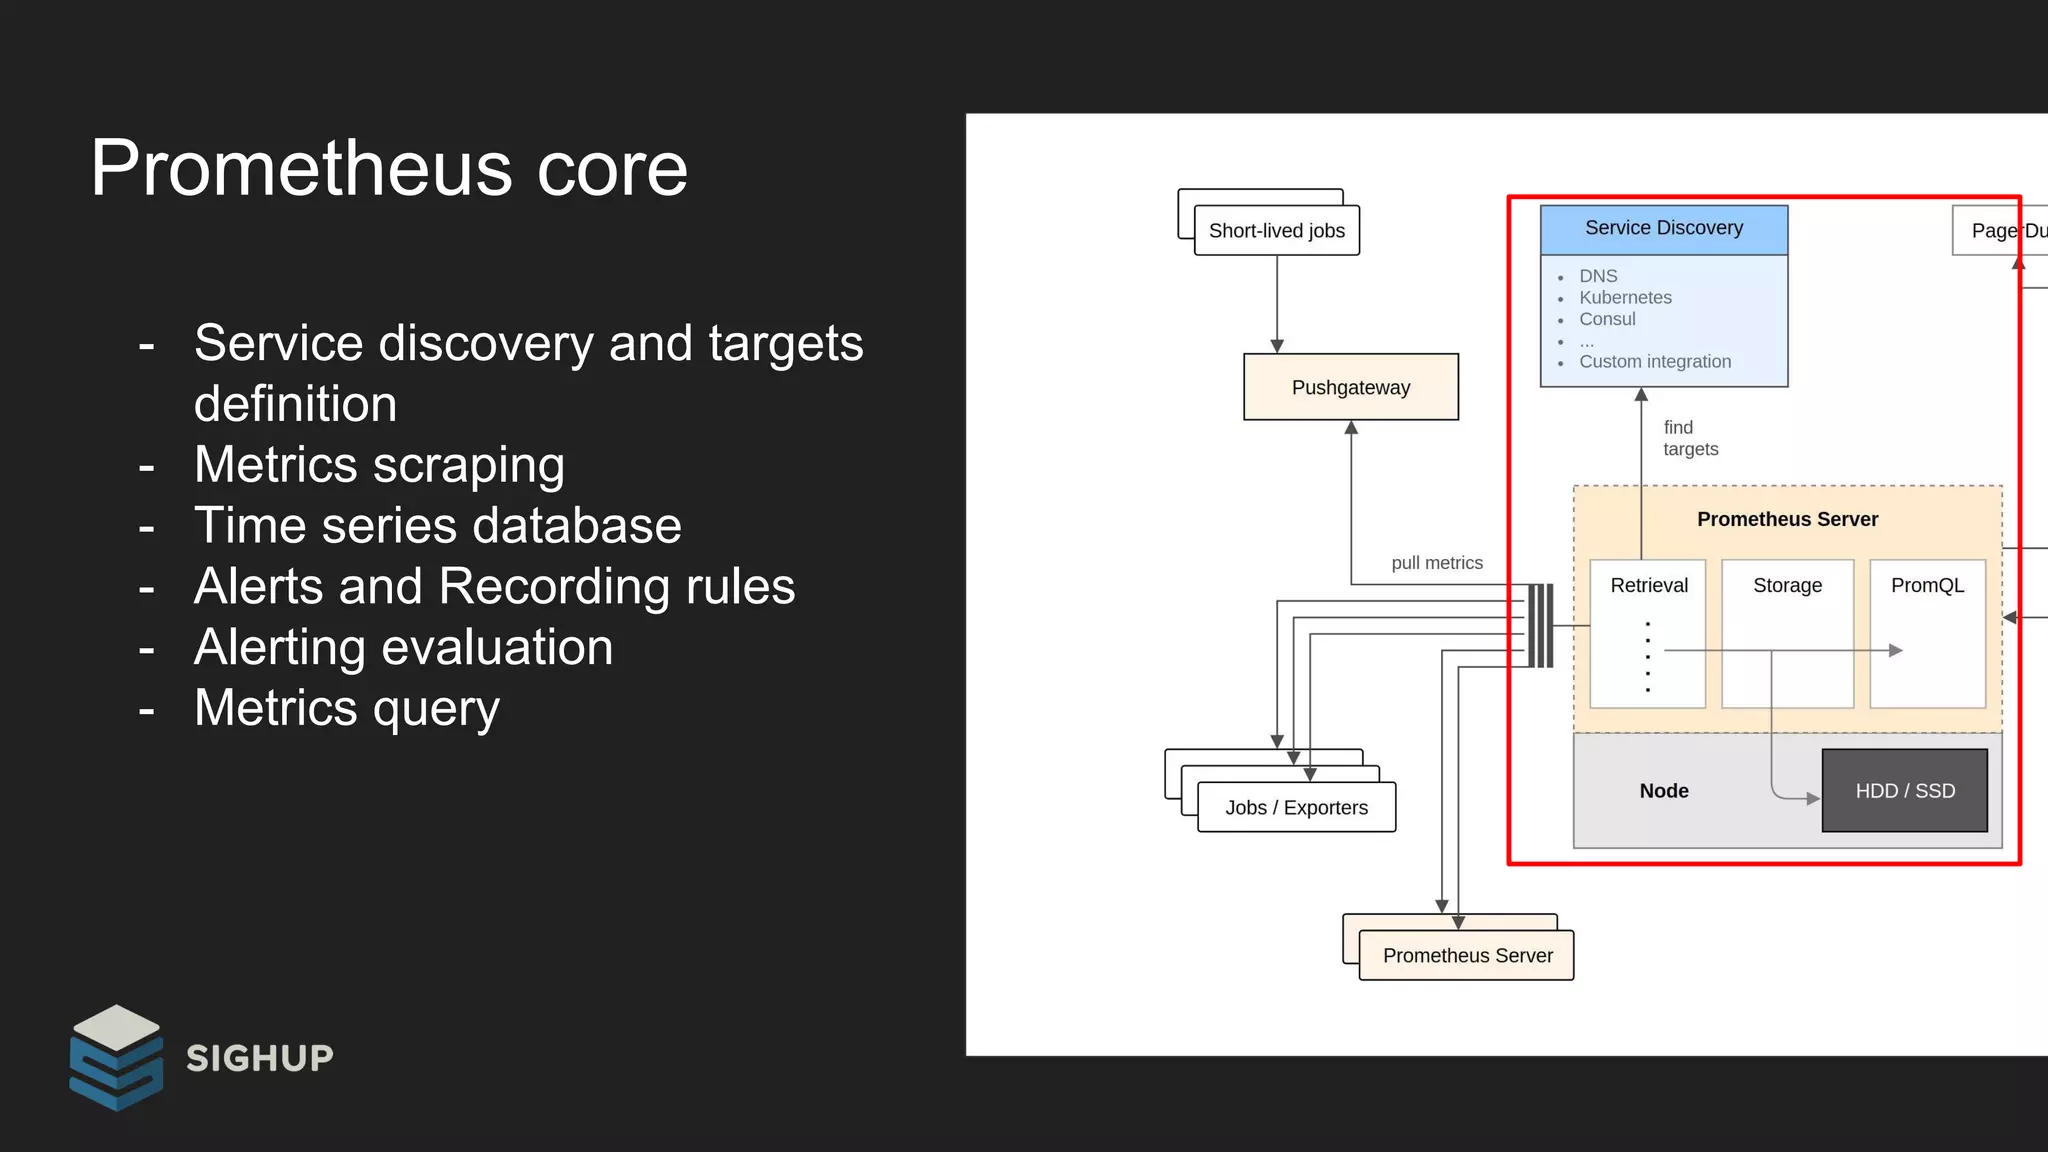
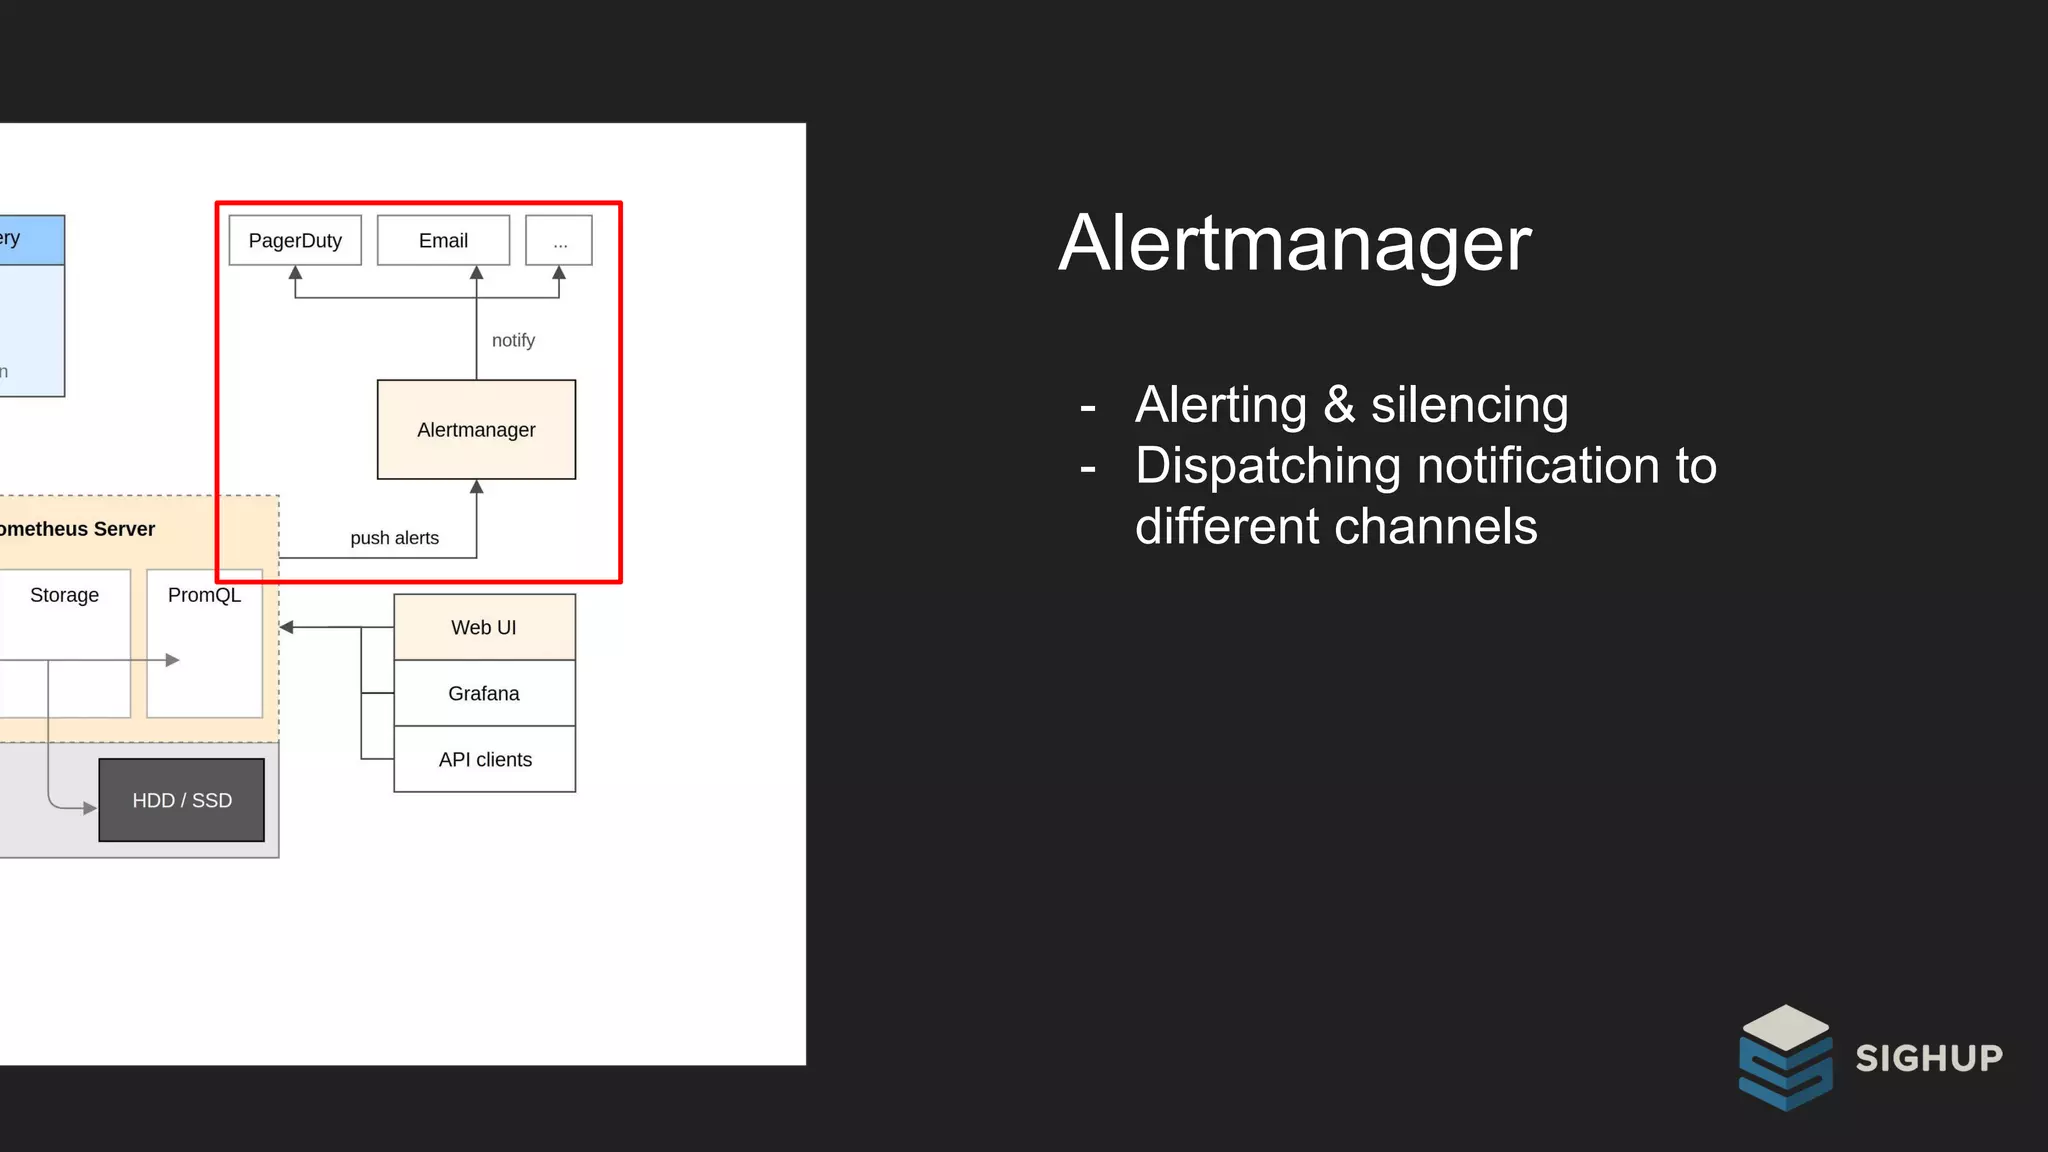
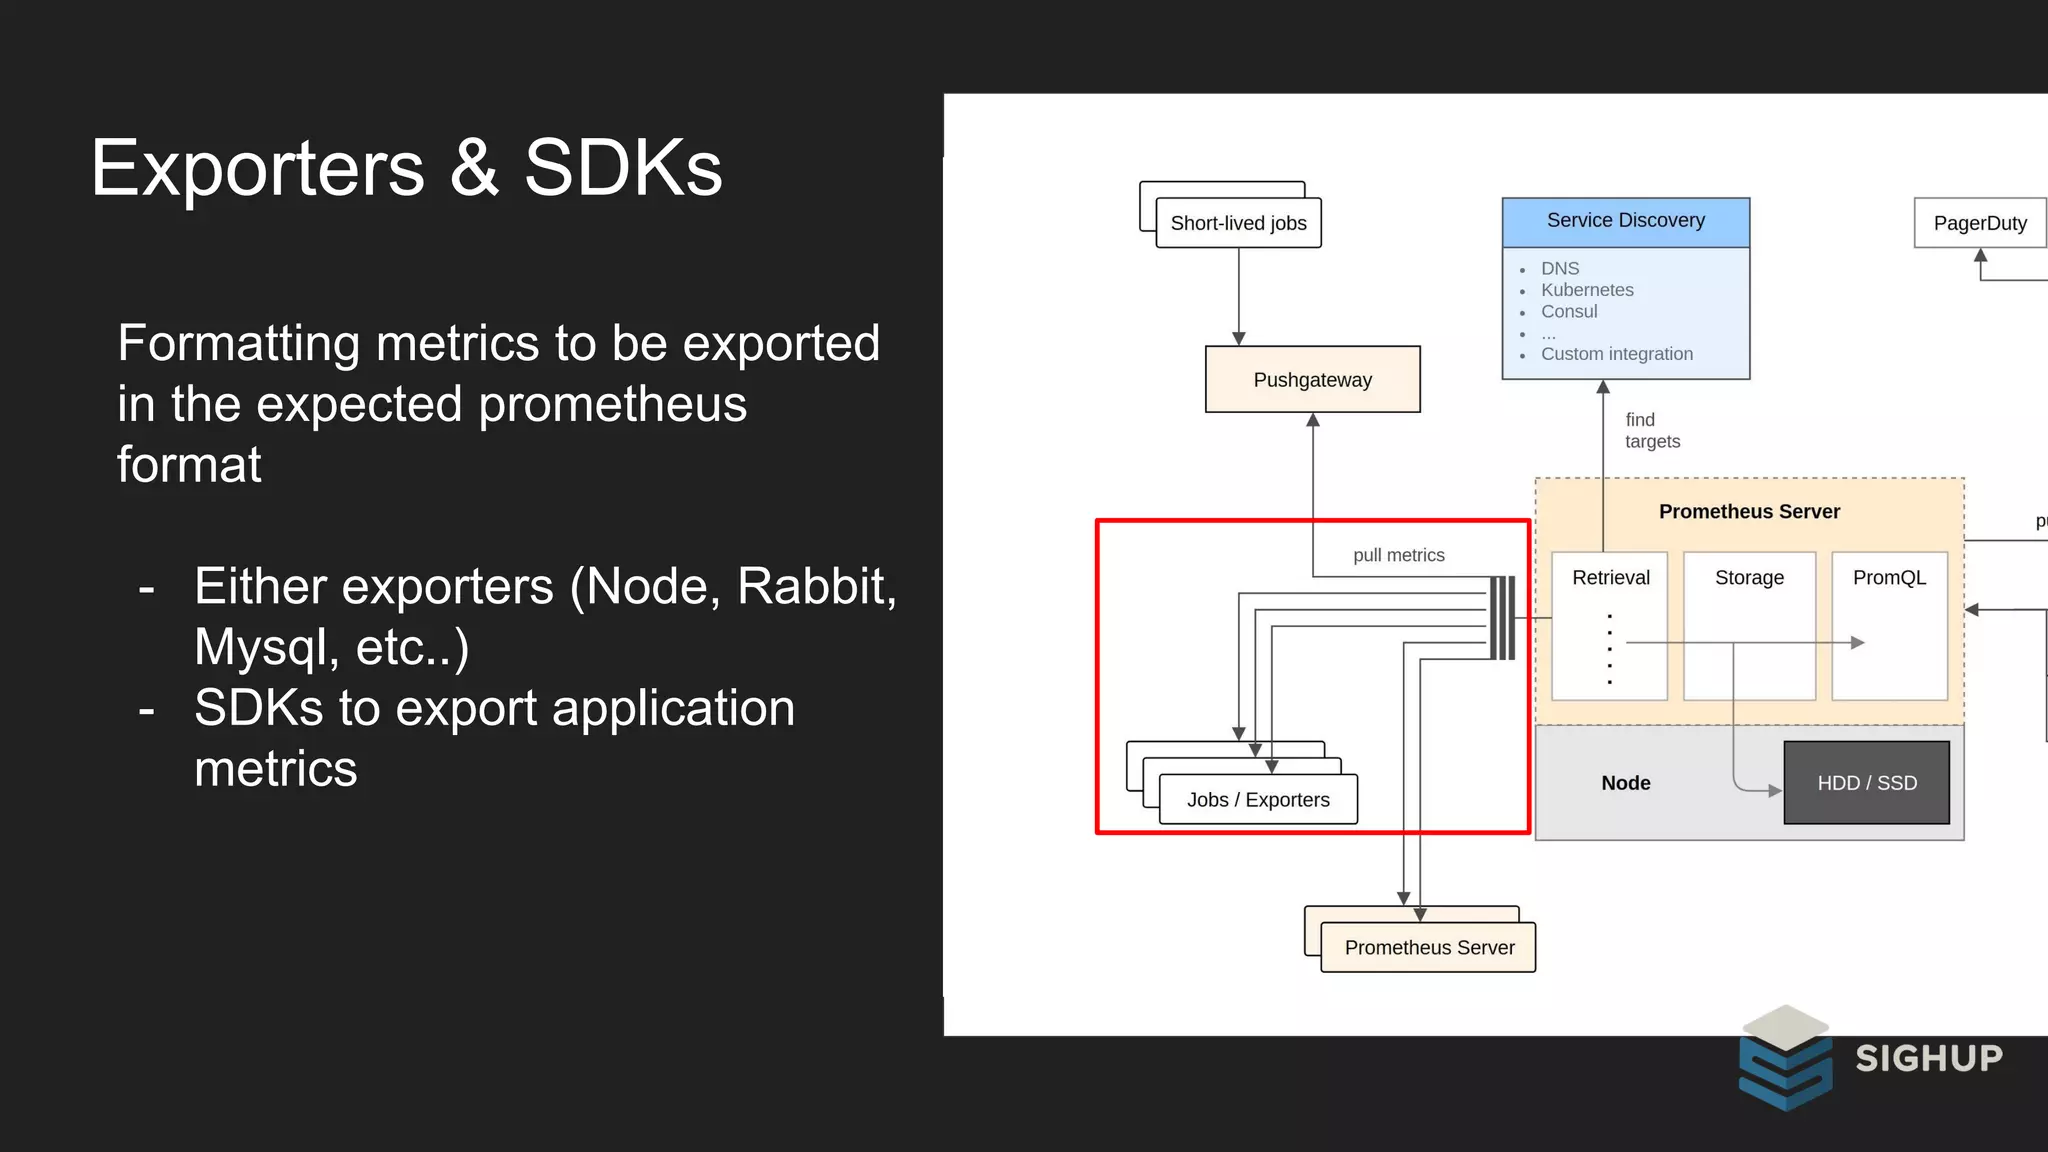
The document discusses monitoring cloud-native applications using Prometheus, highlighting its role as an open-source framework for metrics collection, storage, and alerting. It covers the architecture of Prometheus, its features such as a powerful query language and dynamic service discovery, and emphasizes its integration with Kubernetes for effective monitoring. Additionally, it provides insights into configuring Prometheus, using labels for data aggregation, and setting alerting rules to monitor application performance.


