https://bit.ly/2Cs2ql4
Thank you
Hosted by Sponsored by
Today
● Agentless monitoring with Icinga and Prometheus by Diogo Machado
● Coffee break and networking
Agentless monitoring with Icinga and
Prometheus
Diogo Machado
dgm@eurotux.com
04/11/2019
DevOps Braga #15
Agenda
● From Icinga to Prometheus
● Prometheus Basic Concepts
● Prometheus Server Configuration
● Getting data into Prometheus
● Implement custom metrics
● How to integrate Icinga with Prometheus?
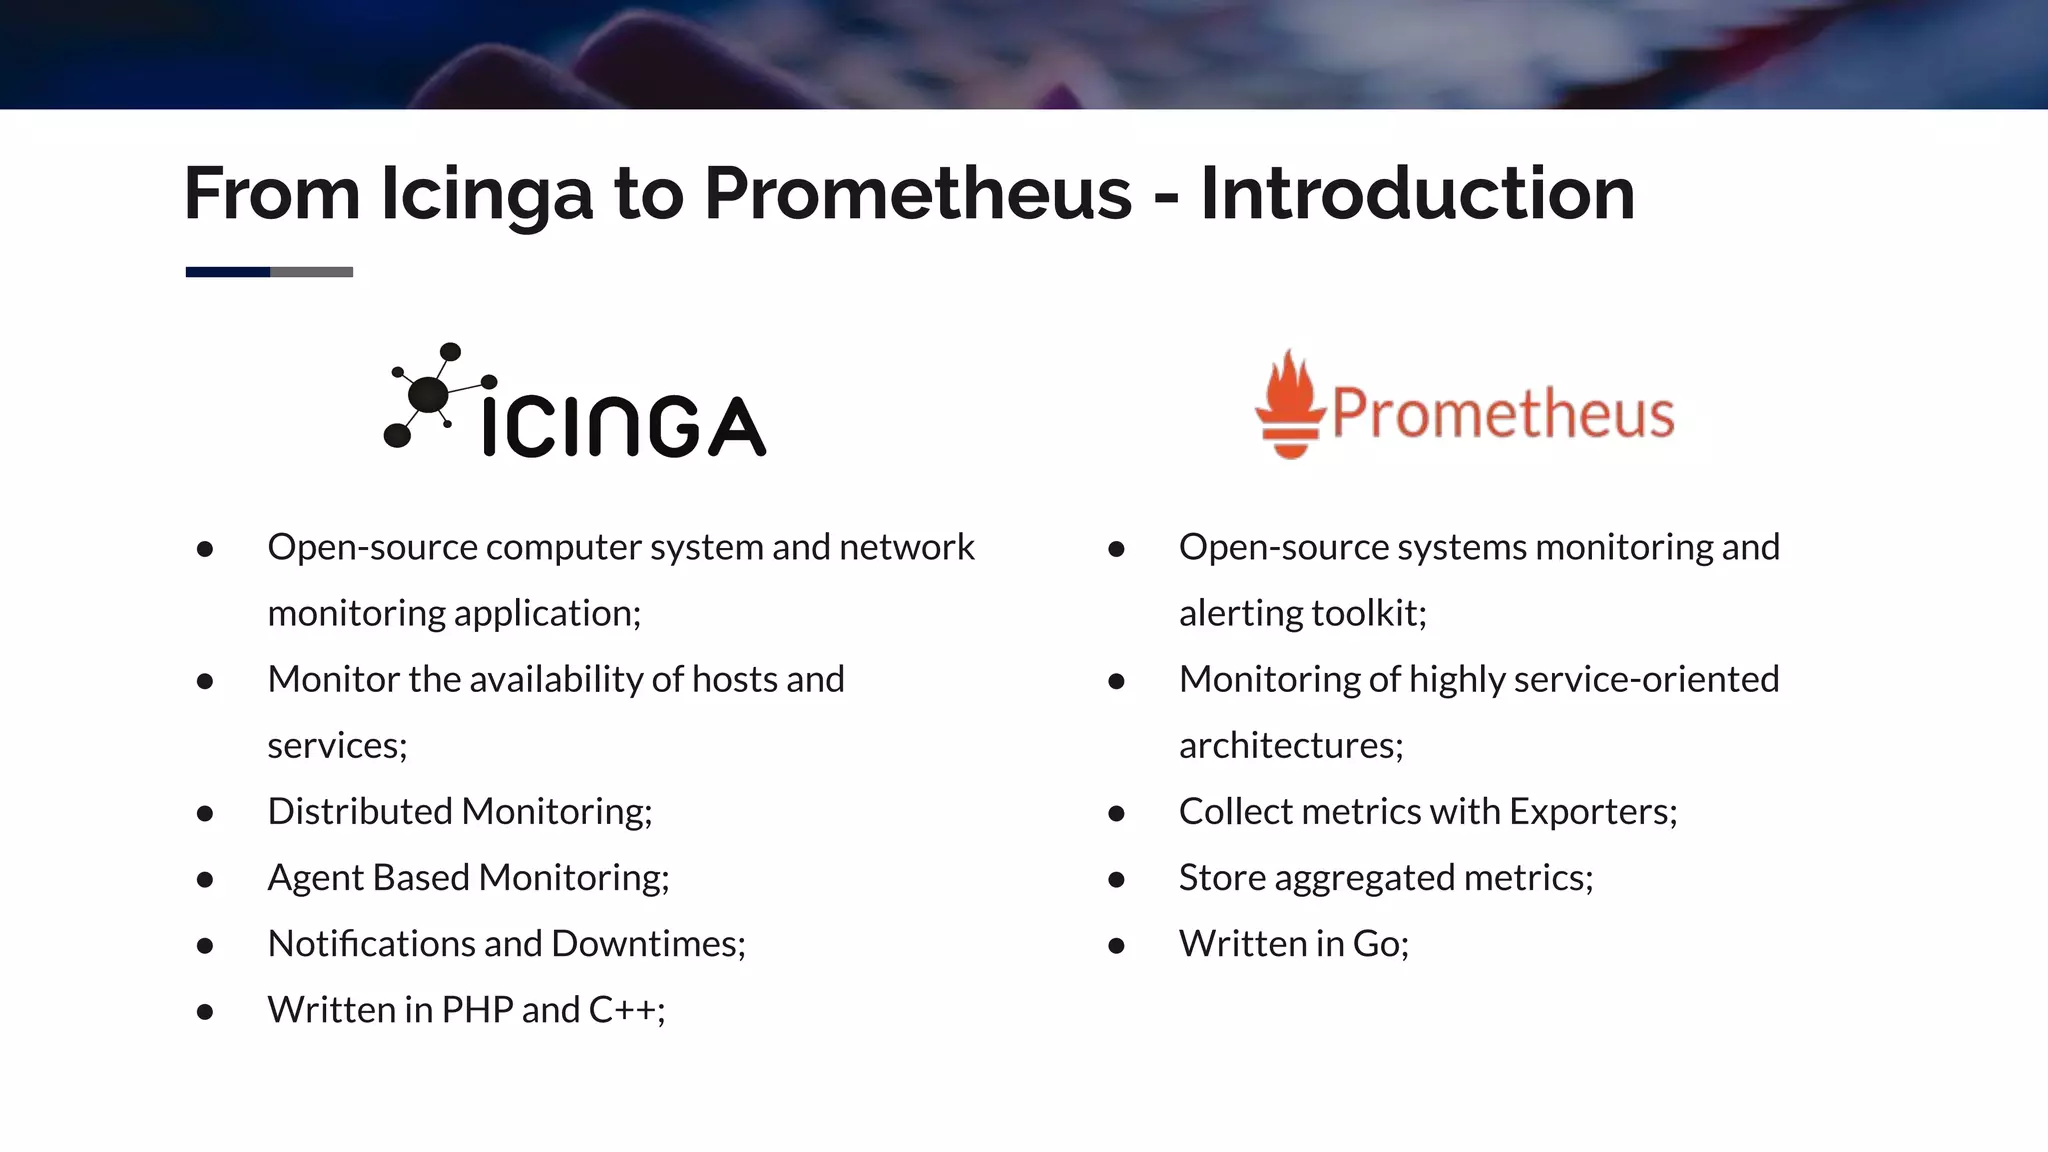
From Icinga to Prometheus - Introduction
● Open-source computer system and network
monitoring application;
● Monitor the availability of hosts and
services;
● Distributed Monitoring;
● Agent Based Monitoring;
● Notifications and Downtimes;
● Written in PHP and C++;
● Open-source systems monitoring and
alerting toolkit;
● Monitoring of highly service-oriented
architectures;
● Collect metrics with Exporters;
● Store aggregated metrics;
● Written in Go;
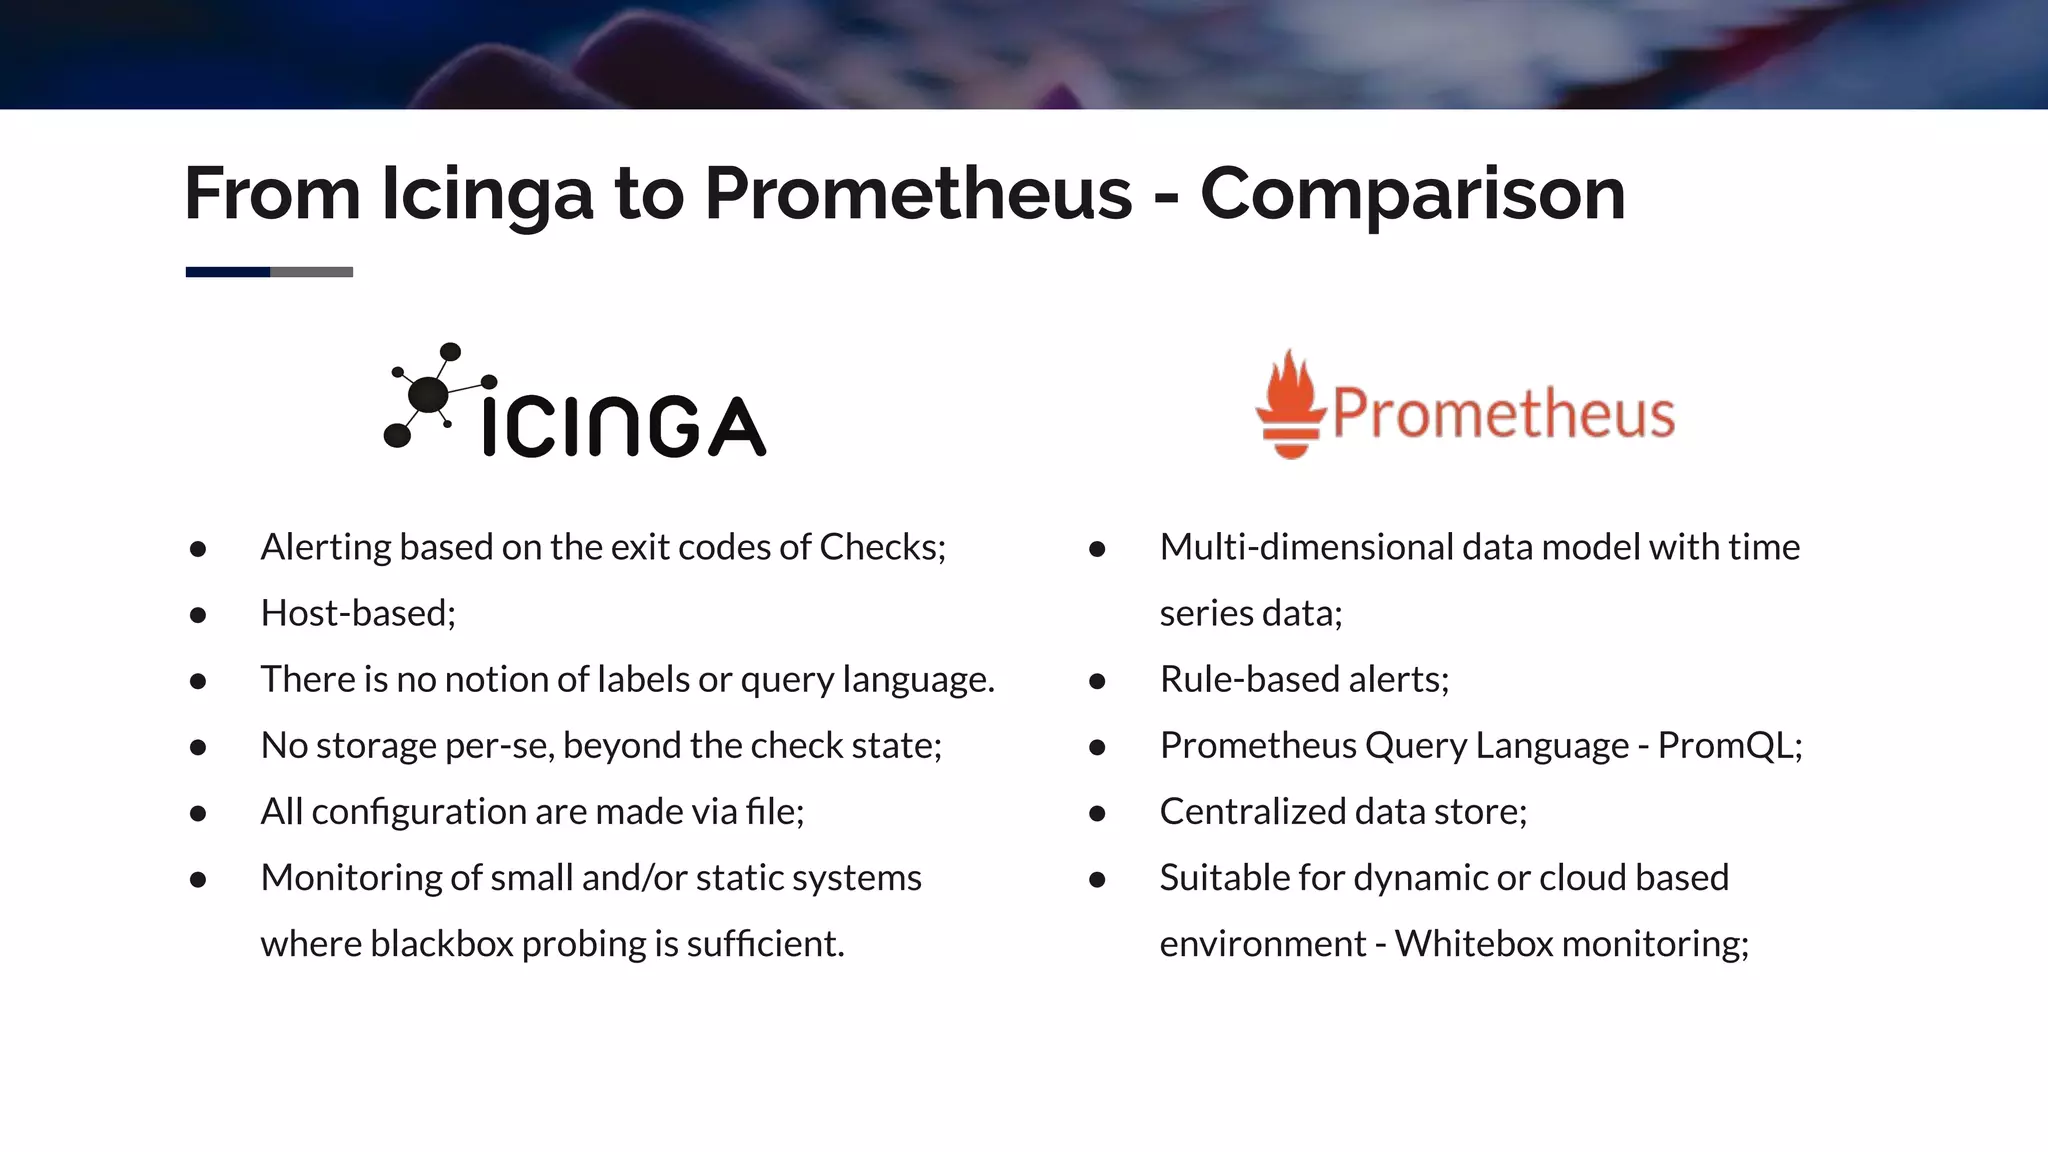
From Icinga to Prometheus - Comparison
● Alerting based on the exit codes of Checks;
● Host-based;
● There is no notion of labels or query language.
● No storage per-se, beyond the check state;
● All configuration are made via file;
● Monitoring of small and/or static systems
where blackbox probing is sufficient.
● Multi-dimensional data model with time
series data;
● Rule-based alerts;
● Prometheus Query Language - PromQL;
● Centralized data store;
● Suitable for dynamic or cloud based
environment - Whitebox monitoring;
From Icinga to Prometheus - Comparison
If there are both to system monitoring….
Why not choose only one?
What does Prometheus have that Icinga doesn't have?
Why should we combine both?
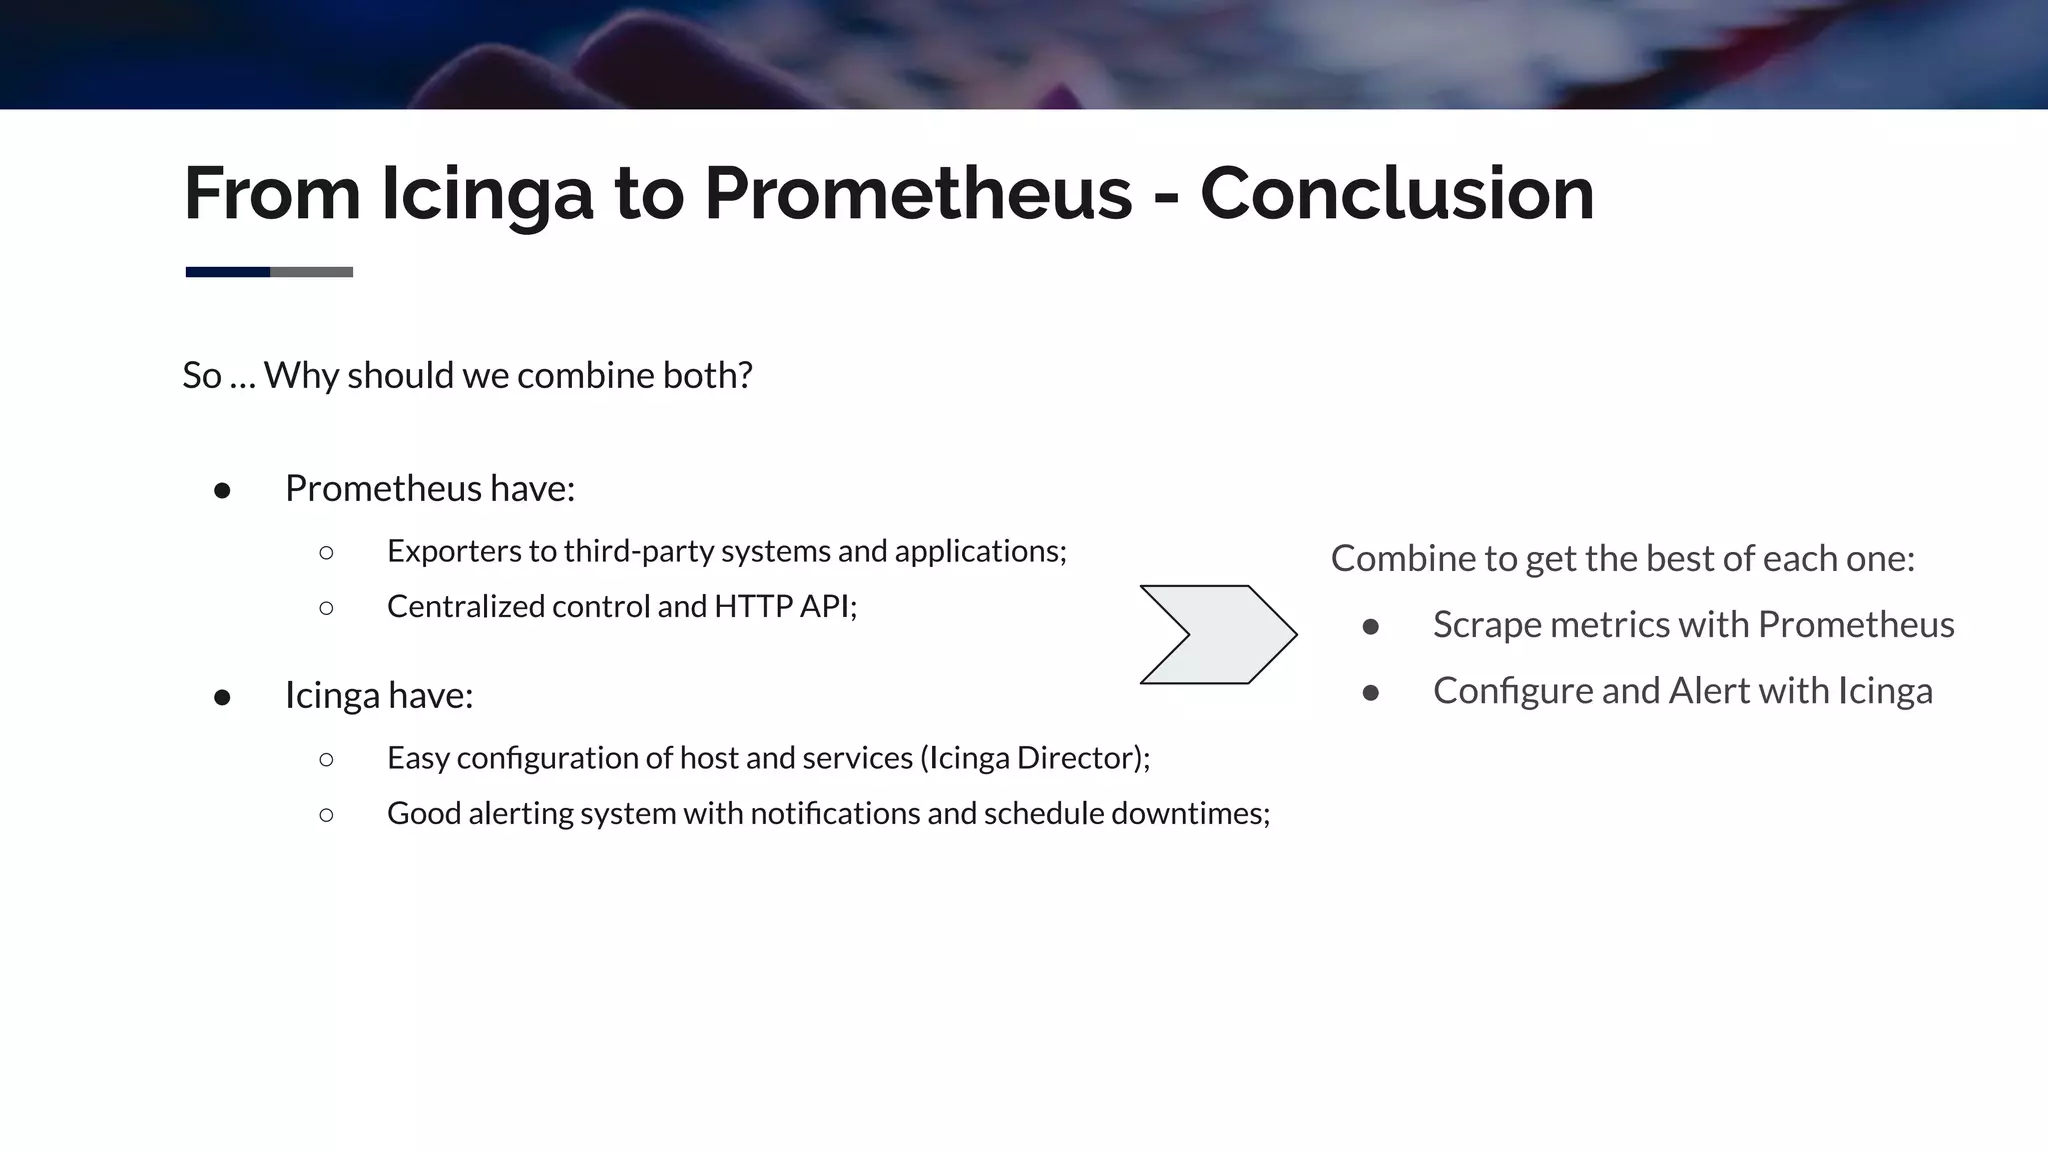
From Icinga to Prometheus - Conclusion
So … Why should we combine both?
● Prometheus have:
○ Exporters to third-party systems and applications;
○ Centralized control and HTTP API;
● Icinga have:
○ Easy configuration of host and services (Icinga Director);
○ Good alerting system with notifications and schedule downtimes;
Combine to get the best of each one:
● Scrape metrics with Prometheus
● Configure and Alert with Icinga
Prometheus's main features are:
● multi-dimensional data model with time series data identified by metric name and key/value pairs;
● PromQL, a flexible query language to leverage this dimensionality;
● no reliance on distributed storage - single server nodes are autonomous;
● time series collection happens via a pull model over HTTP;
● pushing time series is supported via an intermediary gateway;
● targets are discovered via service discovery or static configuration;
● support for graph and dashboard mode.
Prometheus Basic Concepts
Prometheus Basic Concepts - Architecture
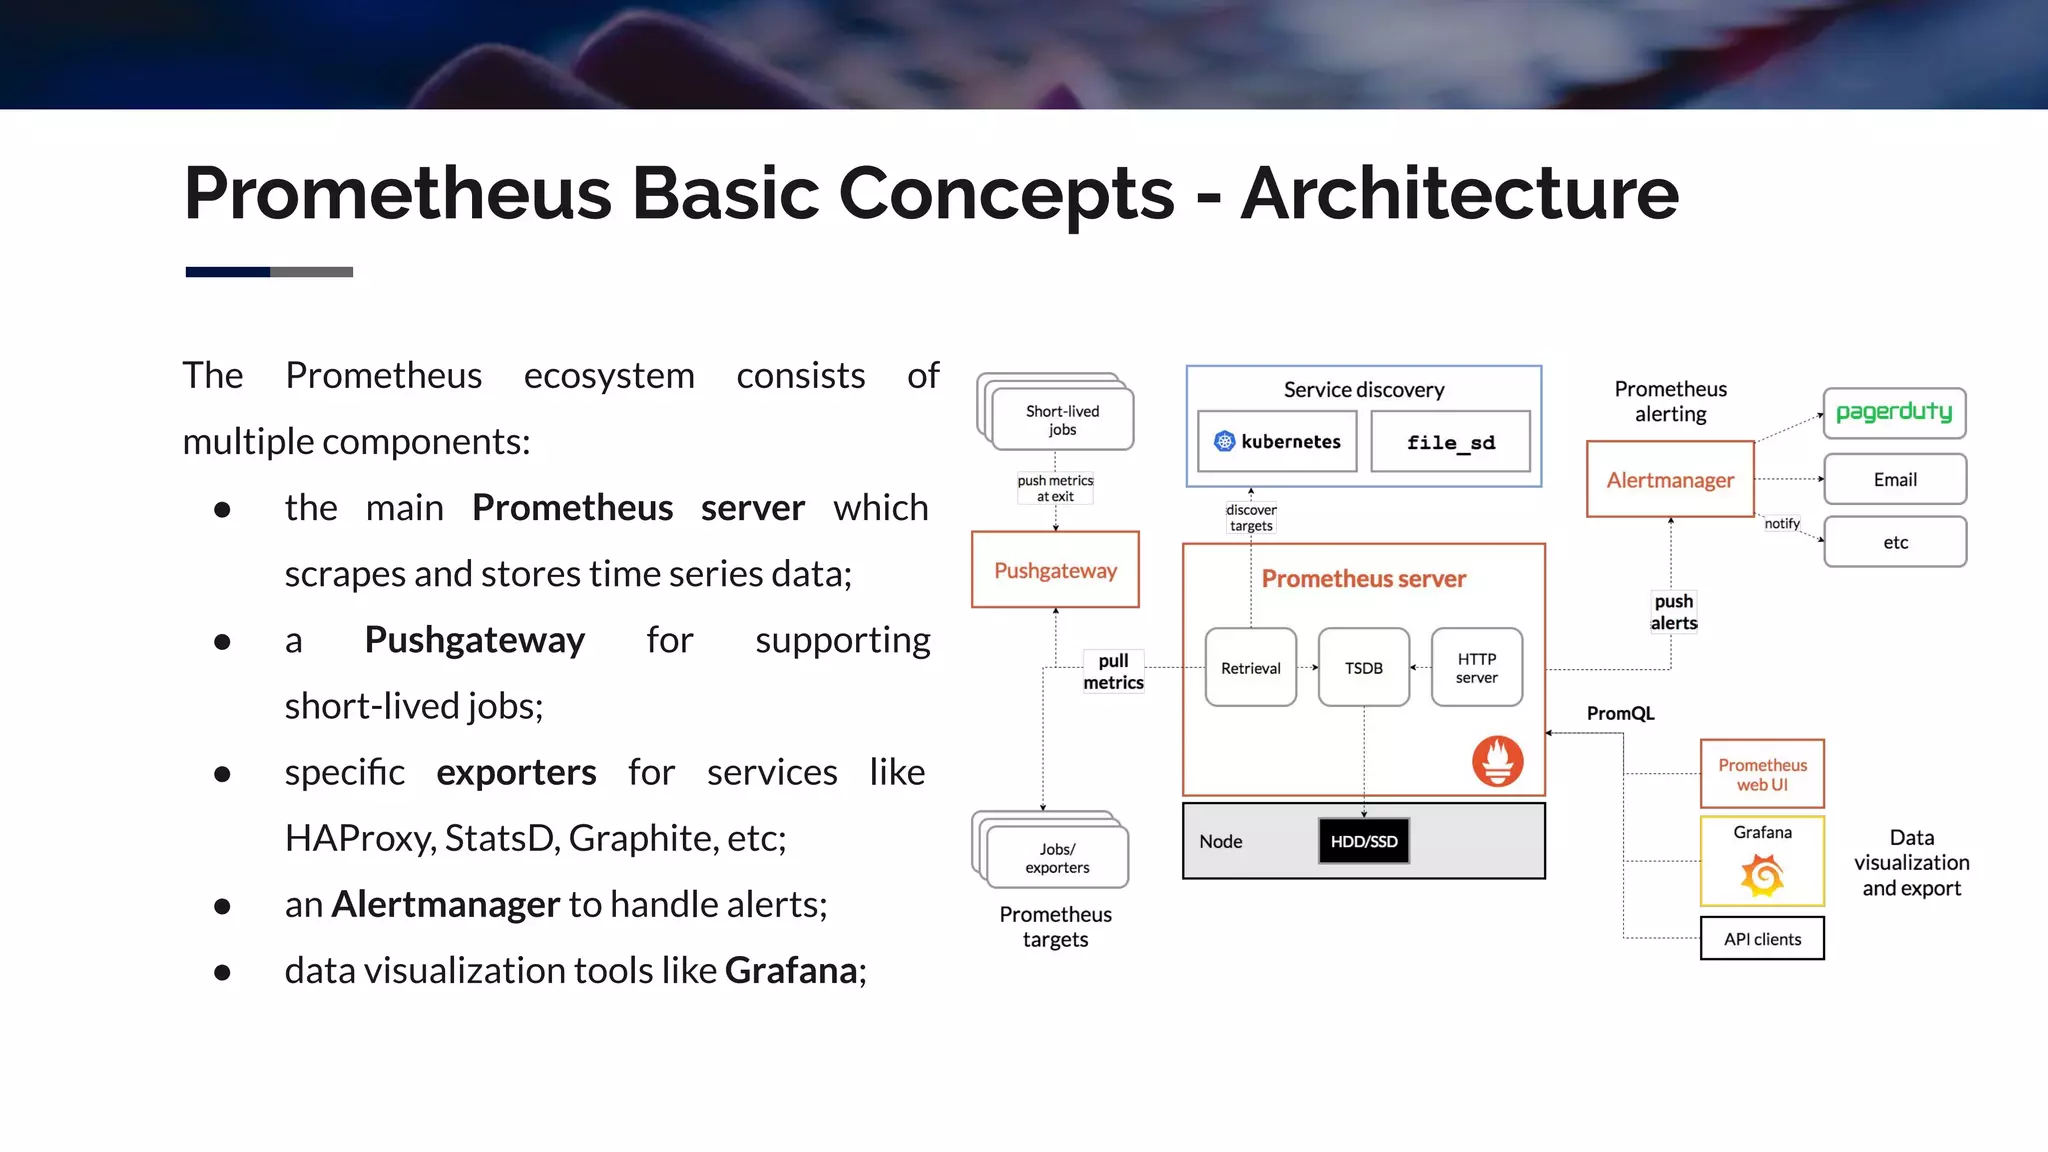
The Prometheus ecosystem consists of
multiple components:
● the main Prometheus server which
scrapes and stores time series data;
● a Pushgateway for supporting
short-lived jobs;
● specific exporters for services like
HAProxy, StatsD, Graphite, etc;
● an Alertmanager to handle alerts;
● data visualization tools like Grafana;
Prometheus Basic Concepts - Data Model
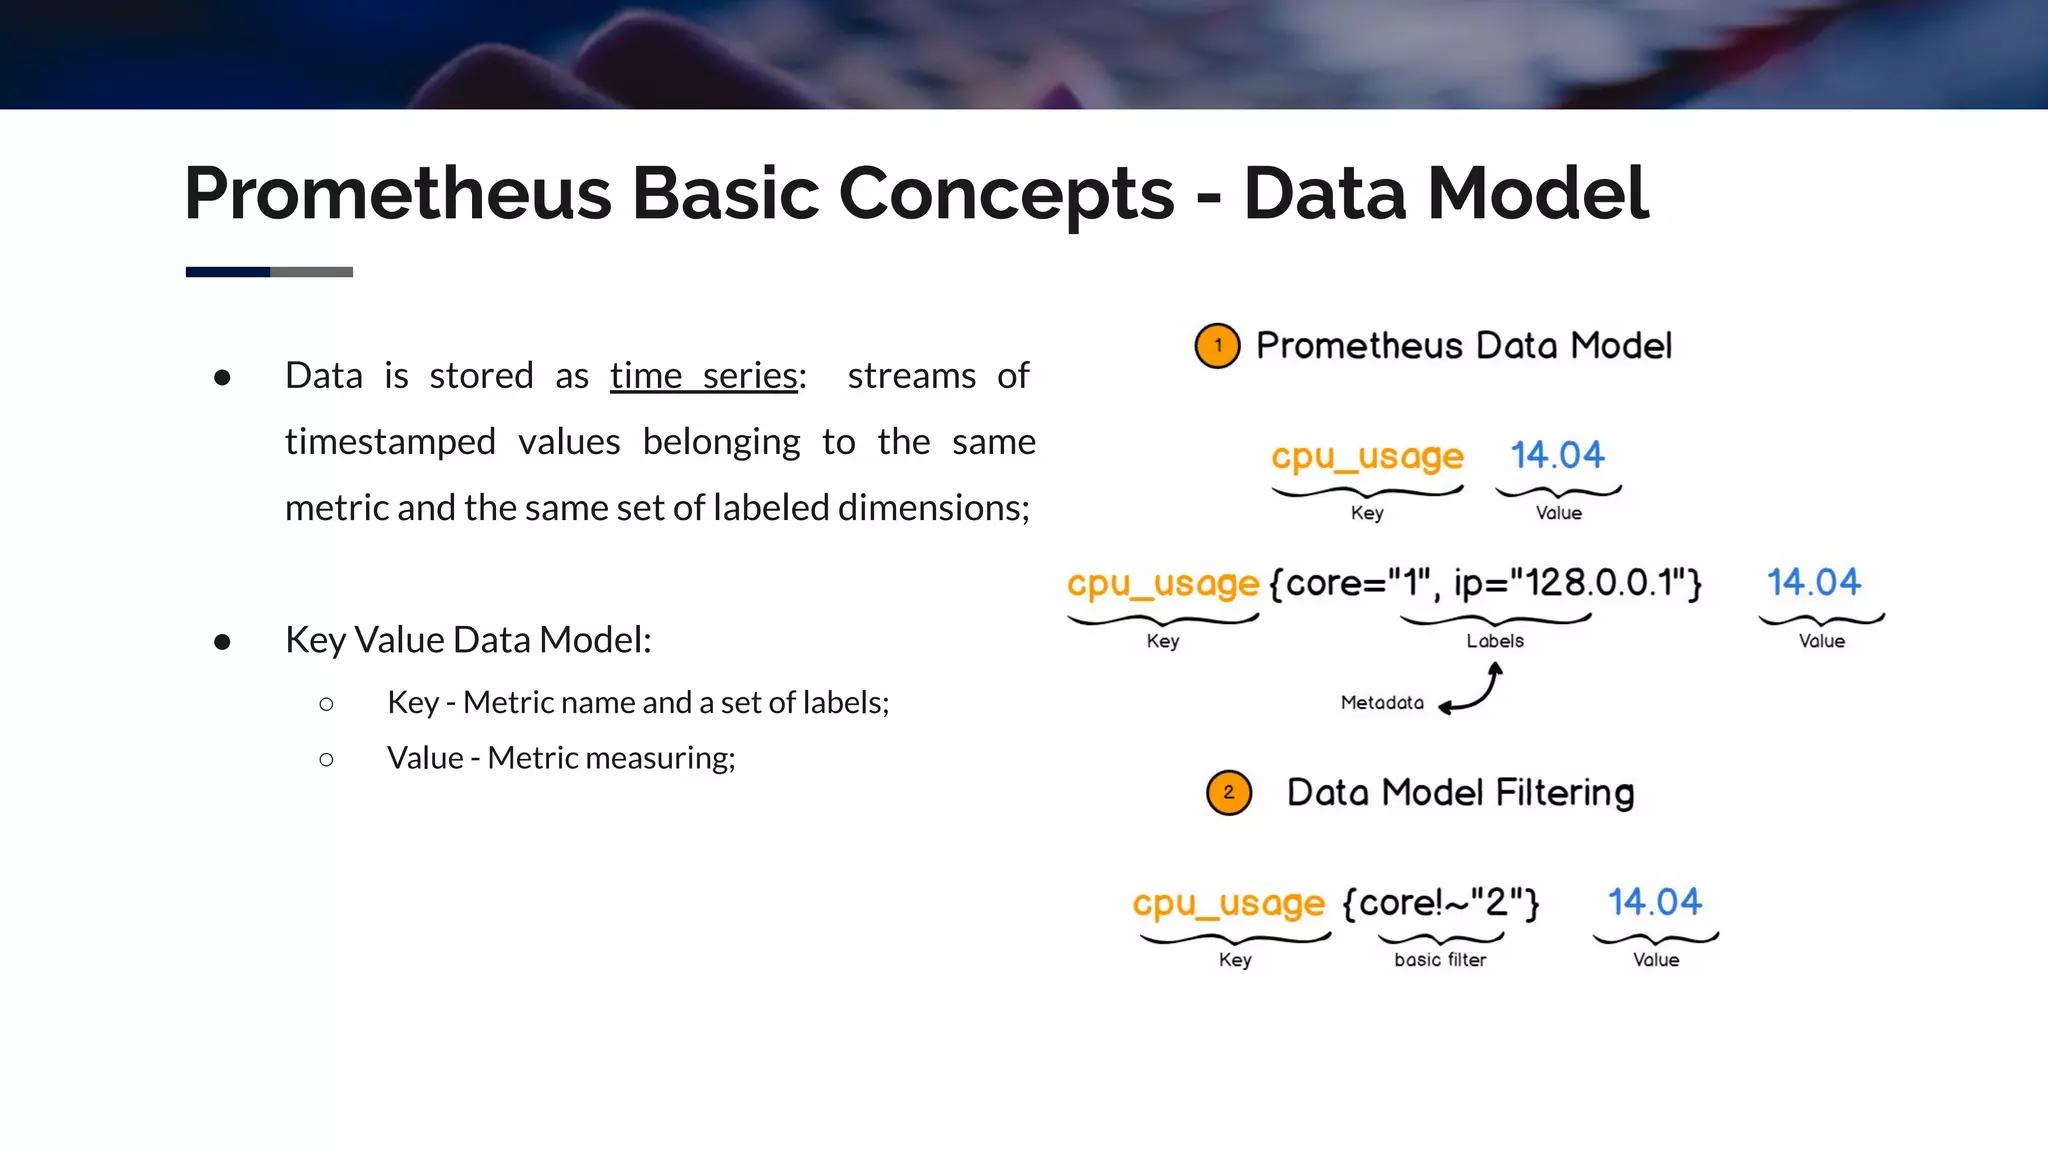
● Data is stored as time series: streams of
timestamped values belonging to the same
metric and the same set of labeled dimensions;
● Key Value Data Model:
○ Key - Metric name and a set of labels;
○ Value - Metric measuring;
Prometheus Basic Concepts - Metric Types
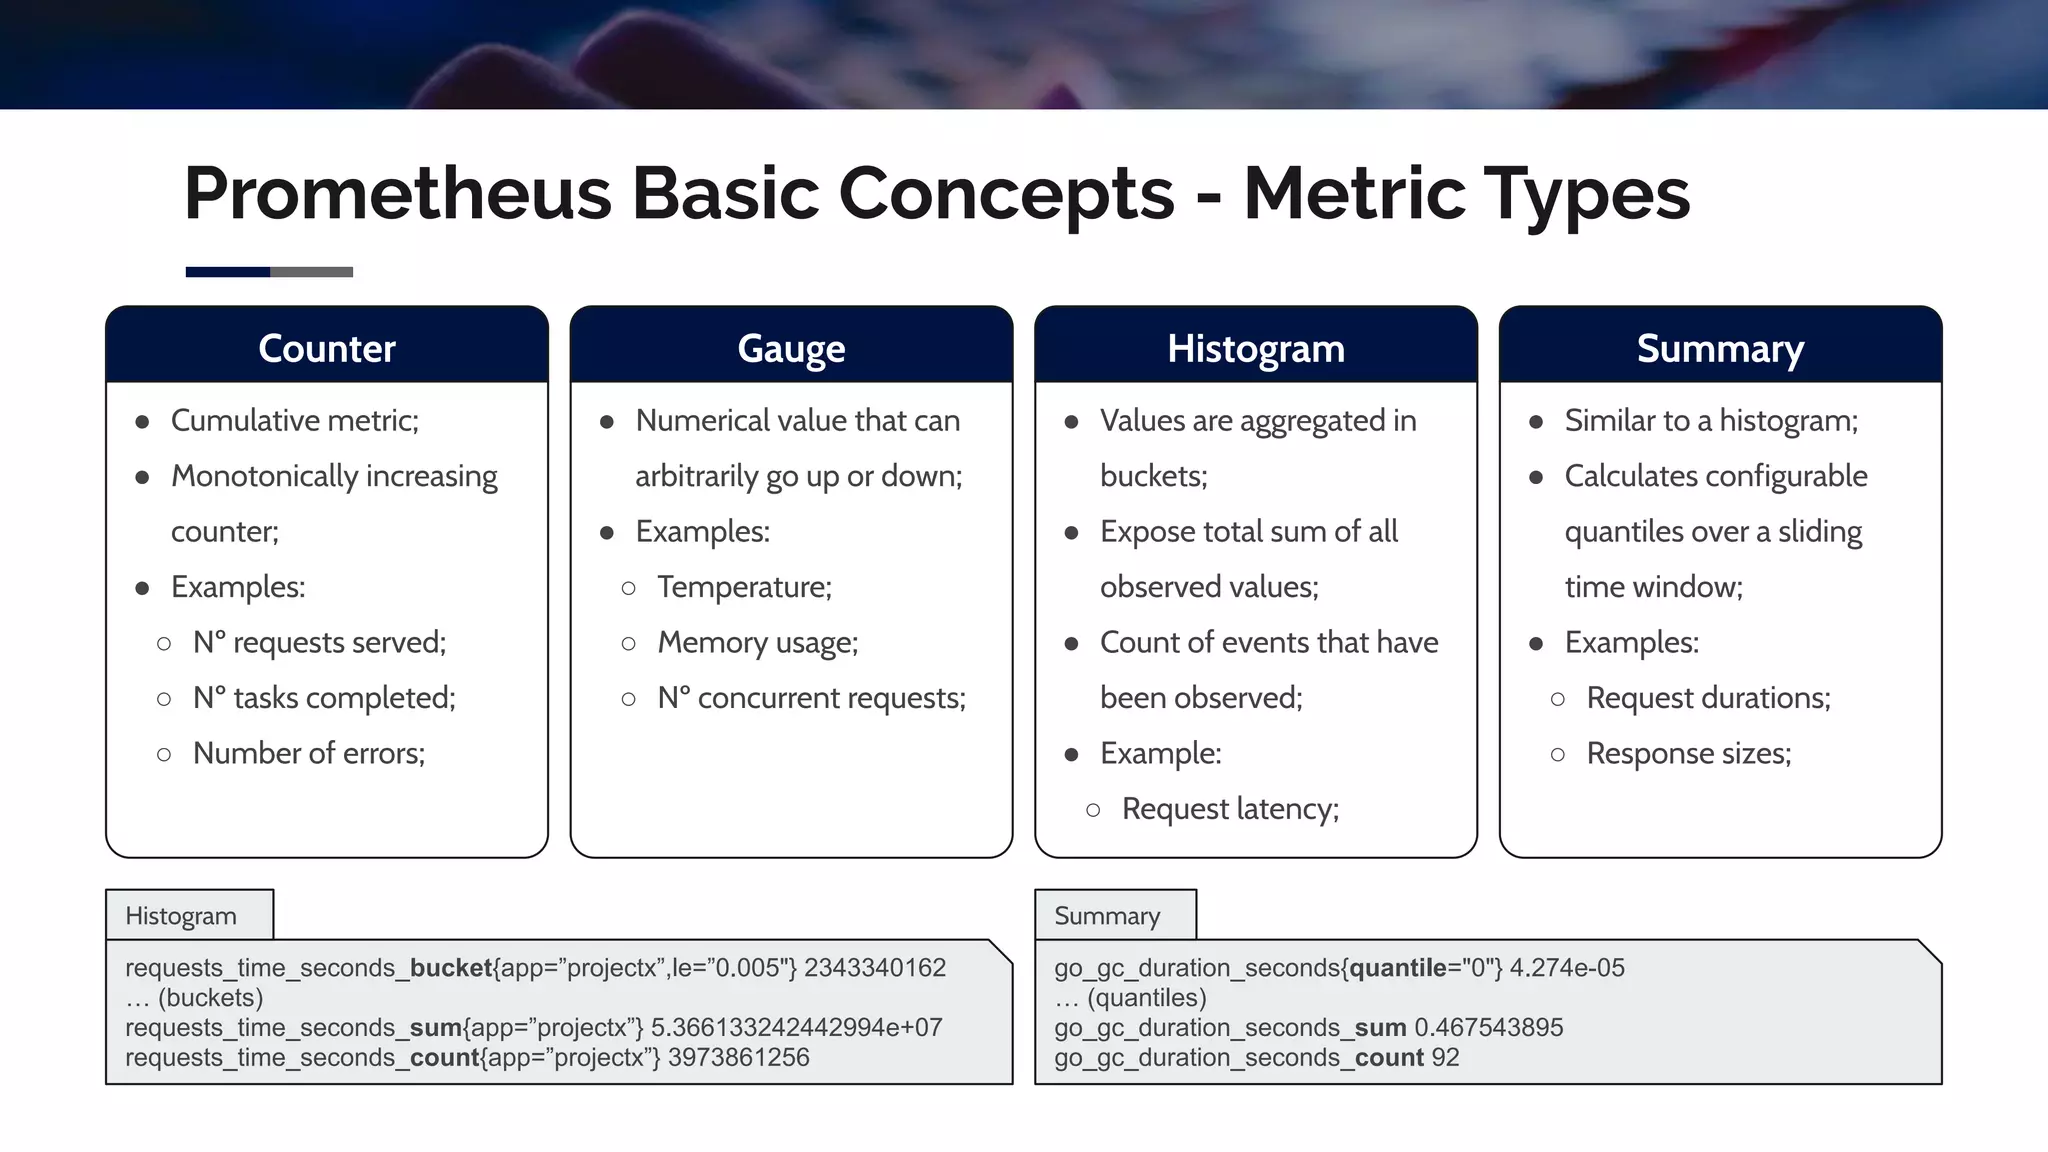
Counter
● Cumulative metric;
● Monotonically increasing
counter;
● Examples:
○ Nº requests served;
○ Nº tasks completed;
○ Number of errors;
Gauge
● Numerical value that can
arbitrarily go up or down;
● Examples:
○ Temperature;
○ Memory usage;
○ Nº concurrent requests;
Histogram
● Values are aggregated in
buckets;
● Expose total sum of all
observed values;
● Count of events that have
been observed;
● Example:
○ Request latency;
Summary
● Similar to a histogram;
● Calculates configurable
quantiles over a sliding
time window;
● Examples:
○ Request durations;
○ Response sizes;
requests_time_seconds_bucket{app=”projectx”,le=”0.005"} 2343340162
… (buckets)
requests_time_seconds_sum{app=”projectx”} 5.366133242442994e+07
requests_time_seconds_count{app=”projectx”} 3973861256
go_gc_duration_seconds{quantile="0"} 4.274e-05
… (quantiles)
go_gc_duration_seconds_sum 0.467543895
go_gc_duration_seconds_count 92
Histogram Summary
Prometheus Basic Concepts - Jobs and Instances
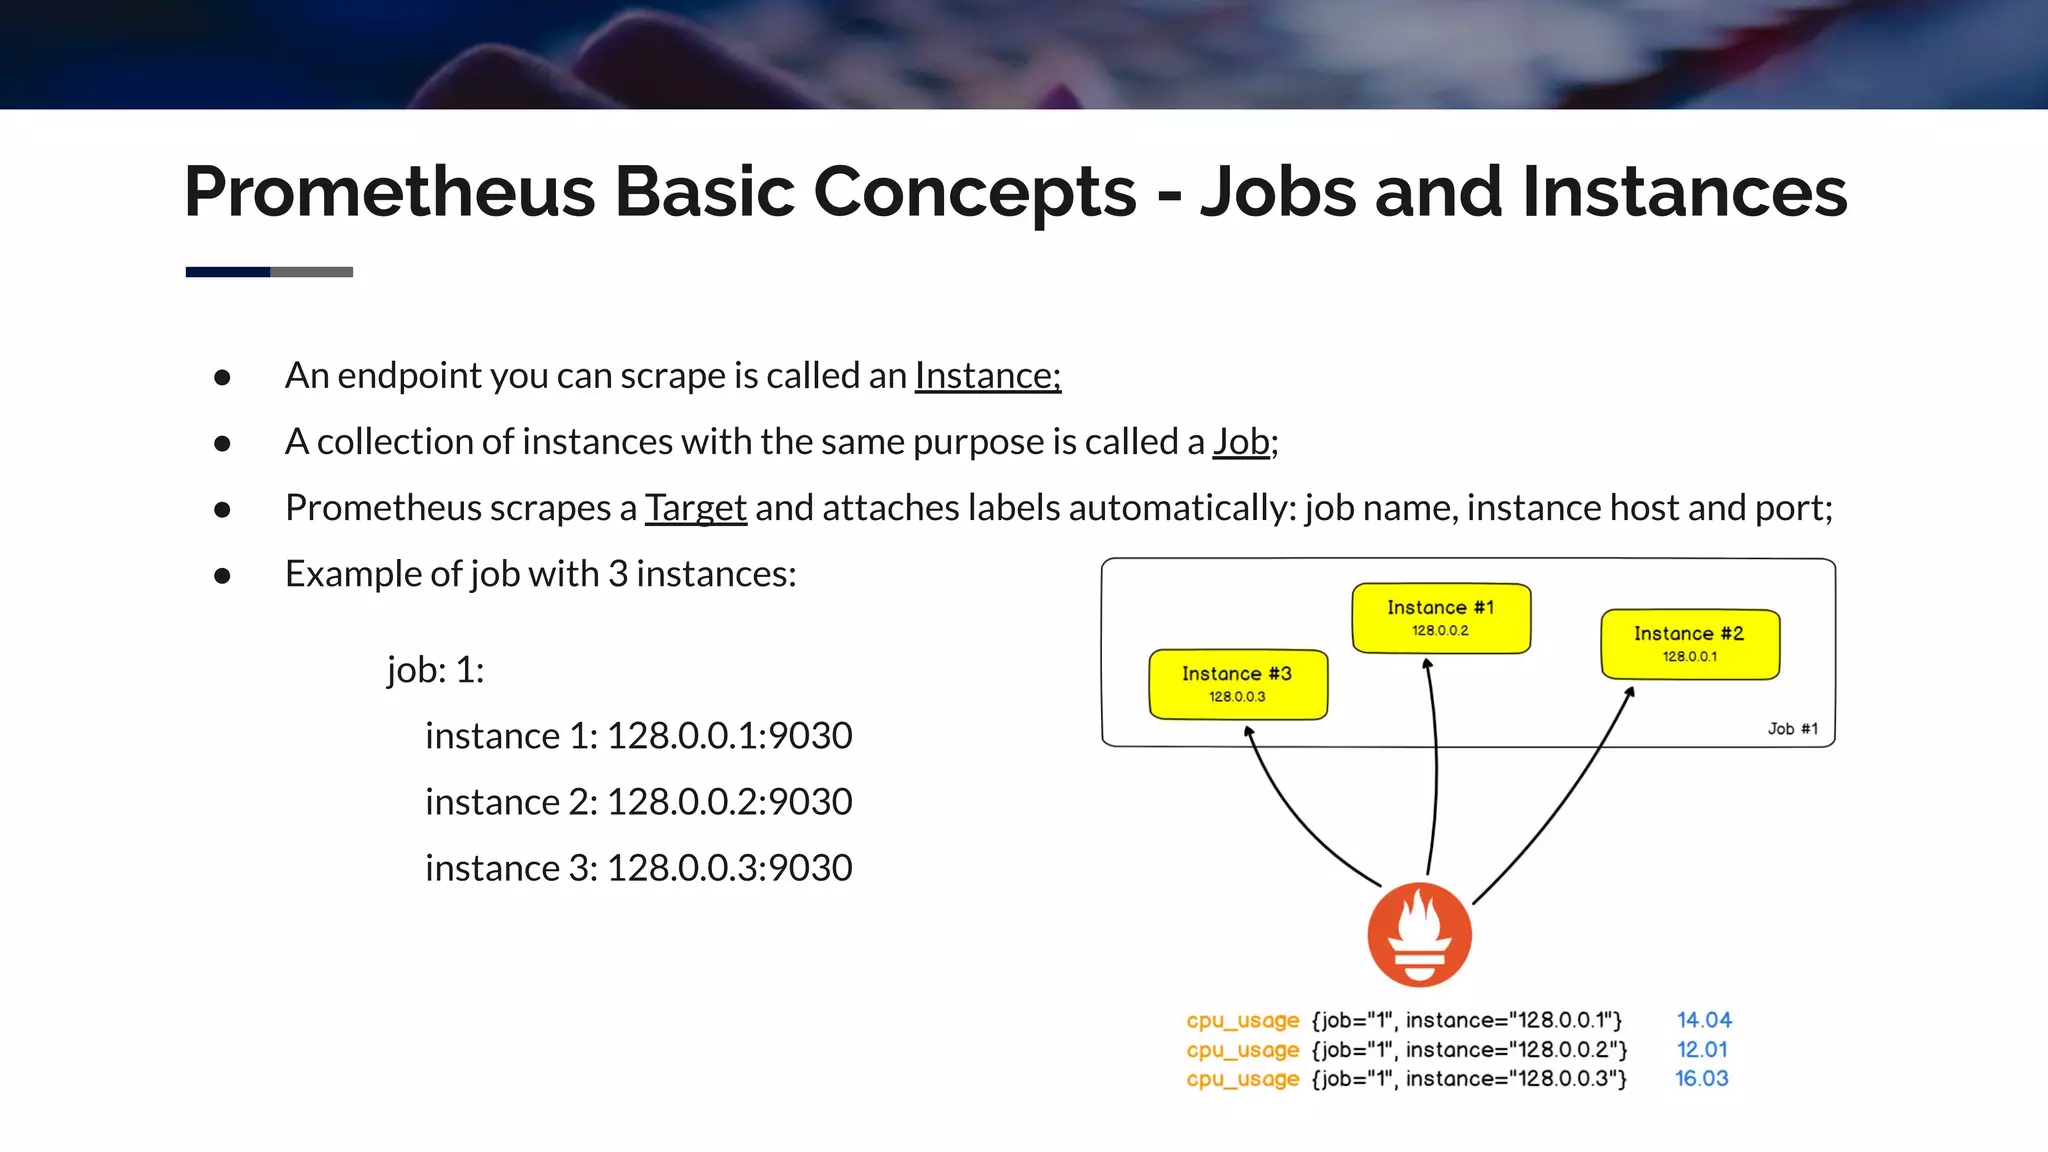
● An endpoint you can scrape is called an Instance;
● A collection of instances with the same purpose is called a Job;
● Prometheus scrapes a Target and attaches labels automatically: job name, instance host and port;
● Example of job with 3 instances:
job: 1:
instance 1: 128.0.0.1:9030
instance 2: 128.0.0.2:9030
instance 3: 128.0.0.3:9030
Prometheus Basic Concepts - PromQL
Expression language data types:
● Instant vector - a set of time series containing a single sample for each time series;
○ Example: http_requests_total{environment=~"staging|development",method!="GET"}
● Range vector - a set of time series containing a range of data points for each time series;
○ Example: http_requests_total{job="prometheus"}[5m]
● Scalar - a simple numeric floating point value;
○ Example: -2.43
● String - a simple string value;
○ Example: 'these are unescaped: n  t'
Prometheus Basic Concepts - REST API
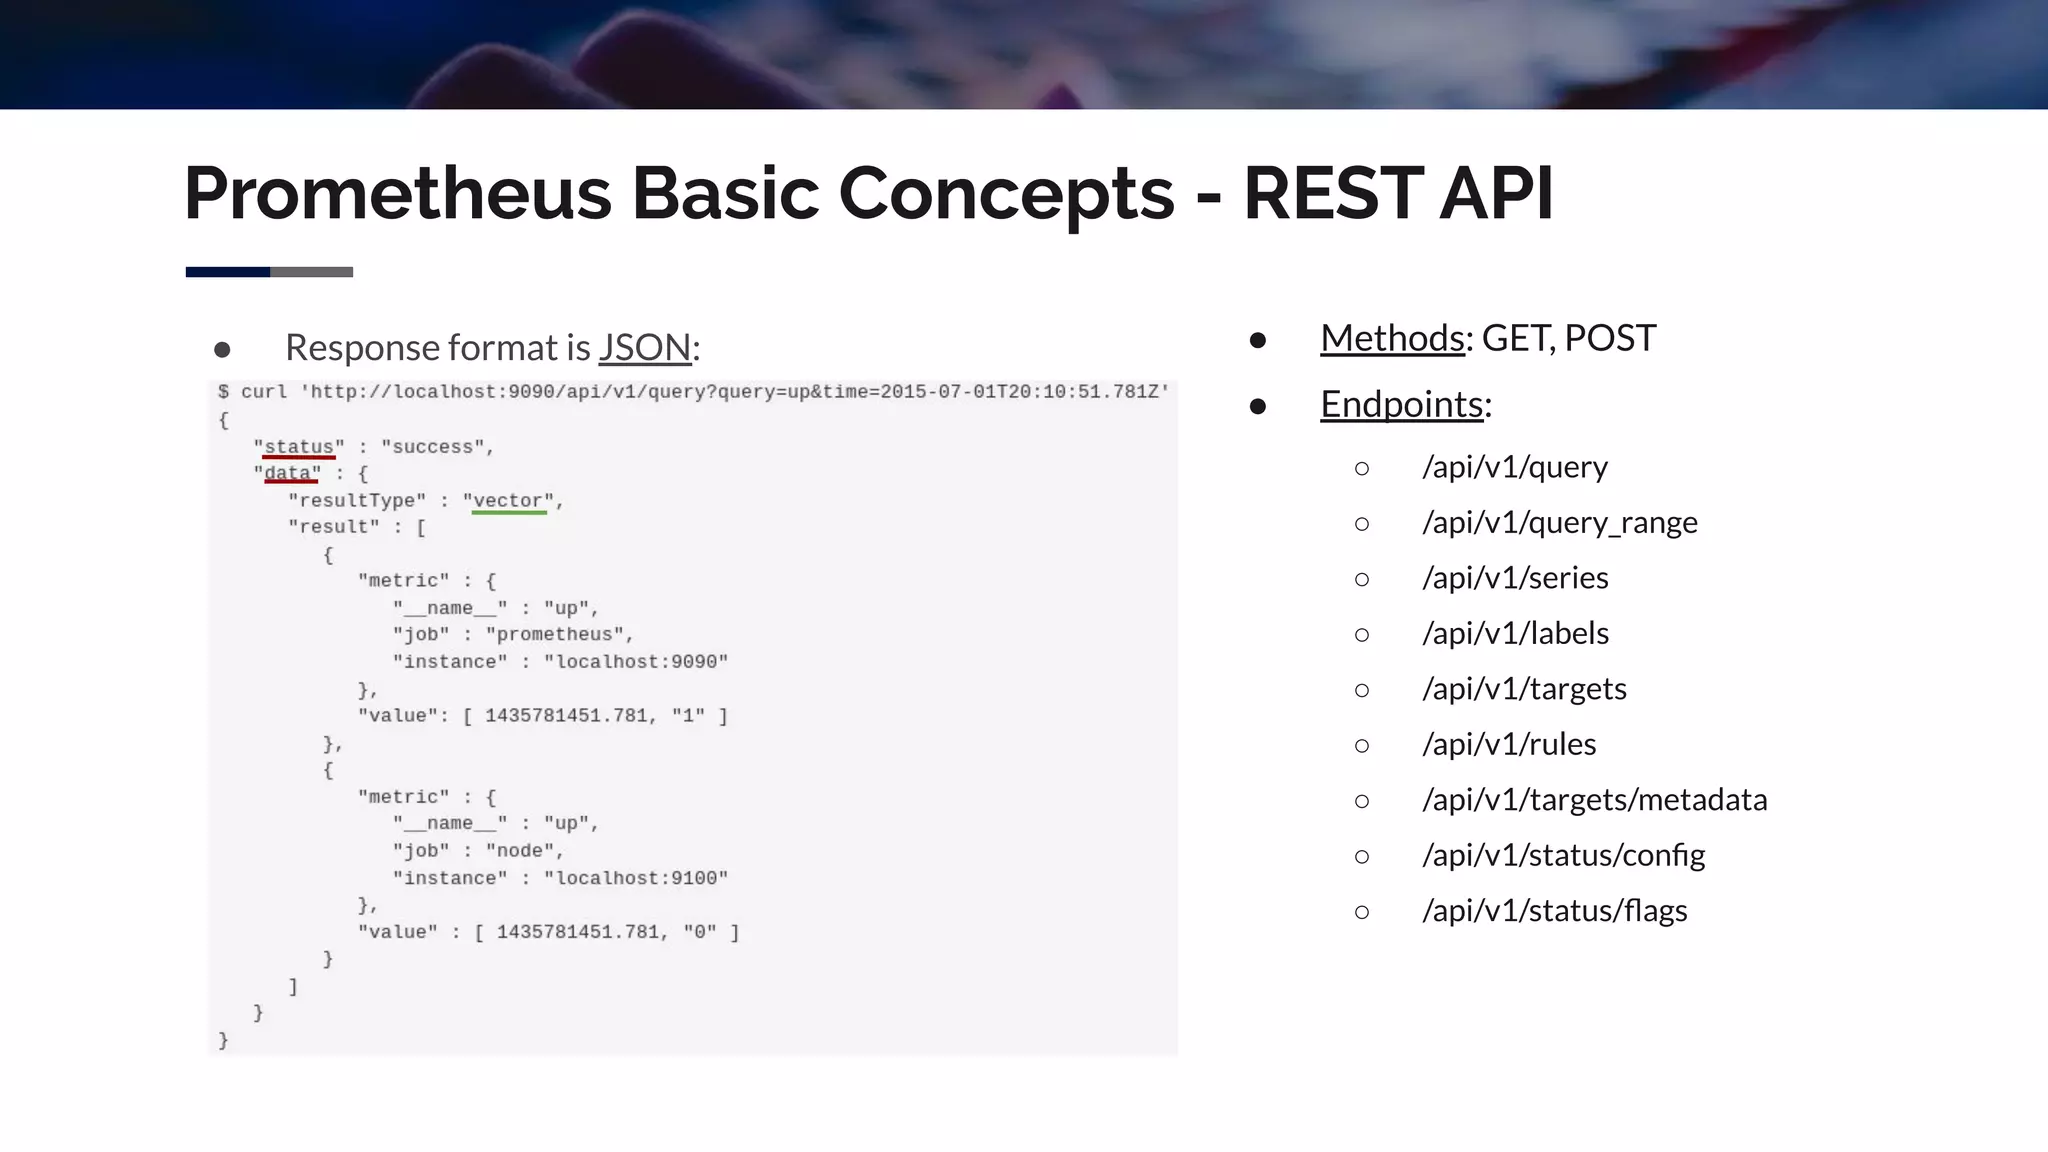
● Response format is JSON: ● Methods: GET, POST
● Endpoints:
○ /api/v1/query
○ /api/v1/query_range
○ /api/v1/series
○ /api/v1/labels
○ /api/v1/targets
○ /api/v1/rules
○ /api/v1/targets/metadata
○ /api/v1/status/config
○ /api/v1/status/flags
Prometheus Basic Concepts - Scrape Metrics
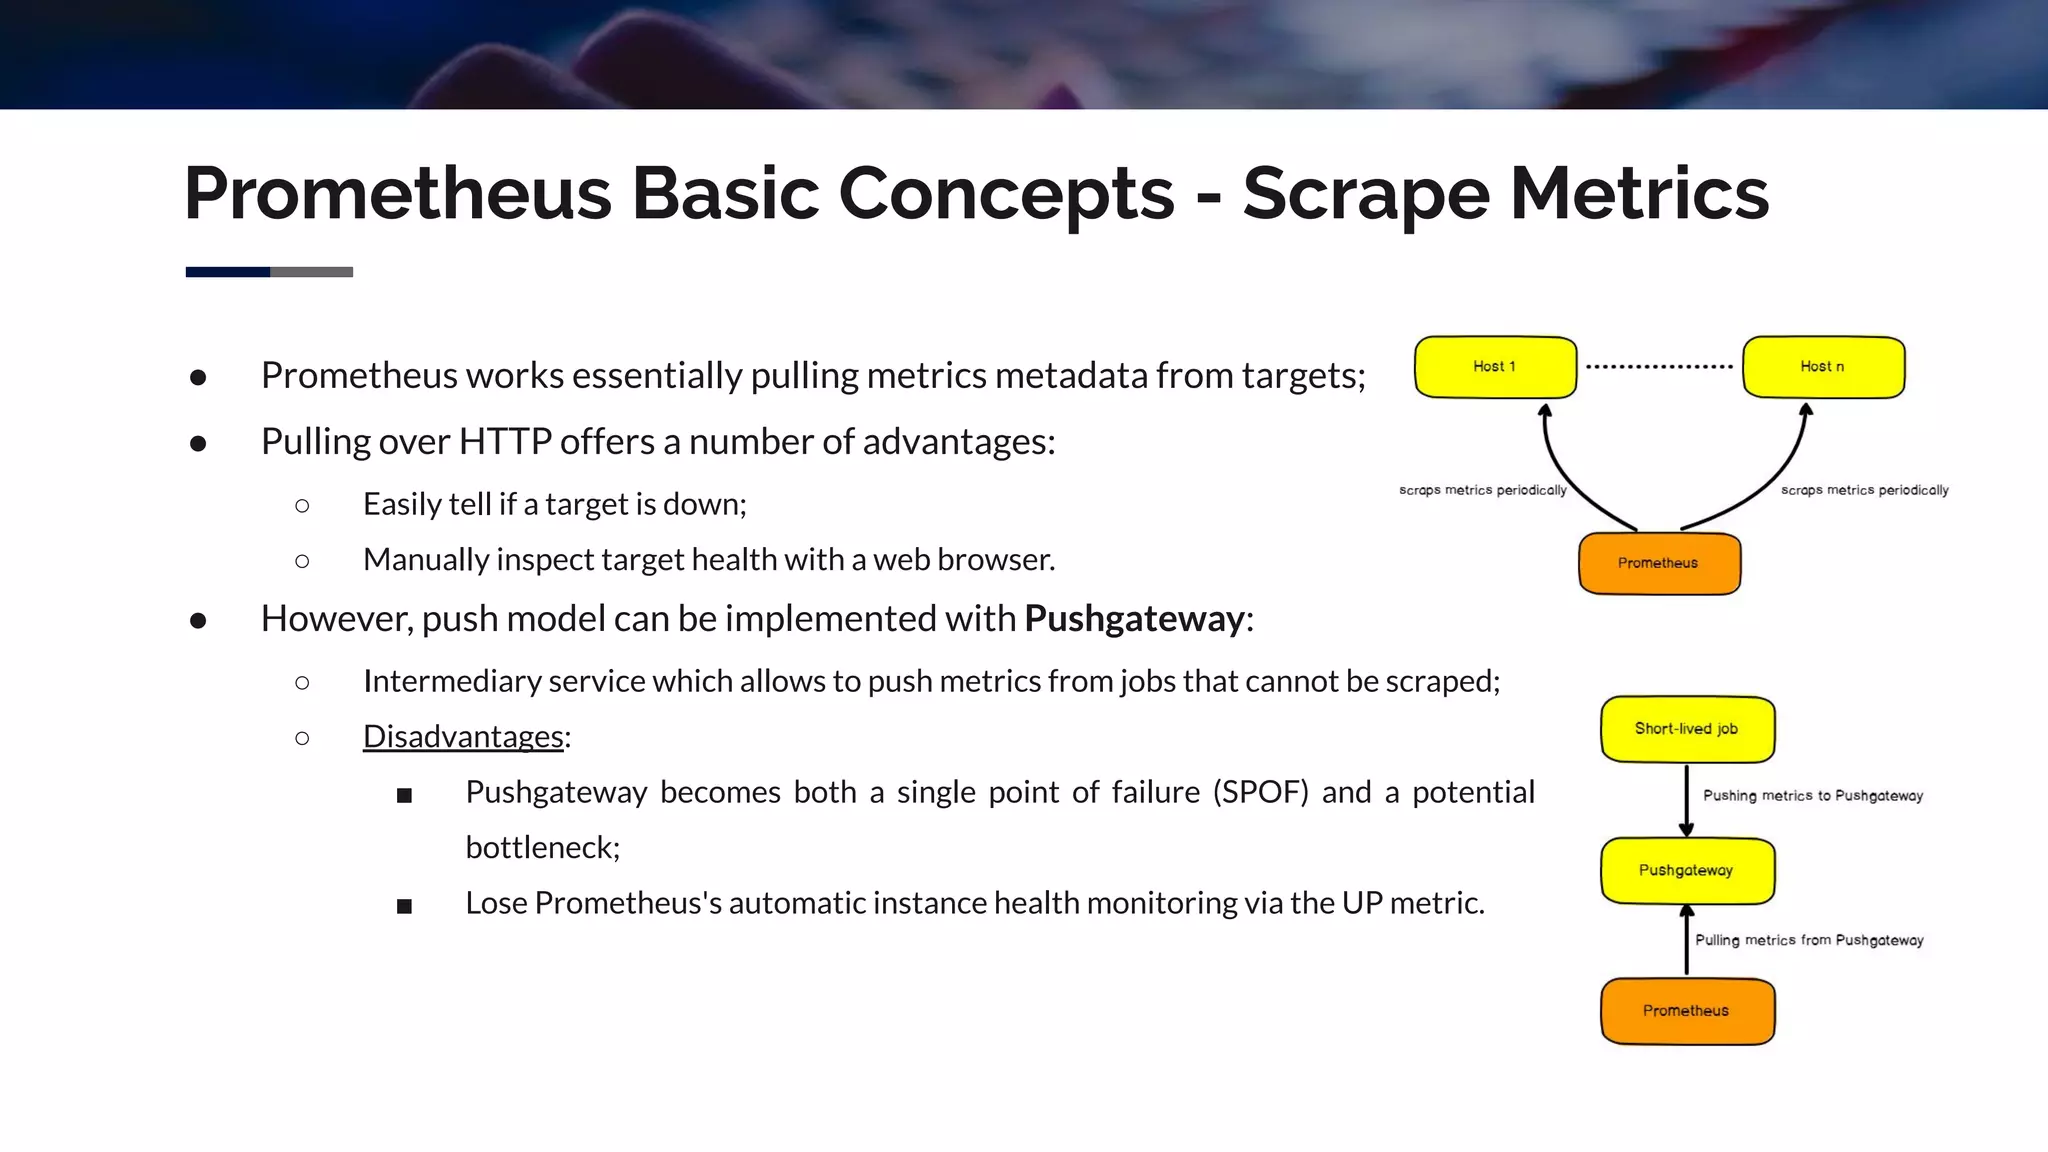
● Prometheus works essentially pulling metrics metadata from targets;
● Pulling over HTTP offers a number of advantages:
○ Easily tell if a target is down;
○ Manually inspect target health with a web browser.
● However, push model can be implemented with Pushgateway:
○ Intermediary service which allows to push metrics from jobs that cannot be scraped;
○ Disadvantages:
■ Pushgateway becomes both a single point of failure (SPOF) and a potential
bottleneck;
■ Lose Prometheus's automatic instance health monitoring via the UP metric.
Prometheus Server - Installation
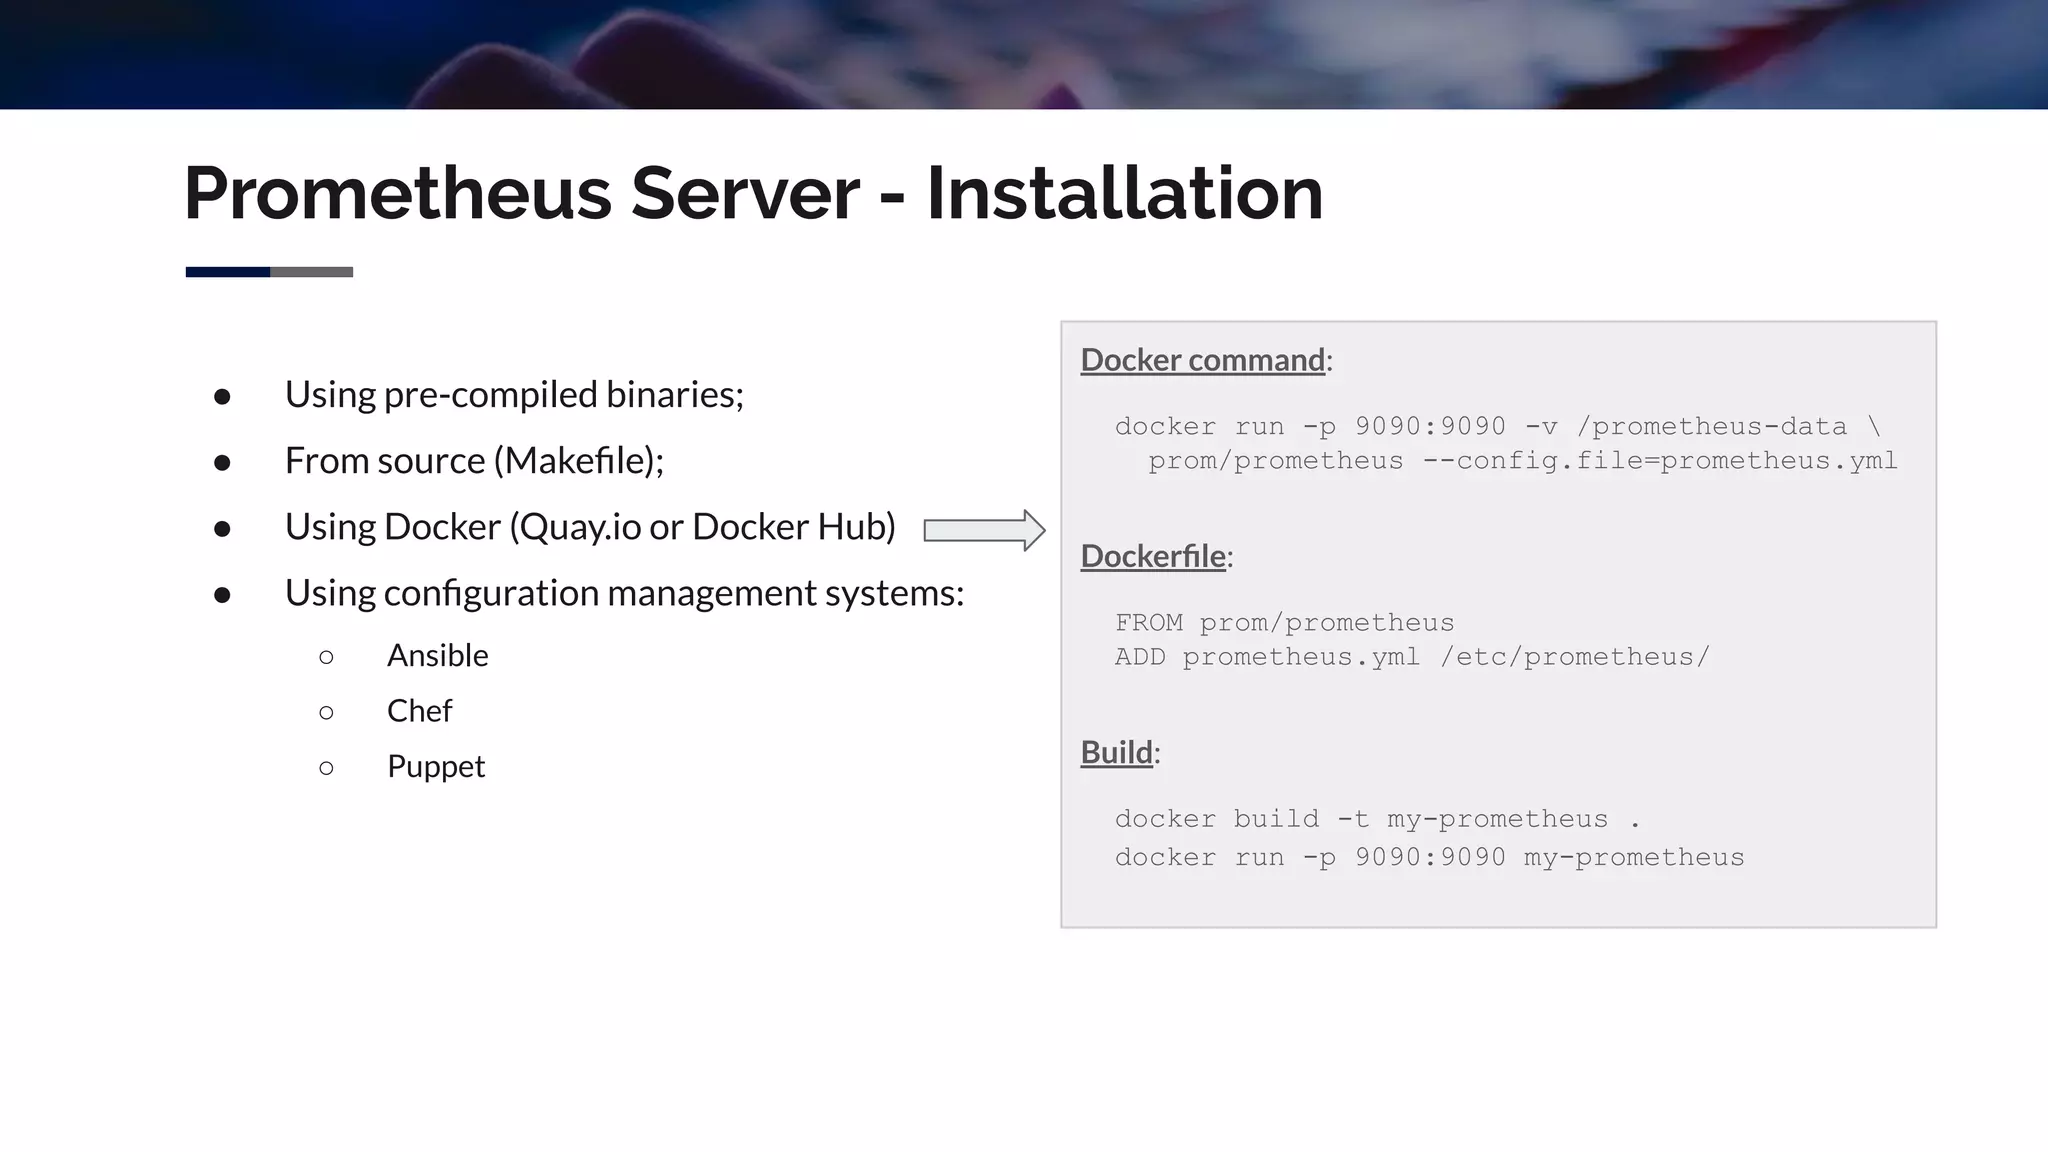
● Using pre-compiled binaries;
● From source (Makefile);
● Using Docker (Quay.io or Docker Hub)
● Using configuration management systems:
○ Ansible
○ Chef
○ Puppet
Docker command:
docker run -p 9090:9090 -v /prometheus-data 
prom/prometheus --config.file=prometheus.yml
Dockerfile:
FROM prom/prometheus
ADD prometheus.yml /etc/prometheus/
Build:
docker build -t my-prometheus .
docker run -p 9090:9090 my-prometheus
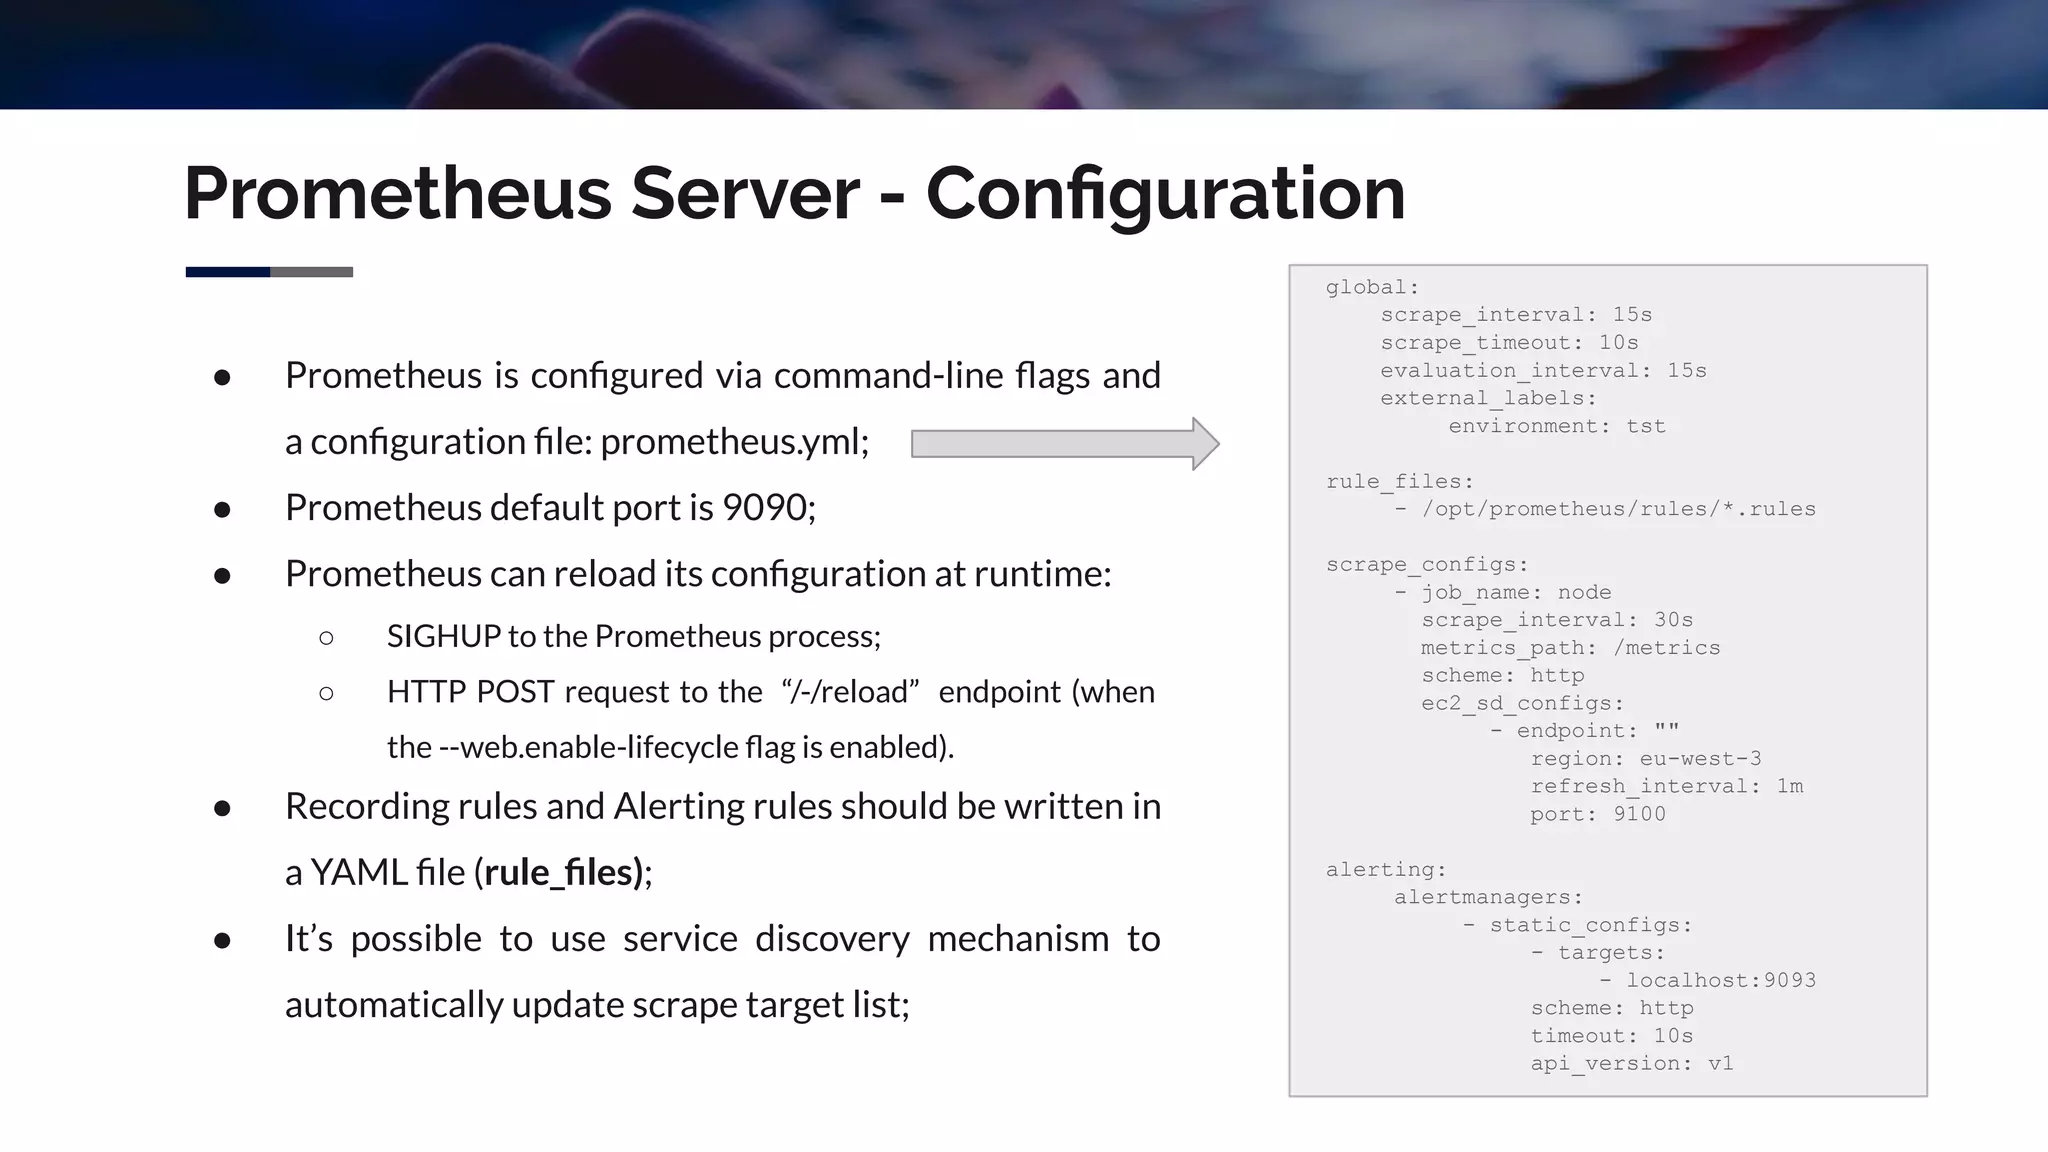
Prometheus Server - Configuration
● Prometheus is configured via command-line flags and
a configuration file: prometheus.yml;
● Prometheus default port is 9090;
● Prometheus can reload its configuration at runtime:
○ SIGHUP to the Prometheus process;
○ HTTP POST request to the “/-/reload” endpoint (when
the --web.enable-lifecycle flag is enabled).
● Recording rules and Alerting rules should be written in
a YAML file (rule_files);
● It’s possible to use service discovery mechanism to
automatically update scrape target list;
global:
scrape_interval: 15s
scrape_timeout: 10s
evaluation_interval: 15s
external_labels:
environment: tst
rule_files:
- /opt/prometheus/rules/*.rules
scrape_configs:
- job_name: node
scrape_interval: 30s
metrics_path: /metrics
scheme: http
ec2_sd_configs:
- endpoint: ""
region: eu-west-3
refresh_interval: 1m
port: 9100
alerting:
alertmanagers:
- static_configs:
- targets:
- localhost:9093
scheme: http
timeout: 10s
api_version: v1
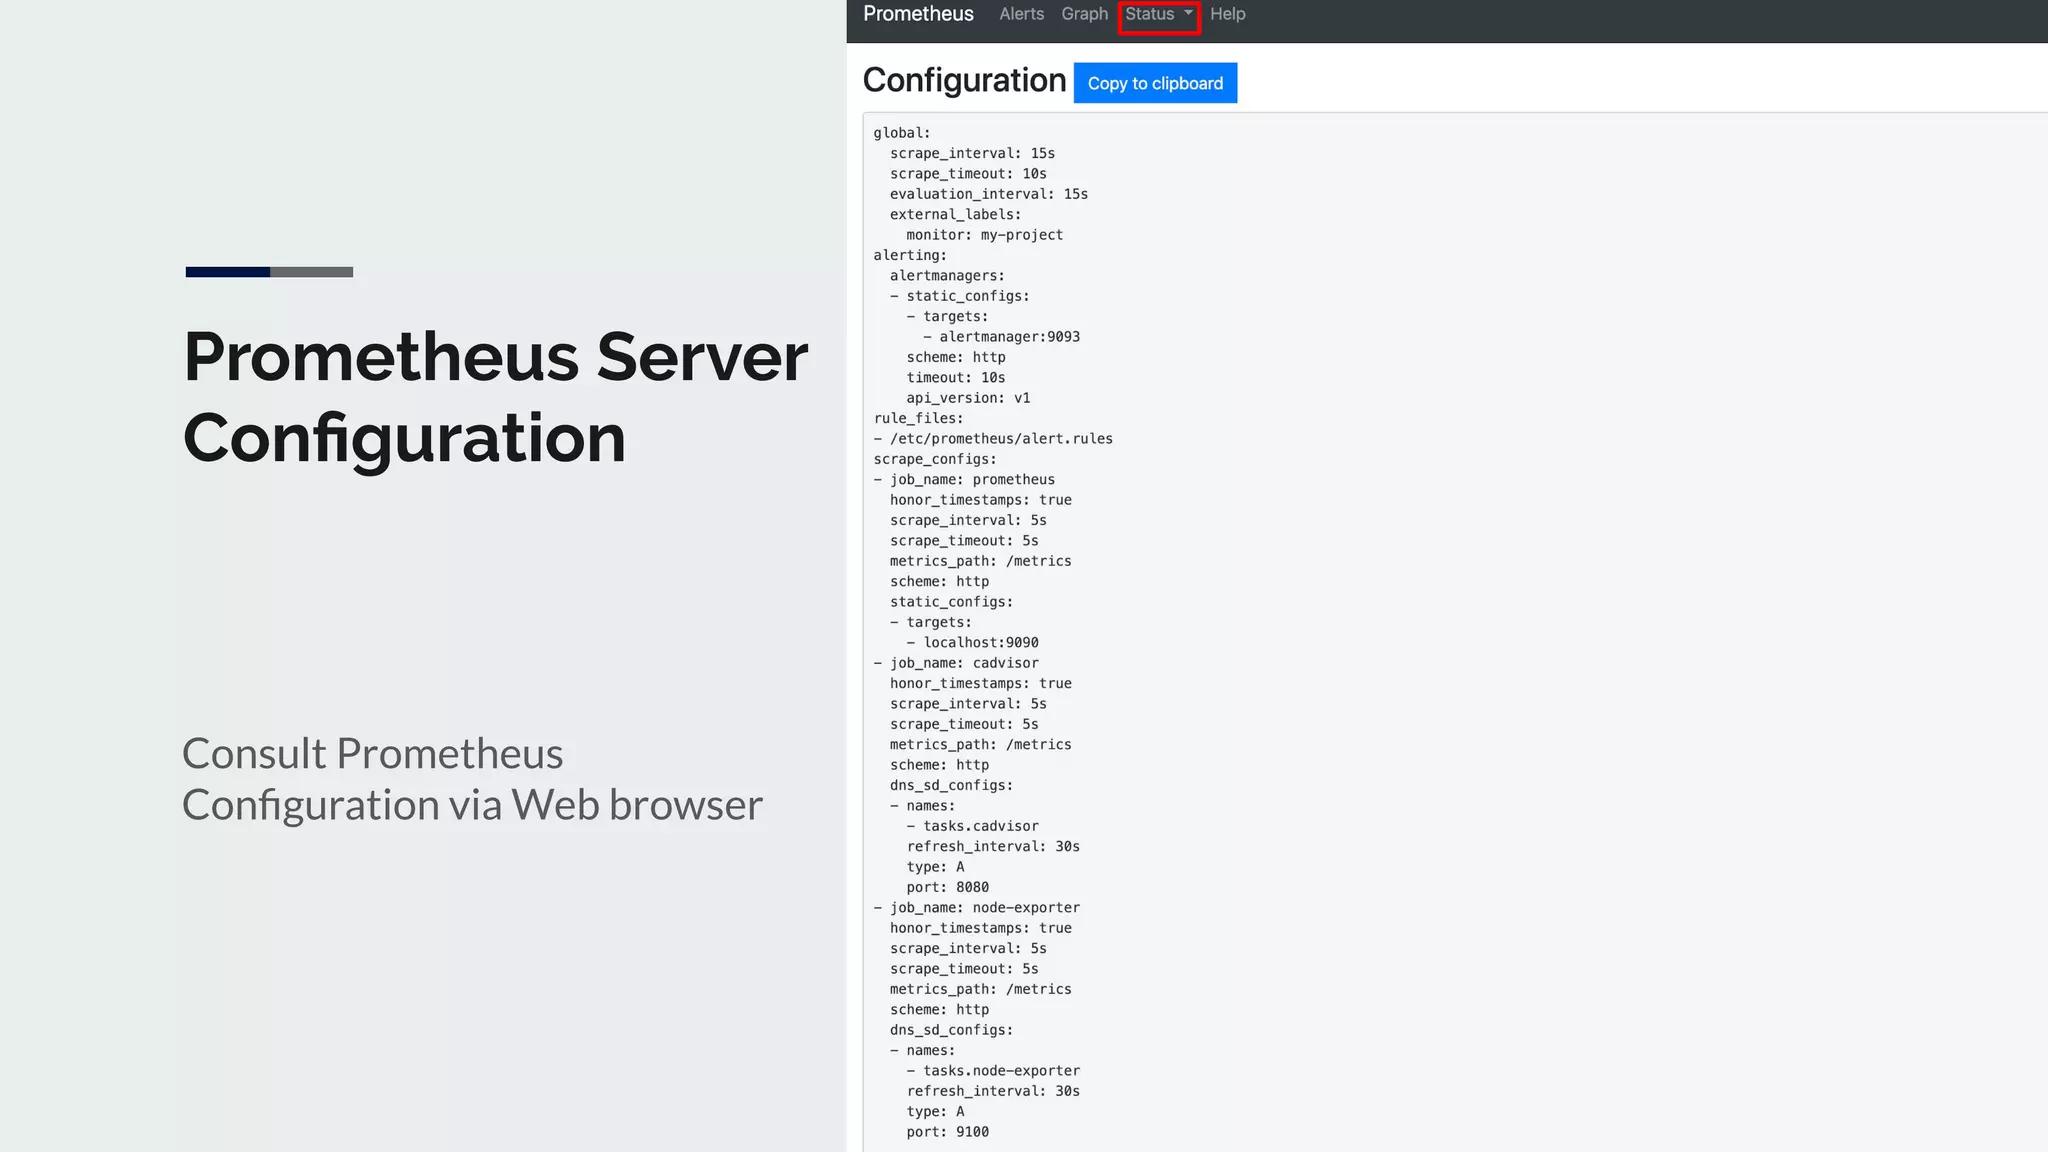
Prometheus Server
Configuration
Consult Prometheus
Configuration via Web browser
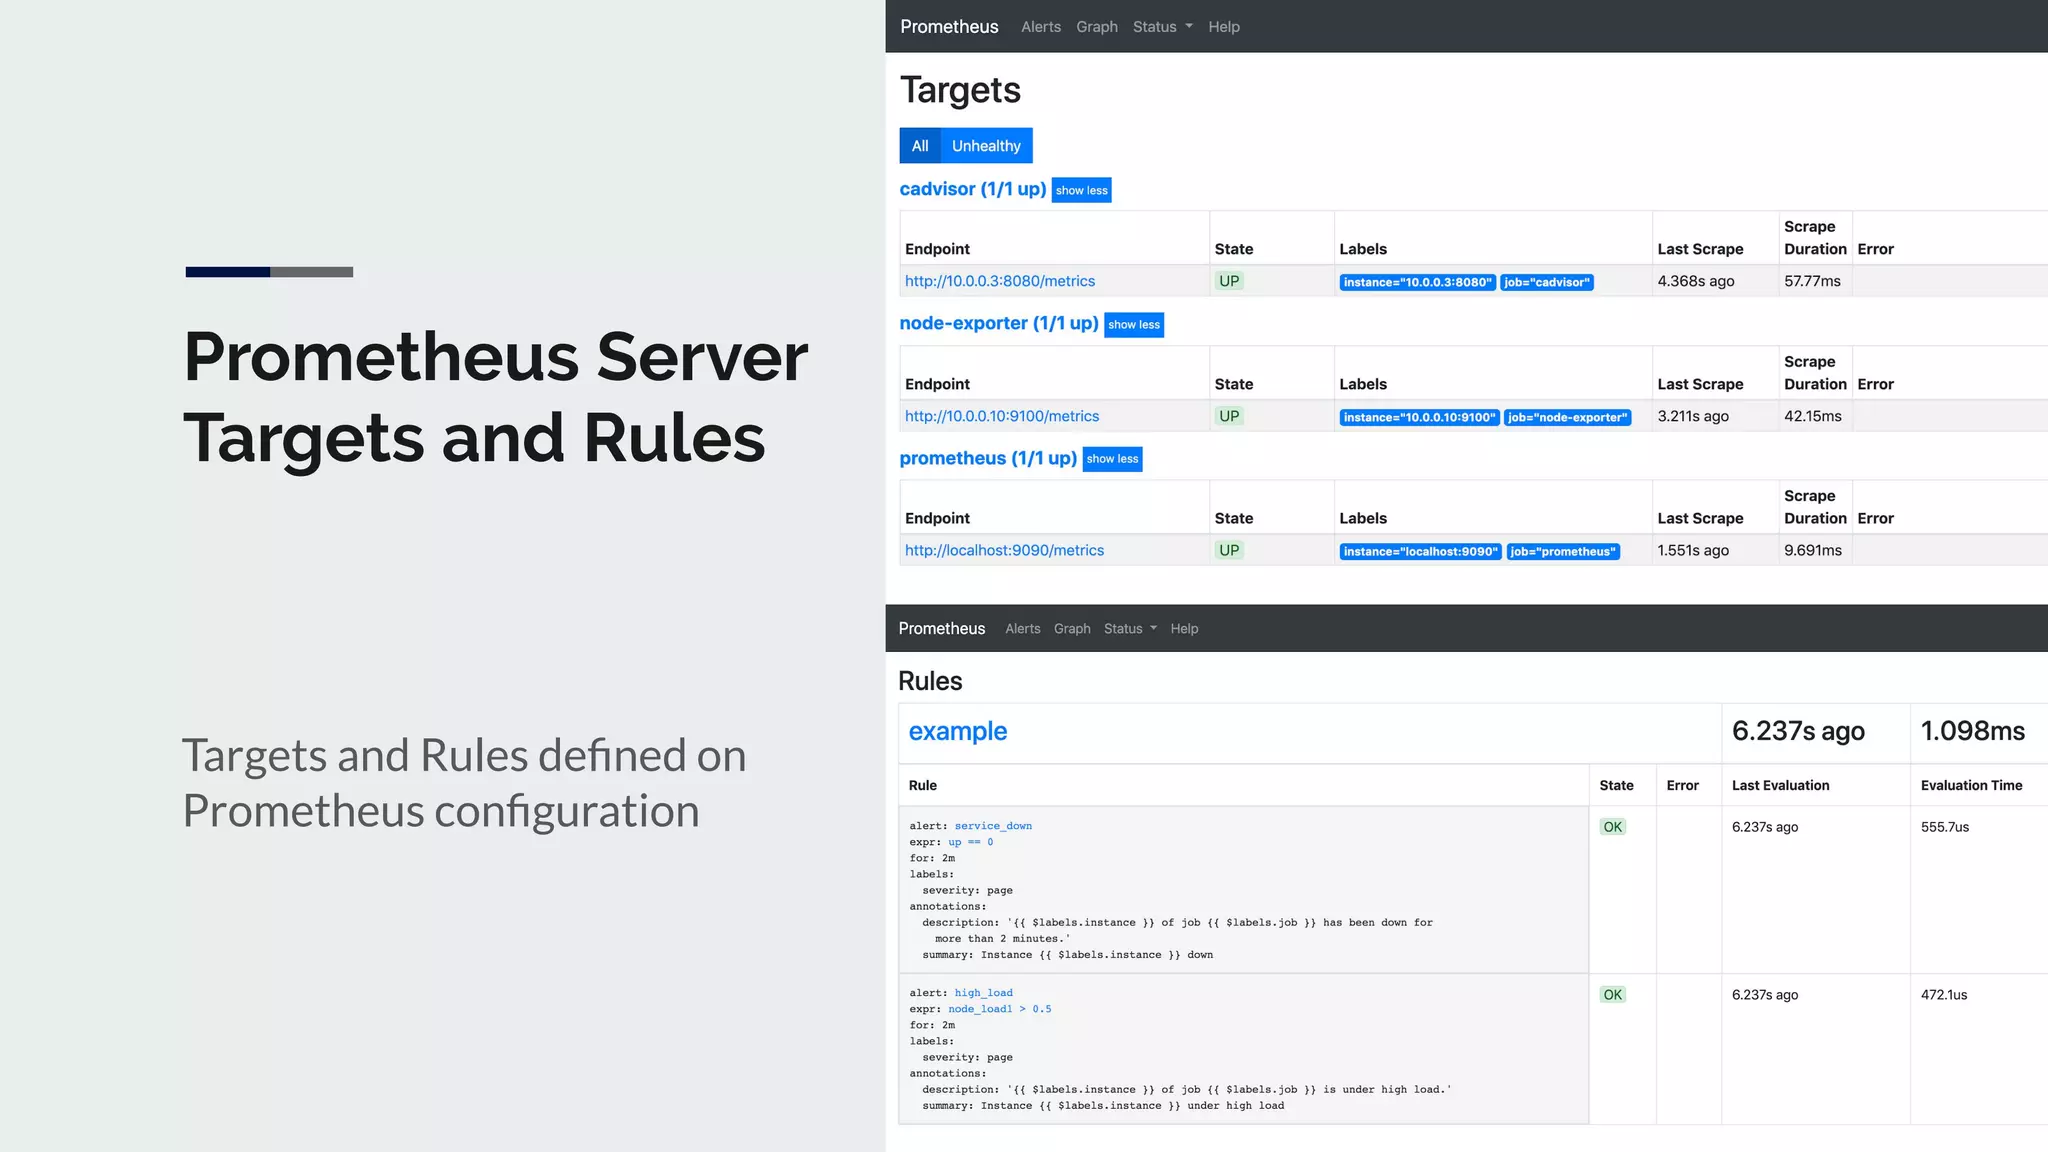
Prometheus Server
Targets and Rules
Targets and Rules defined on
Prometheus configuration
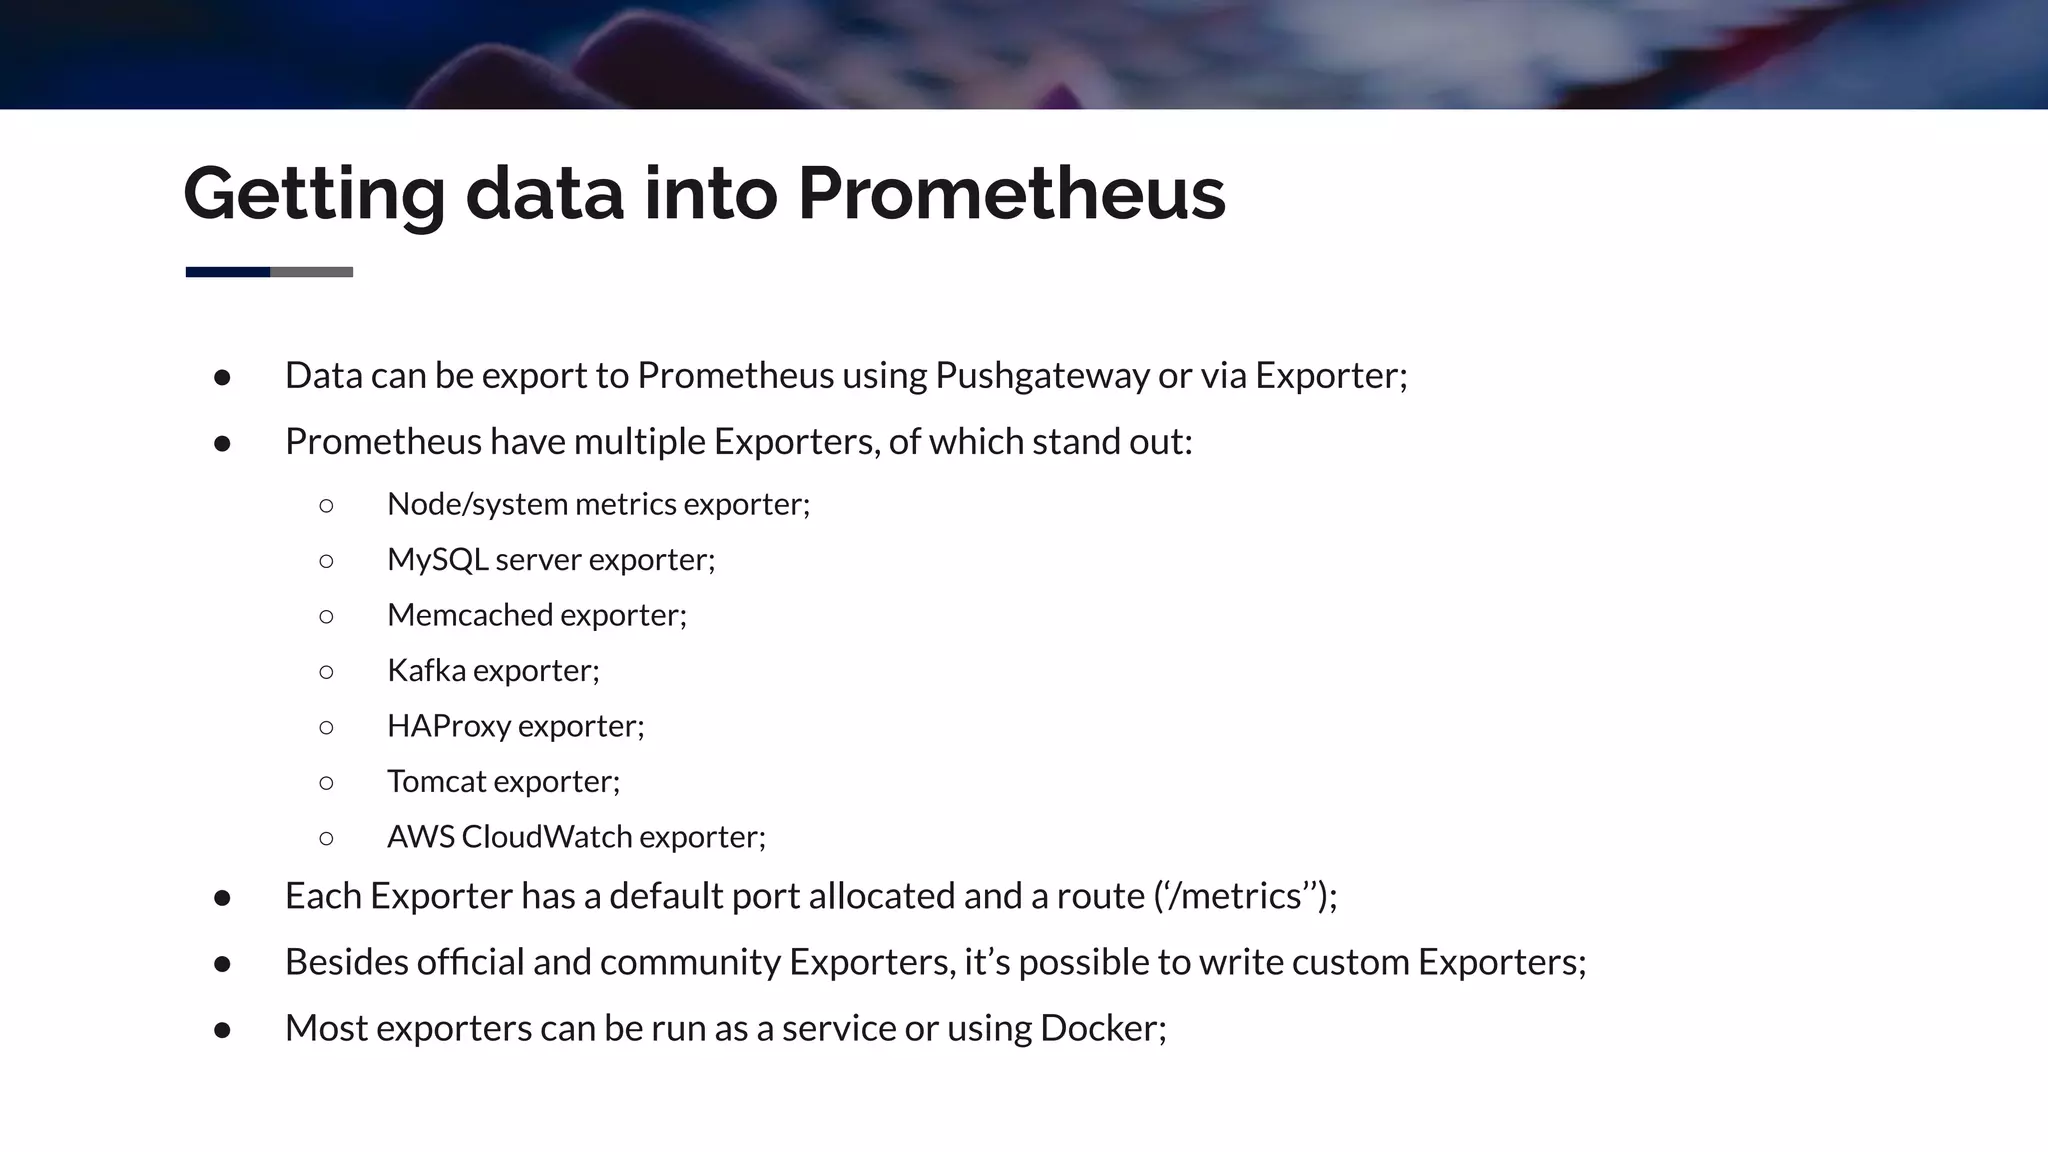
Getting data into Prometheus
● Data can be export to Prometheus using Pushgateway or via Exporter;
● Prometheus have multiple Exporters, of which stand out:
○ Node/system metrics exporter;
○ MySQL server exporter;
○ Memcached exporter;
○ Kafka exporter;
○ HAProxy exporter;
○ Tomcat exporter;
○ AWS CloudWatch exporter;
● Each Exporter has a default port allocated and a route (‘/metrics’’);
● Besides official and community Exporters, it’s possible to write custom Exporters;
● Most exporters can be run as a service or using Docker;
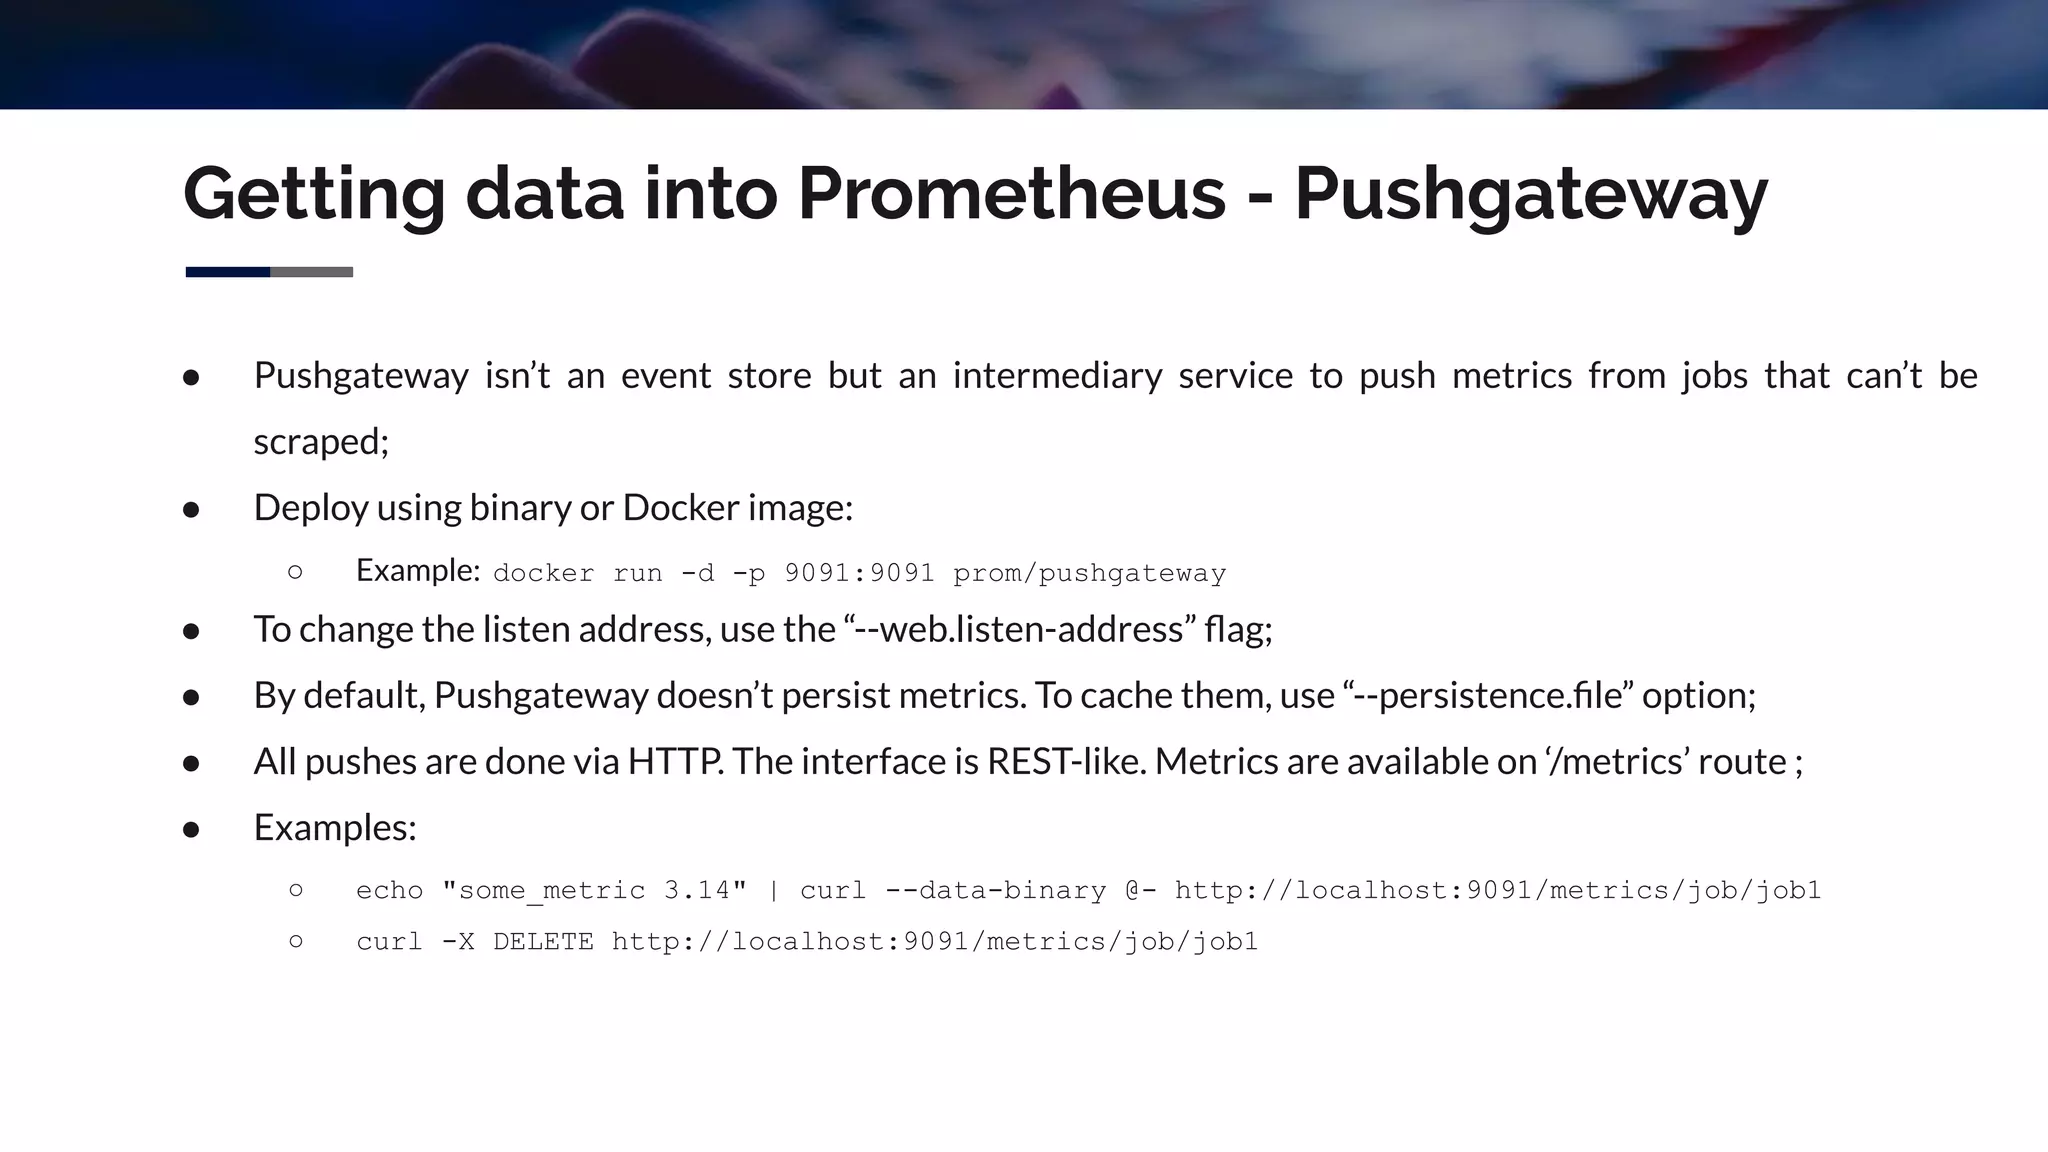
● Pushgateway isn’t an event store but an intermediary service to push metrics from jobs that can’t be
scraped;
● Deploy using binary or Docker image:
○ Example: docker run -d -p 9091:9091 prom/pushgateway
● To change the listen address, use the “--web.listen-address” flag;
● By default, Pushgateway doesn’t persist metrics. To cache them, use “--persistence.file” option;
● All pushes are done via HTTP. The interface is REST-like. Metrics are available on ‘/metrics’ route ;
● Examples:
○ echo "some_metric 3.14" | curl --data-binary @- http://localhost:9091/metrics/job/job1
○ curl -X DELETE http://localhost:9091/metrics/job/job1
Getting data into Prometheus - Pushgateway
Getting data into Prometheus - Node Exporter
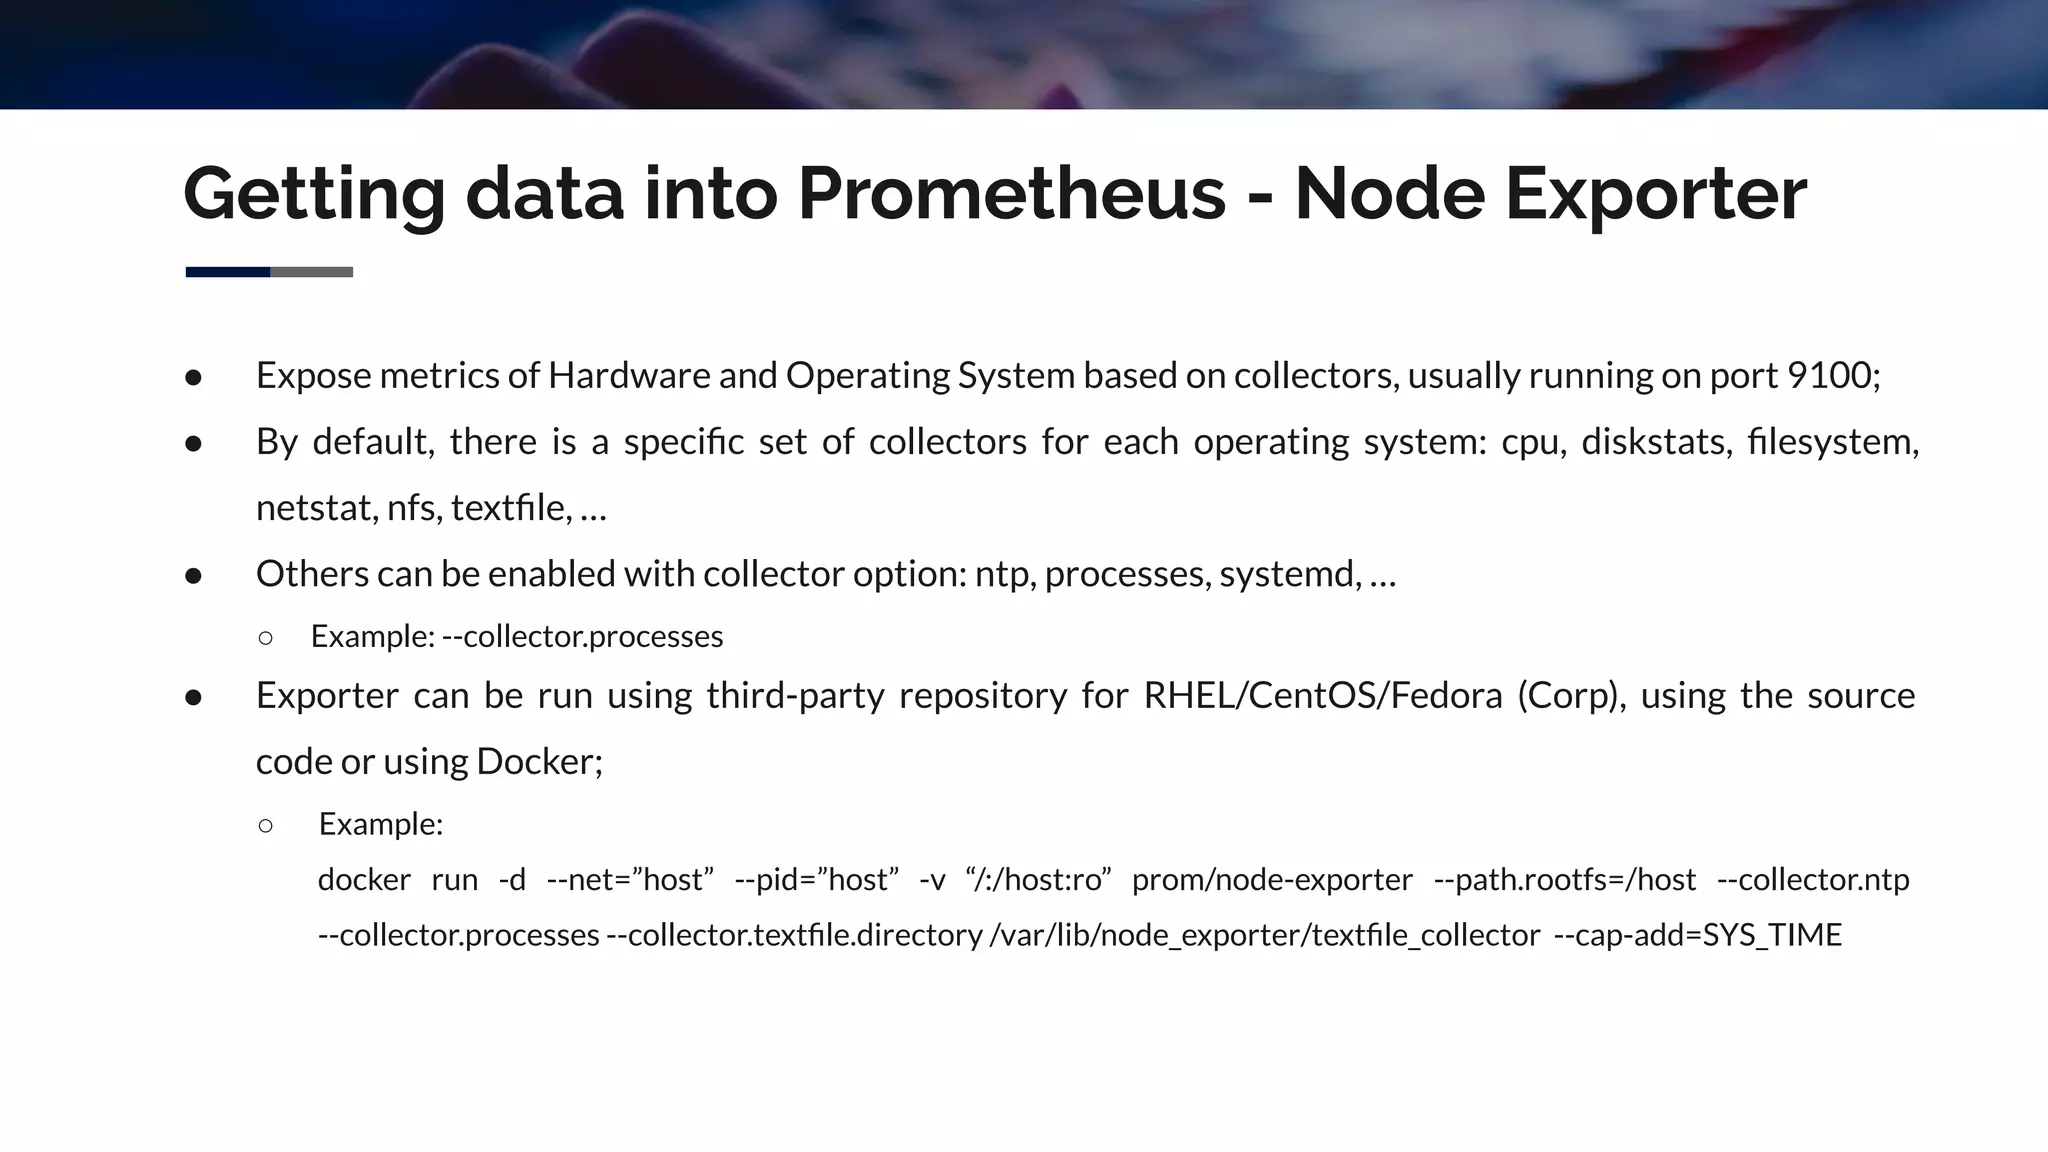
● Expose metrics of Hardware and Operating System based on collectors, usually running on port 9100;
● By default, there is a specific set of collectors for each operating system: cpu, diskstats, filesystem,
netstat, nfs, textfile, …
● Others can be enabled with collector option: ntp, processes, systemd, …
○ Example: --collector.processes
● Exporter can be run using third-party repository for RHEL/CentOS/Fedora (Corp), using the source
code or using Docker;
○ Example:
docker run -d --net=”host” --pid=”host” -v “/:/host:ro” prom/node-exporter --path.rootfs=/host --collector.ntp
--collector.processes --collector.textfile.directory /var/lib/node_exporter/textfile_collector --cap-add=SYS_TIME
Implement custom metrics on Node Exporter
● Custom metrics can be implemented with textfile collector;
● Textfile collector is similar to Pushgateway, in that it allows exporting of statistics from batch jobs;
● Pushgateway should be used for service-level metrics, while textfile should be used for machine metrics;
● The collector will parse all files in textfile directory matching the glob *.prom using the text format;
● Example to automatically push logged in users on machine:
echo node_users_logged_in $(who /host/var/run/utmp | wc -l) > /var/lib/node_exporter/textfile_collector/users.prom.$$
mv /var/lib/node_exporter/textfile_collector/users.prom.$$ /var/lib/node_exporter/textfile_collector/users.prom
Getting data into
Prometheus - Node
Exporter
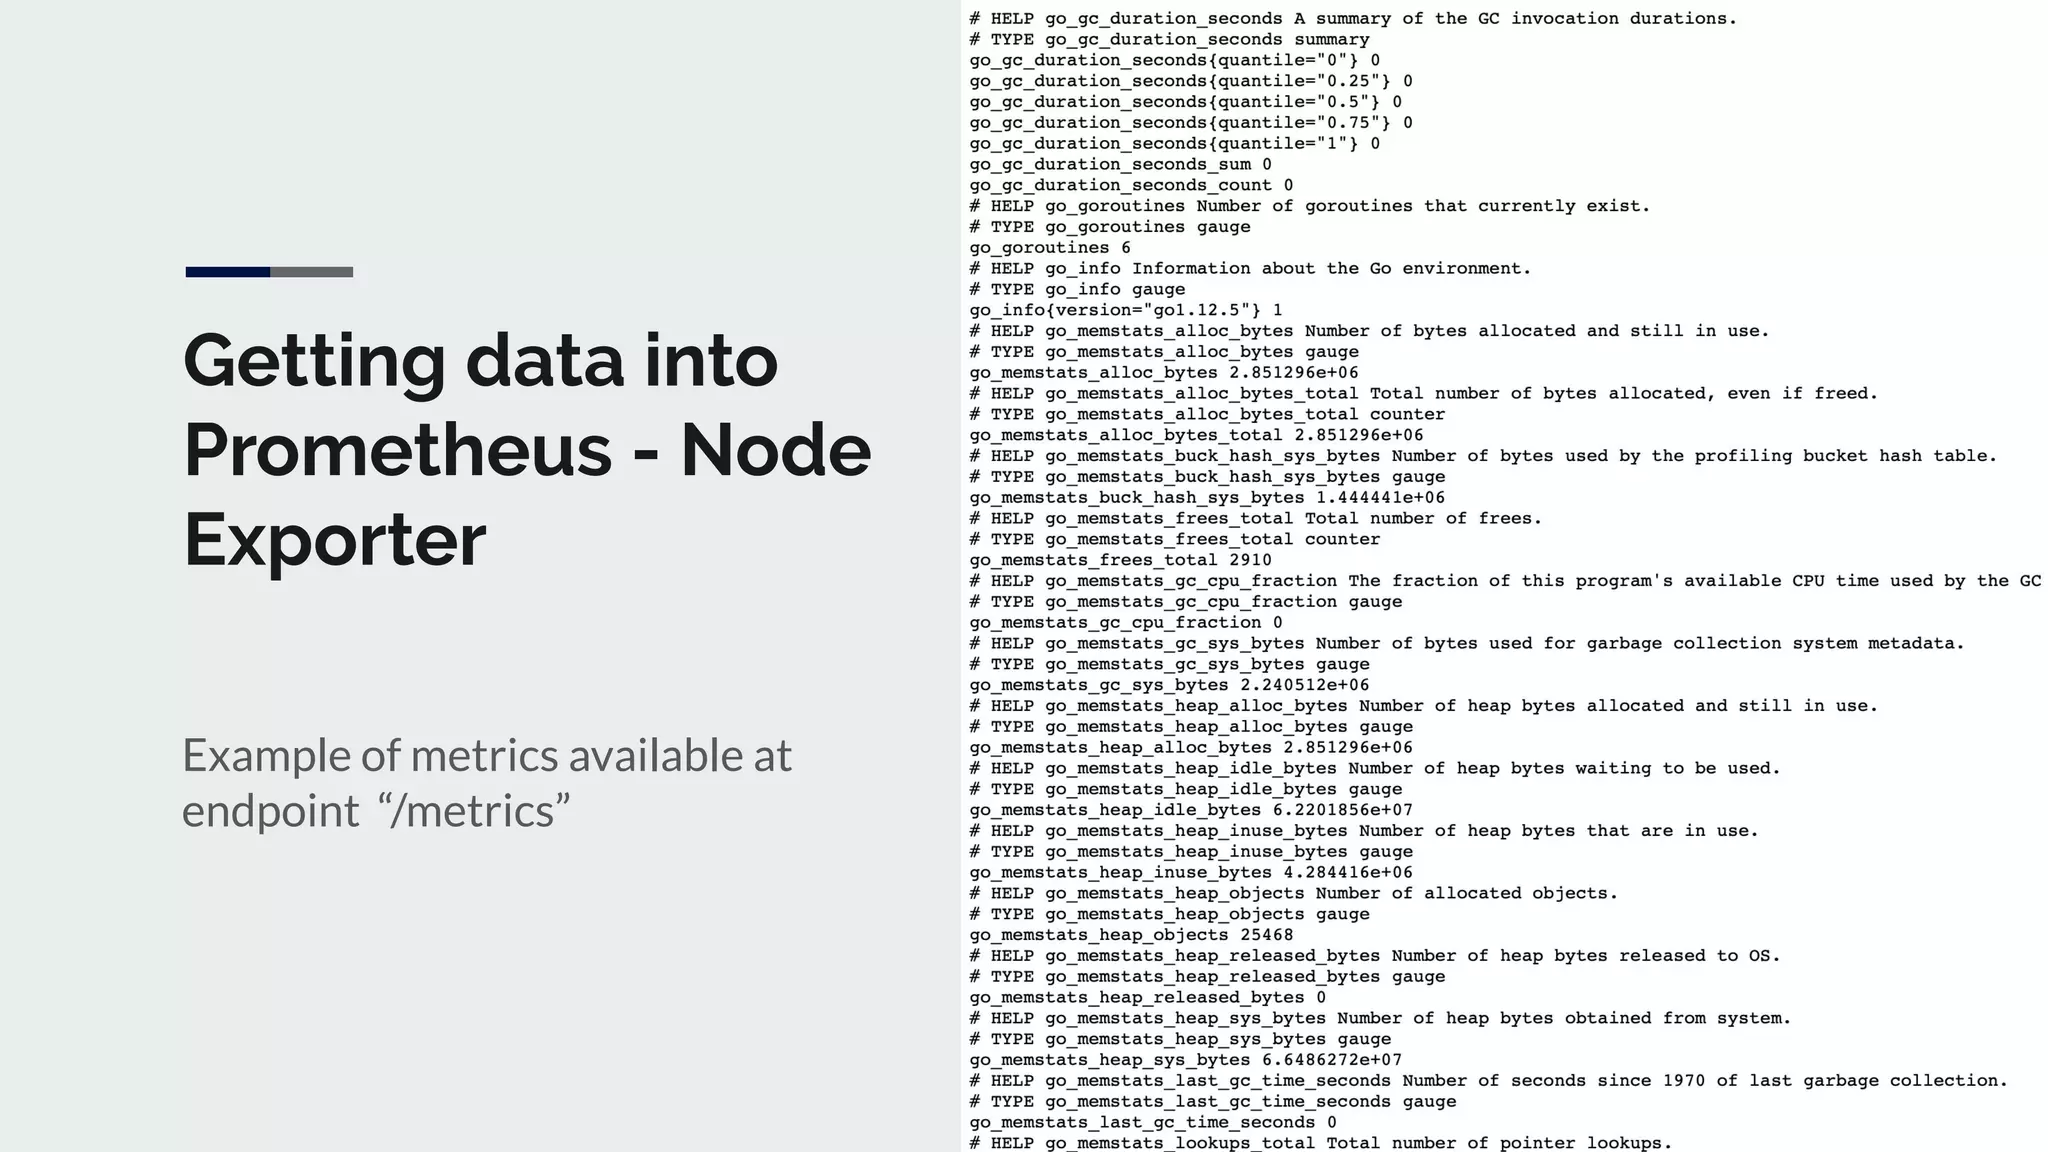
Example of metrics available at
endpoint “/metrics”
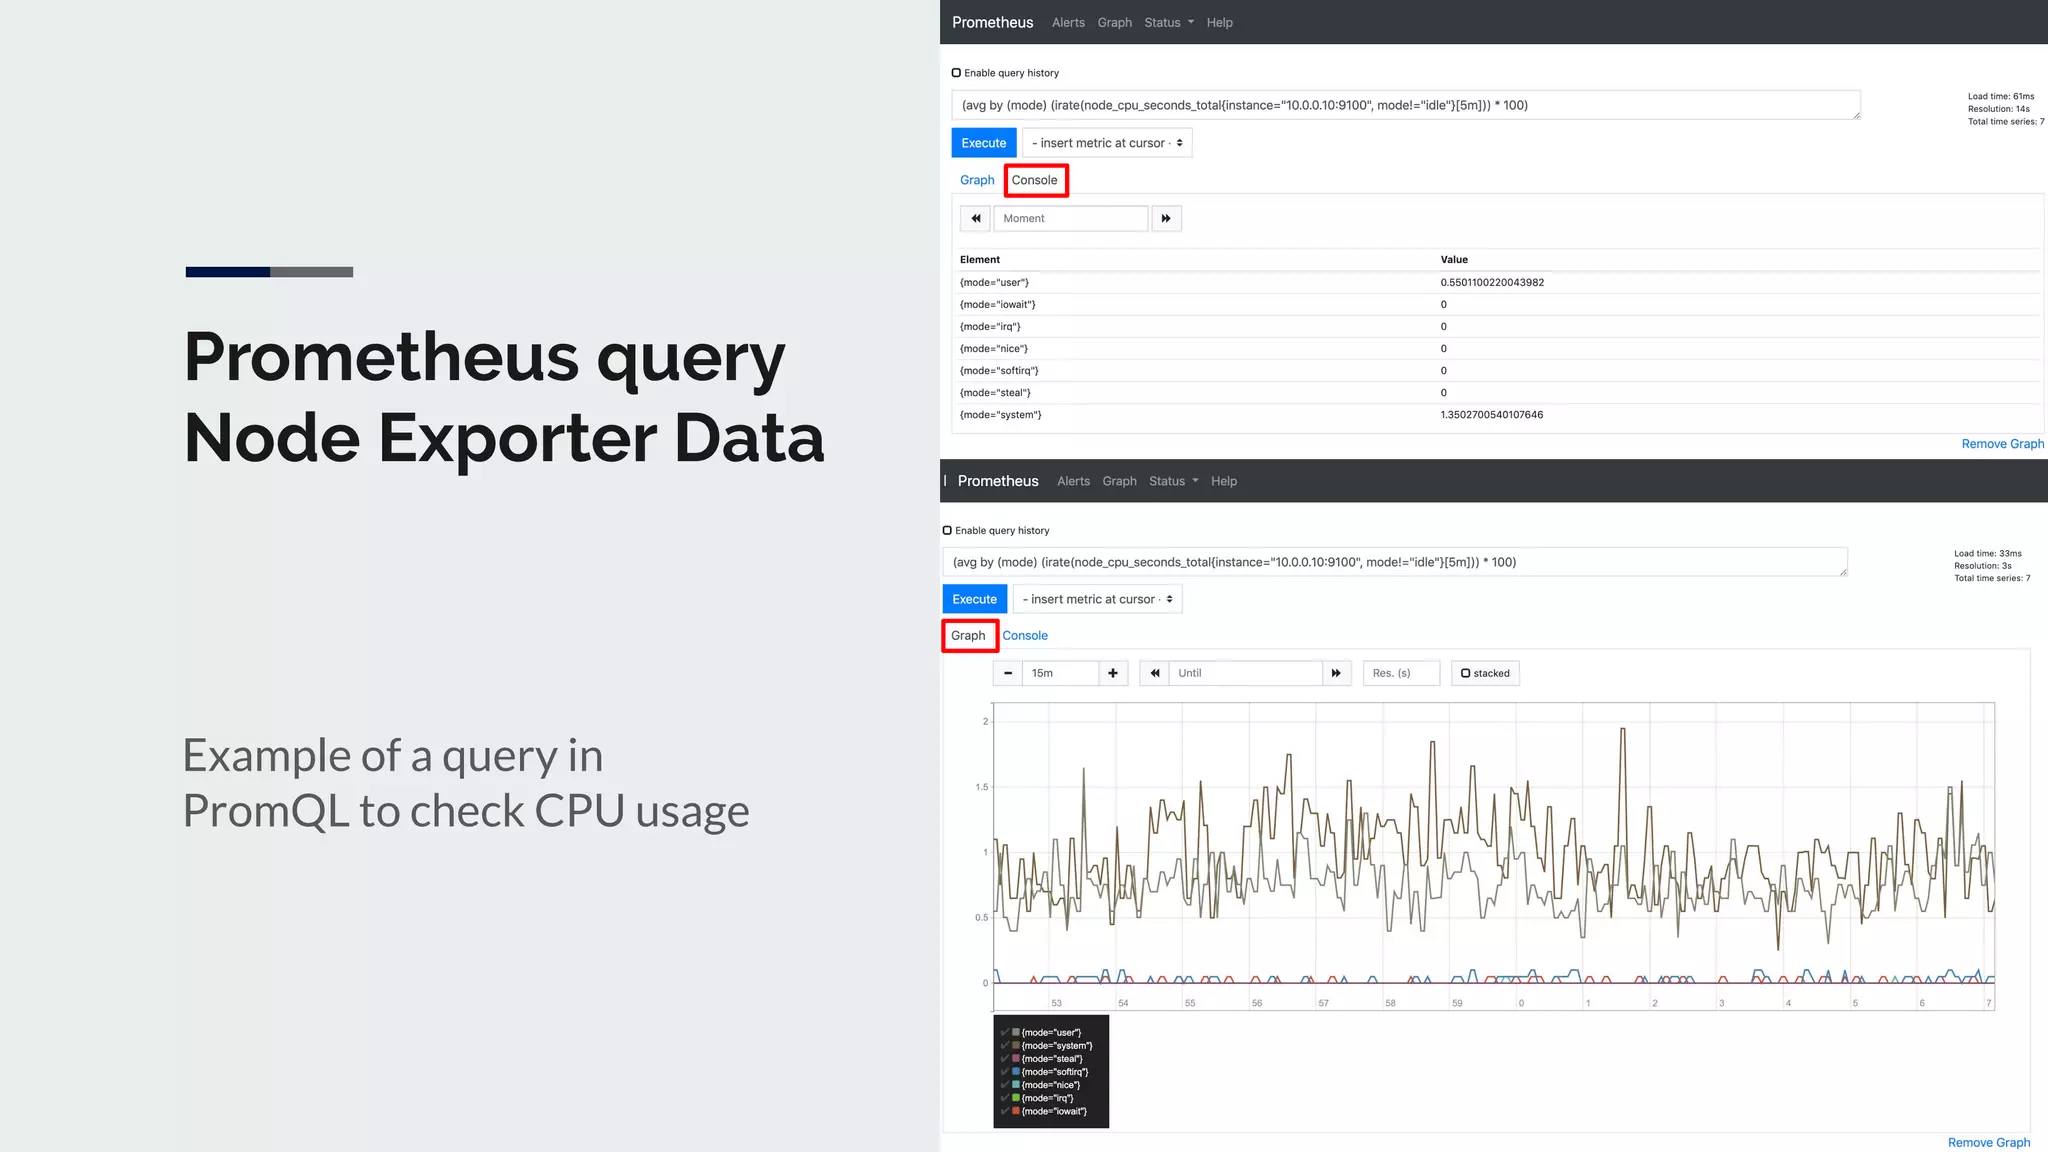
Prometheus query
Node Exporter Data
Example of a query in
PromQL to check CPU usage
How to integrate Icinga with Prometheus?
● Icinga can be integrated with Prometheus via Nagitheus (Claranet);
● Nagitheus is a Nagios plugin for querying Prometheus, written in Go;
● Nagitheus process vector or scalar results and return an exit code, according with warning/critical
values and comparison method (ge, gt, le, lt);
● Allows basic authentication on Prometheus with username and password (-u and -pw options);
● Example:
/usr/lib64/nagios/plugins/nagitheus -H http://localhost:9090 -i 10.0.0.10 -p 9100 -l 'Check CPU' -d yes -q
'(avg by (mode) (irate(node_cpu_seconds_total{instance="", mode!="idle"}[5m])) * 100)' -m ge -w 70 -c 80
How to integrate Icinga with Prometheus?
● Basic Linux Checks:
○ CPU
○ Disk
○ Load
○ Memory
○ Total procs
○ Ntp
● Steps to implement a check:
○ Identify metrics to use on query;
○ Create query considering PromQL operators and metric types;
○ Test query on Promehteus and define label, method and critical/warning values;
○ Implement icinga command using the query and values specified for each option.
How to integrate Icinga with Prometheus?
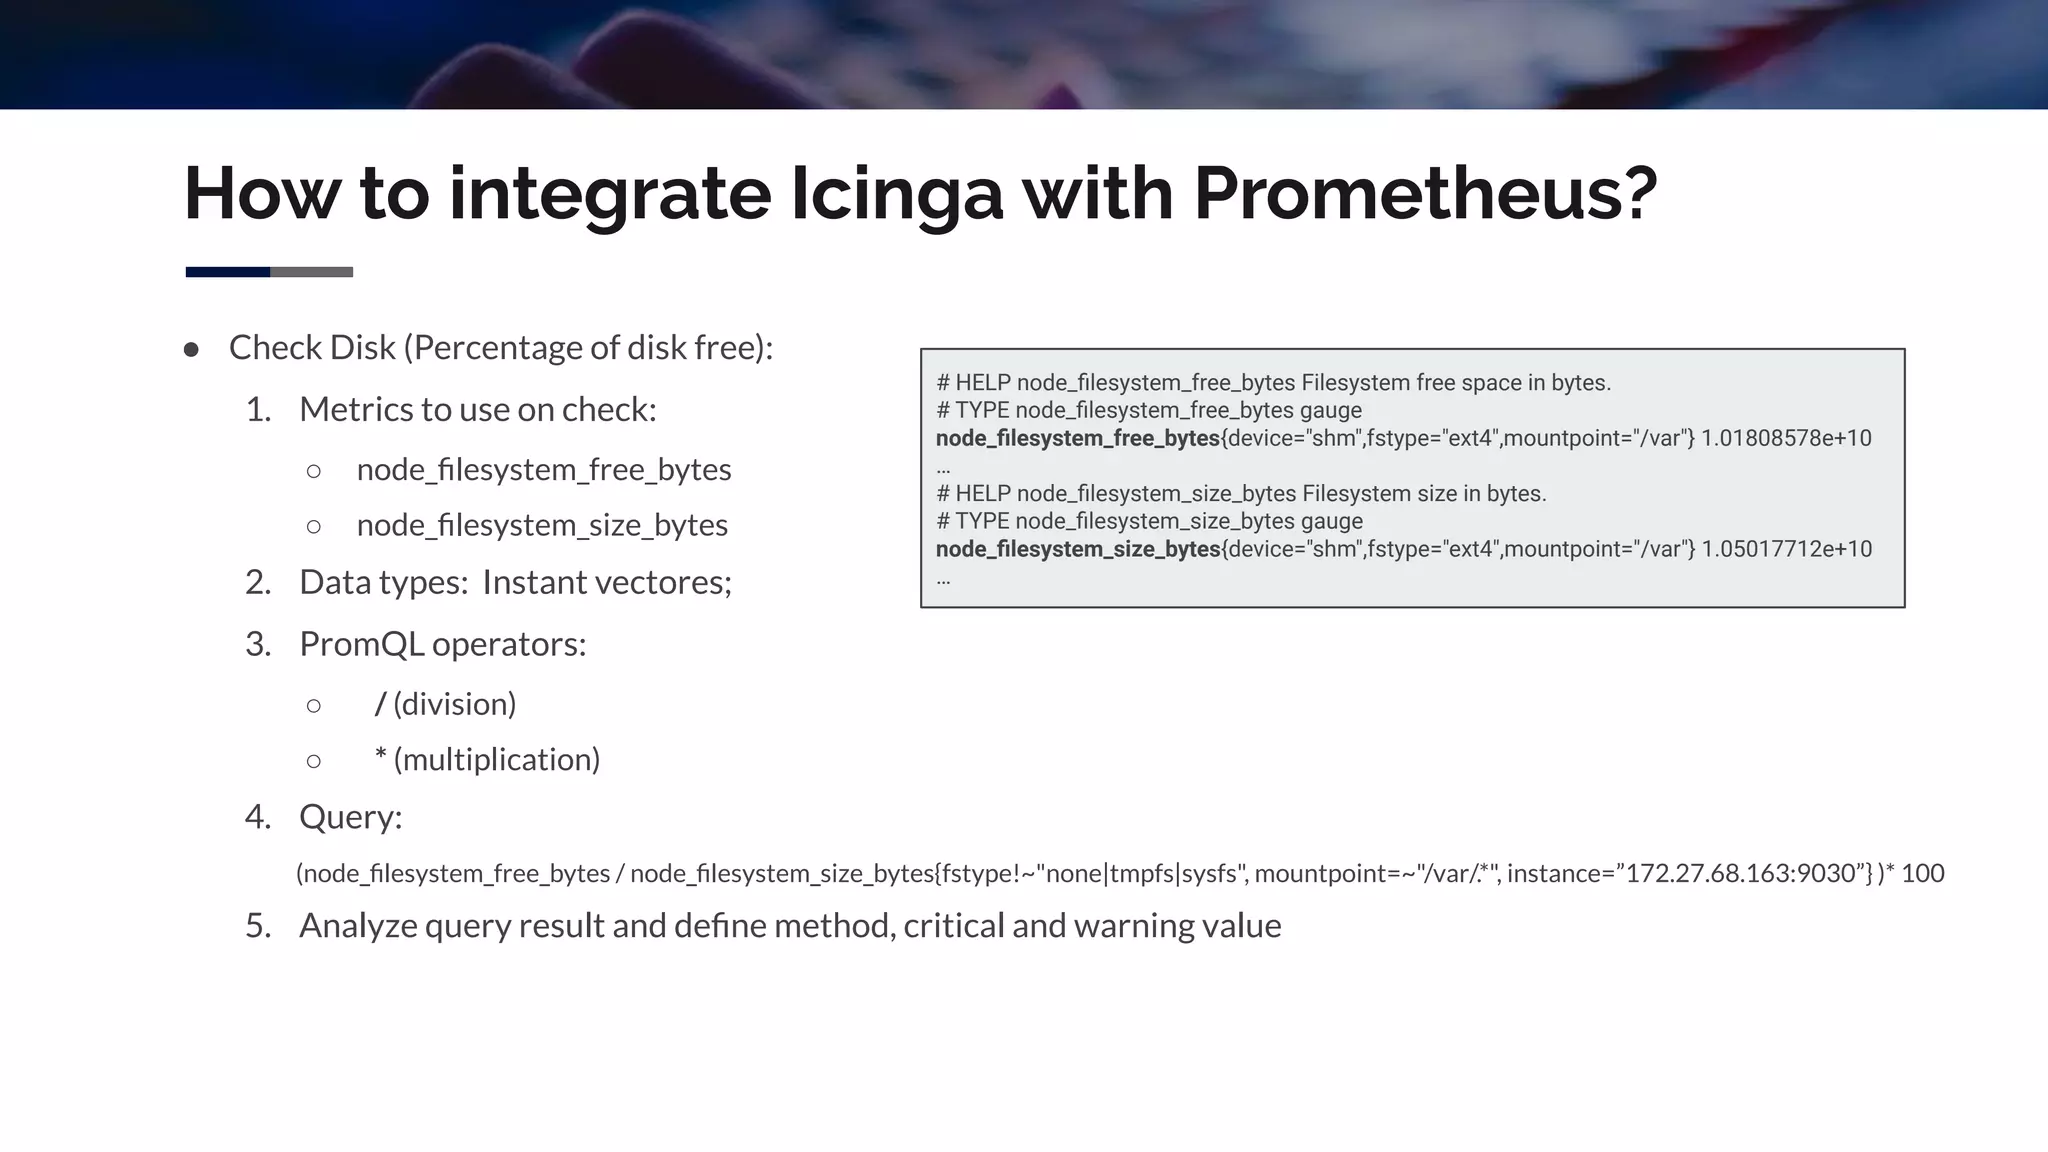
● Check Disk (Percentage of disk free):
1. Metrics to use on check:
○ node_filesystem_free_bytes
○ node_filesystem_size_bytes
2. Data types: Instant vectores;
3. PromQL operators:
○ / (division)
○ * (multiplication)
4. Query:
(node_filesystem_free_bytes / node_filesystem_size_bytes{fstype!~"none|tmpfs|sysfs", mountpoint=~"/var/.*", instance=”172.27.68.163:9030”} )* 100
5. Analyze query result and define method, critical and warning value
# HELP node_filesystem_free_bytes Filesystem free space in bytes.
# TYPE node_filesystem_free_bytes gauge
node_filesystem_free_bytes{device="shm",fstype="ext4",mountpoint="/var"} 1.01808578e+10
…
# HELP node_filesystem_size_bytes Filesystem size in bytes.
# TYPE node_filesystem_size_bytes gauge
node_filesystem_size_bytes{device="shm",fstype="ext4",mountpoint="/var"} 1.05017712e+10
…
How to integrate Icinga with Prometheus?
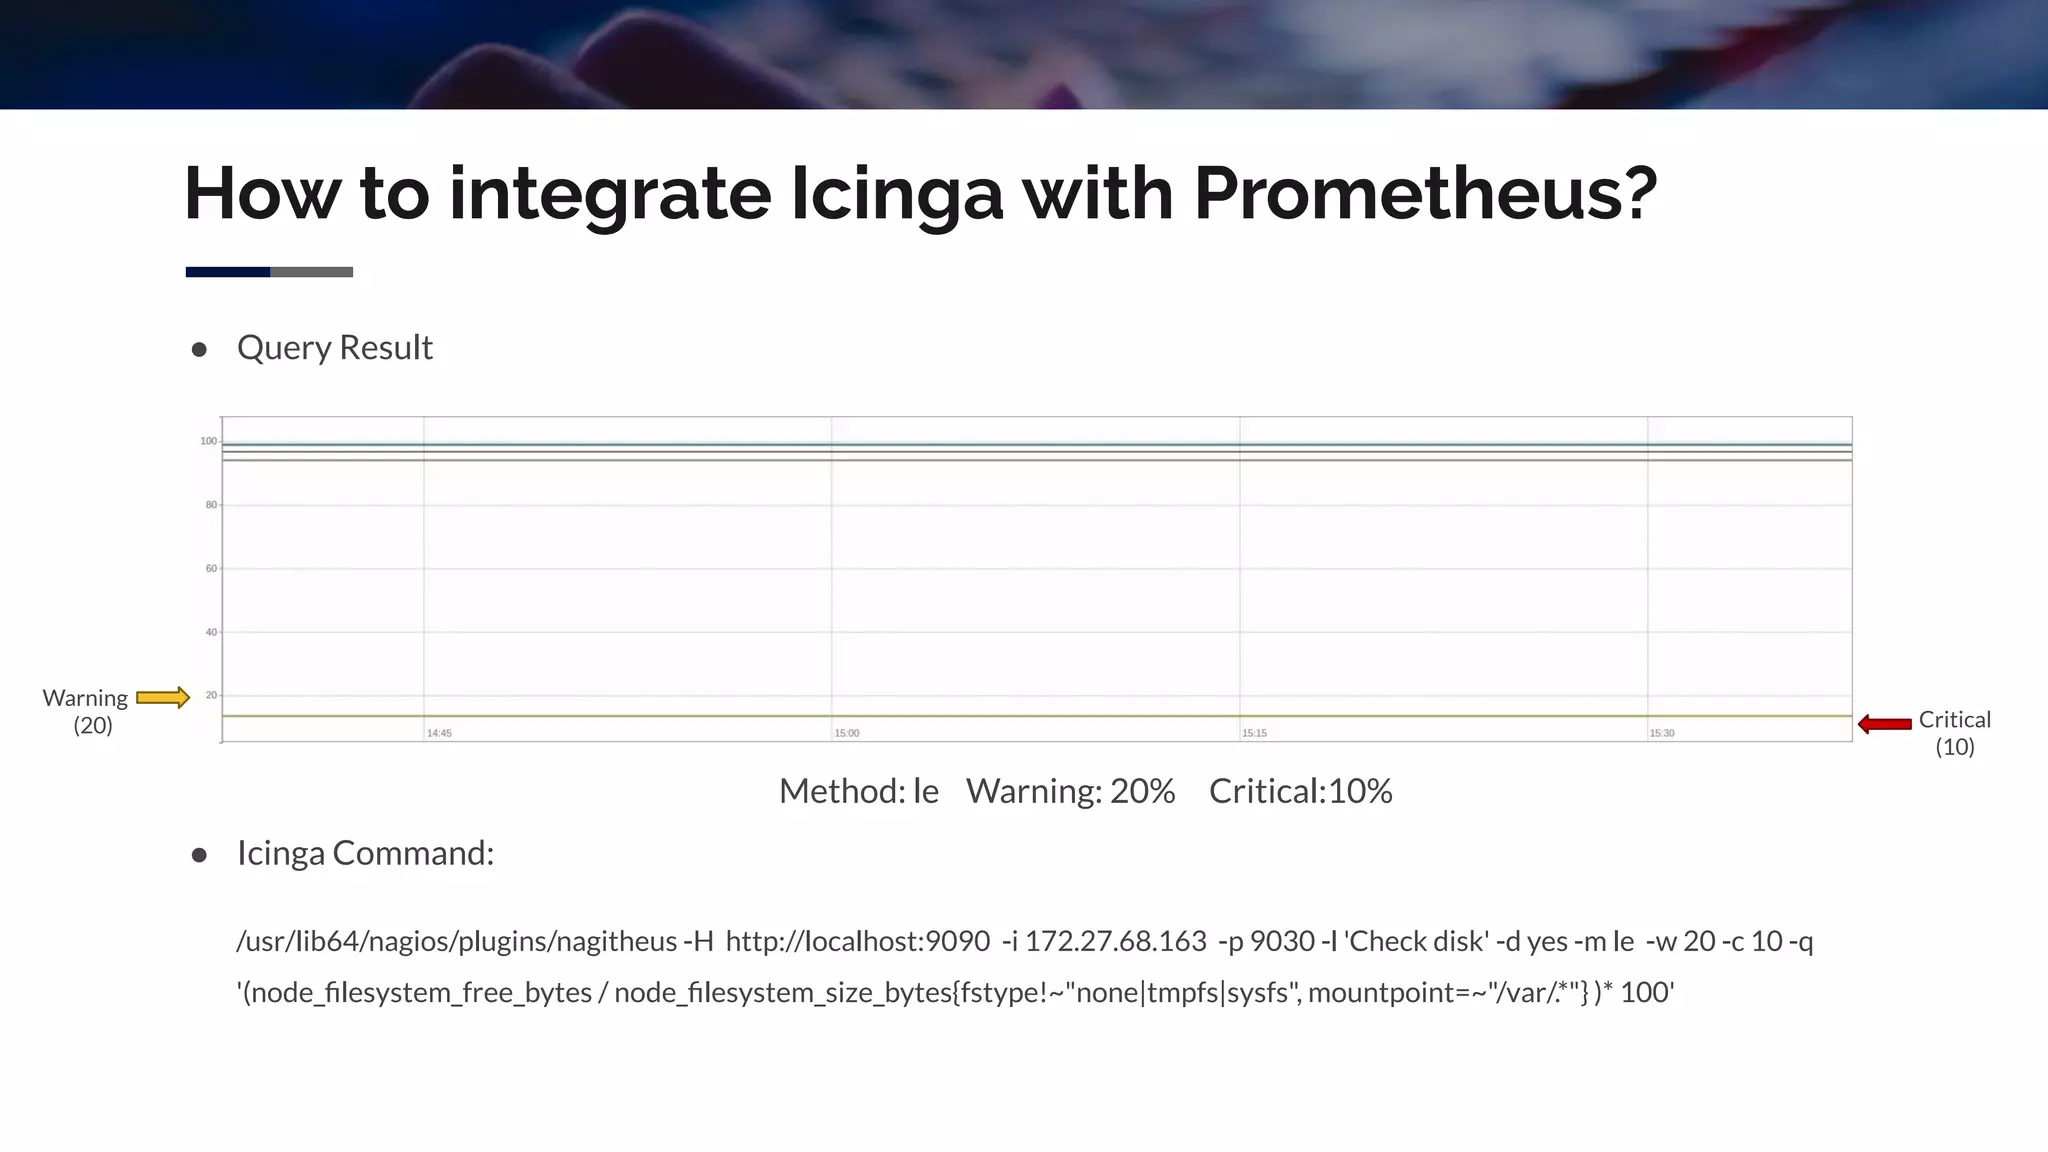
● Query Result
Method: le Warning: 20% Critical:10%
● Icinga Command:
/usr/lib64/nagios/plugins/nagitheus -H http://localhost:9090 -i 172.27.68.163 -p 9030 -l 'Check disk' -d yes -m le -w 20 -c 10 -q
'(node_filesystem_free_bytes / node_filesystem_size_bytes{fstype!~"none|tmpfs|sysfs", mountpoint=~"/var/.*"} )* 100'
Warning
(20) Critical
(10)
Questions?
DevOps Braga #15: Agentless monitoring with icinga and prometheus

DevOps Braga #15: Agentless monitoring with icinga and prometheus

  • 1.
  • 2.
    Thank you Hosted bySponsored by
  • 3.
    Today ● Agentless monitoringwith Icinga and Prometheus by Diogo Machado ● Coffee break and networking
  • 4.
    Agentless monitoring withIcinga and Prometheus Diogo Machado dgm@eurotux.com 04/11/2019 DevOps Braga #15
  • 5.
    Agenda ● From Icingato Prometheus ● Prometheus Basic Concepts ● Prometheus Server Configuration ● Getting data into Prometheus ● Implement custom metrics ● How to integrate Icinga with Prometheus?
  • 6.
    From Icinga toPrometheus - Introduction ● Open-source computer system and network monitoring application; ● Monitor the availability of hosts and services; ● Distributed Monitoring; ● Agent Based Monitoring; ● Notifications and Downtimes; ● Written in PHP and C++; ● Open-source systems monitoring and alerting toolkit; ● Monitoring of highly service-oriented architectures; ● Collect metrics with Exporters; ● Store aggregated metrics; ● Written in Go;
  • 7.
    From Icinga toPrometheus - Comparison ● Alerting based on the exit codes of Checks; ● Host-based; ● There is no notion of labels or query language. ● No storage per-se, beyond the check state; ● All configuration are made via file; ● Monitoring of small and/or static systems where blackbox probing is sufficient. ● Multi-dimensional data model with time series data; ● Rule-based alerts; ● Prometheus Query Language - PromQL; ● Centralized data store; ● Suitable for dynamic or cloud based environment - Whitebox monitoring;
  • 8.
    From Icinga toPrometheus - Comparison If there are both to system monitoring…. Why not choose only one? What does Prometheus have that Icinga doesn't have? Why should we combine both?
  • 9.
    From Icinga toPrometheus - Conclusion So … Why should we combine both? ● Prometheus have: ○ Exporters to third-party systems and applications; ○ Centralized control and HTTP API; ● Icinga have: ○ Easy configuration of host and services (Icinga Director); ○ Good alerting system with notifications and schedule downtimes; Combine to get the best of each one: ● Scrape metrics with Prometheus ● Configure and Alert with Icinga
  • 10.
    Prometheus's main featuresare: ● multi-dimensional data model with time series data identified by metric name and key/value pairs; ● PromQL, a flexible query language to leverage this dimensionality; ● no reliance on distributed storage - single server nodes are autonomous; ● time series collection happens via a pull model over HTTP; ● pushing time series is supported via an intermediary gateway; ● targets are discovered via service discovery or static configuration; ● support for graph and dashboard mode. Prometheus Basic Concepts
  • 11.
    Prometheus Basic Concepts- Architecture The Prometheus ecosystem consists of multiple components: ● the main Prometheus server which scrapes and stores time series data; ● a Pushgateway for supporting short-lived jobs; ● specific exporters for services like HAProxy, StatsD, Graphite, etc; ● an Alertmanager to handle alerts; ● data visualization tools like Grafana;
  • 12.
    Prometheus Basic Concepts- Data Model ● Data is stored as time series: streams of timestamped values belonging to the same metric and the same set of labeled dimensions; ● Key Value Data Model: ○ Key - Metric name and a set of labels; ○ Value - Metric measuring;
  • 13.
    Prometheus Basic Concepts- Metric Types Counter ● Cumulative metric; ● Monotonically increasing counter; ● Examples: ○ Nº requests served; ○ Nº tasks completed; ○ Number of errors; Gauge ● Numerical value that can arbitrarily go up or down; ● Examples: ○ Temperature; ○ Memory usage; ○ Nº concurrent requests; Histogram ● Values are aggregated in buckets; ● Expose total sum of all observed values; ● Count of events that have been observed; ● Example: ○ Request latency; Summary ● Similar to a histogram; ● Calculates configurable quantiles over a sliding time window; ● Examples: ○ Request durations; ○ Response sizes; requests_time_seconds_bucket{app=”projectx”,le=”0.005"} 2343340162 … (buckets) requests_time_seconds_sum{app=”projectx”} 5.366133242442994e+07 requests_time_seconds_count{app=”projectx”} 3973861256 go_gc_duration_seconds{quantile="0"} 4.274e-05 … (quantiles) go_gc_duration_seconds_sum 0.467543895 go_gc_duration_seconds_count 92 Histogram Summary
  • 14.
    Prometheus Basic Concepts- Jobs and Instances ● An endpoint you can scrape is called an Instance; ● A collection of instances with the same purpose is called a Job; ● Prometheus scrapes a Target and attaches labels automatically: job name, instance host and port; ● Example of job with 3 instances: job: 1: instance 1: 128.0.0.1:9030 instance 2: 128.0.0.2:9030 instance 3: 128.0.0.3:9030
  • 15.
    Prometheus Basic Concepts- PromQL Expression language data types: ● Instant vector - a set of time series containing a single sample for each time series; ○ Example: http_requests_total{environment=~"staging|development",method!="GET"} ● Range vector - a set of time series containing a range of data points for each time series; ○ Example: http_requests_total{job="prometheus"}[5m] ● Scalar - a simple numeric floating point value; ○ Example: -2.43 ● String - a simple string value; ○ Example: 'these are unescaped: n t'
  • 16.
    Prometheus Basic Concepts- REST API ● Response format is JSON: ● Methods: GET, POST ● Endpoints: ○ /api/v1/query ○ /api/v1/query_range ○ /api/v1/series ○ /api/v1/labels ○ /api/v1/targets ○ /api/v1/rules ○ /api/v1/targets/metadata ○ /api/v1/status/config ○ /api/v1/status/flags
  • 17.
    Prometheus Basic Concepts- Scrape Metrics ● Prometheus works essentially pulling metrics metadata from targets; ● Pulling over HTTP offers a number of advantages: ○ Easily tell if a target is down; ○ Manually inspect target health with a web browser. ● However, push model can be implemented with Pushgateway: ○ Intermediary service which allows to push metrics from jobs that cannot be scraped; ○ Disadvantages: ■ Pushgateway becomes both a single point of failure (SPOF) and a potential bottleneck; ■ Lose Prometheus's automatic instance health monitoring via the UP metric.
  • 18.
    Prometheus Server -Installation ● Using pre-compiled binaries; ● From source (Makefile); ● Using Docker (Quay.io or Docker Hub) ● Using configuration management systems: ○ Ansible ○ Chef ○ Puppet Docker command: docker run -p 9090:9090 -v /prometheus-data prom/prometheus --config.file=prometheus.yml Dockerfile: FROM prom/prometheus ADD prometheus.yml /etc/prometheus/ Build: docker build -t my-prometheus . docker run -p 9090:9090 my-prometheus
  • 19.
    Prometheus Server -Configuration ● Prometheus is configured via command-line flags and a configuration file: prometheus.yml; ● Prometheus default port is 9090; ● Prometheus can reload its configuration at runtime: ○ SIGHUP to the Prometheus process; ○ HTTP POST request to the “/-/reload” endpoint (when the --web.enable-lifecycle flag is enabled). ● Recording rules and Alerting rules should be written in a YAML file (rule_files); ● It’s possible to use service discovery mechanism to automatically update scrape target list; global: scrape_interval: 15s scrape_timeout: 10s evaluation_interval: 15s external_labels: environment: tst rule_files: - /opt/prometheus/rules/*.rules scrape_configs: - job_name: node scrape_interval: 30s metrics_path: /metrics scheme: http ec2_sd_configs: - endpoint: "" region: eu-west-3 refresh_interval: 1m port: 9100 alerting: alertmanagers: - static_configs: - targets: - localhost:9093 scheme: http timeout: 10s api_version: v1
  • 20.
  • 21.
    Prometheus Server Targets andRules Targets and Rules defined on Prometheus configuration
  • 22.
    Getting data intoPrometheus ● Data can be export to Prometheus using Pushgateway or via Exporter; ● Prometheus have multiple Exporters, of which stand out: ○ Node/system metrics exporter; ○ MySQL server exporter; ○ Memcached exporter; ○ Kafka exporter; ○ HAProxy exporter; ○ Tomcat exporter; ○ AWS CloudWatch exporter; ● Each Exporter has a default port allocated and a route (‘/metrics’’); ● Besides official and community Exporters, it’s possible to write custom Exporters; ● Most exporters can be run as a service or using Docker;
  • 23.
    ● Pushgateway isn’tan event store but an intermediary service to push metrics from jobs that can’t be scraped; ● Deploy using binary or Docker image: ○ Example: docker run -d -p 9091:9091 prom/pushgateway ● To change the listen address, use the “--web.listen-address” flag; ● By default, Pushgateway doesn’t persist metrics. To cache them, use “--persistence.file” option; ● All pushes are done via HTTP. The interface is REST-like. Metrics are available on ‘/metrics’ route ; ● Examples: ○ echo "some_metric 3.14" | curl --data-binary @- http://localhost:9091/metrics/job/job1 ○ curl -X DELETE http://localhost:9091/metrics/job/job1 Getting data into Prometheus - Pushgateway
  • 24.
    Getting data intoPrometheus - Node Exporter ● Expose metrics of Hardware and Operating System based on collectors, usually running on port 9100; ● By default, there is a specific set of collectors for each operating system: cpu, diskstats, filesystem, netstat, nfs, textfile, … ● Others can be enabled with collector option: ntp, processes, systemd, … ○ Example: --collector.processes ● Exporter can be run using third-party repository for RHEL/CentOS/Fedora (Corp), using the source code or using Docker; ○ Example: docker run -d --net=”host” --pid=”host” -v “/:/host:ro” prom/node-exporter --path.rootfs=/host --collector.ntp --collector.processes --collector.textfile.directory /var/lib/node_exporter/textfile_collector --cap-add=SYS_TIME
  • 25.
    Implement custom metricson Node Exporter ● Custom metrics can be implemented with textfile collector; ● Textfile collector is similar to Pushgateway, in that it allows exporting of statistics from batch jobs; ● Pushgateway should be used for service-level metrics, while textfile should be used for machine metrics; ● The collector will parse all files in textfile directory matching the glob *.prom using the text format; ● Example to automatically push logged in users on machine: echo node_users_logged_in $(who /host/var/run/utmp | wc -l) > /var/lib/node_exporter/textfile_collector/users.prom.$$ mv /var/lib/node_exporter/textfile_collector/users.prom.$$ /var/lib/node_exporter/textfile_collector/users.prom
  • 26.
    Getting data into Prometheus- Node Exporter Example of metrics available at endpoint “/metrics”
  • 27.
    Prometheus query Node ExporterData Example of a query in PromQL to check CPU usage
  • 28.
    How to integrateIcinga with Prometheus? ● Icinga can be integrated with Prometheus via Nagitheus (Claranet); ● Nagitheus is a Nagios plugin for querying Prometheus, written in Go; ● Nagitheus process vector or scalar results and return an exit code, according with warning/critical values and comparison method (ge, gt, le, lt); ● Allows basic authentication on Prometheus with username and password (-u and -pw options); ● Example: /usr/lib64/nagios/plugins/nagitheus -H http://localhost:9090 -i 10.0.0.10 -p 9100 -l 'Check CPU' -d yes -q '(avg by (mode) (irate(node_cpu_seconds_total{instance="", mode!="idle"}[5m])) * 100)' -m ge -w 70 -c 80
  • 29.
    How to integrateIcinga with Prometheus? ● Basic Linux Checks: ○ CPU ○ Disk ○ Load ○ Memory ○ Total procs ○ Ntp ● Steps to implement a check: ○ Identify metrics to use on query; ○ Create query considering PromQL operators and metric types; ○ Test query on Promehteus and define label, method and critical/warning values; ○ Implement icinga command using the query and values specified for each option.
  • 30.
    How to integrateIcinga with Prometheus? ● Check Disk (Percentage of disk free): 1. Metrics to use on check: ○ node_filesystem_free_bytes ○ node_filesystem_size_bytes 2. Data types: Instant vectores; 3. PromQL operators: ○ / (division) ○ * (multiplication) 4. Query: (node_filesystem_free_bytes / node_filesystem_size_bytes{fstype!~"none|tmpfs|sysfs", mountpoint=~"/var/.*", instance=”172.27.68.163:9030”} )* 100 5. Analyze query result and define method, critical and warning value # HELP node_filesystem_free_bytes Filesystem free space in bytes. # TYPE node_filesystem_free_bytes gauge node_filesystem_free_bytes{device="shm",fstype="ext4",mountpoint="/var"} 1.01808578e+10 … # HELP node_filesystem_size_bytes Filesystem size in bytes. # TYPE node_filesystem_size_bytes gauge node_filesystem_size_bytes{device="shm",fstype="ext4",mountpoint="/var"} 1.05017712e+10 …
  • 31.
    How to integrateIcinga with Prometheus? ● Query Result Method: le Warning: 20% Critical:10% ● Icinga Command: /usr/lib64/nagios/plugins/nagitheus -H http://localhost:9090 -i 172.27.68.163 -p 9030 -l 'Check disk' -d yes -m le -w 20 -c 10 -q '(node_filesystem_free_bytes / node_filesystem_size_bytes{fstype!~"none|tmpfs|sysfs", mountpoint=~"/var/.*"} )* 100' Warning (20) Critical (10)
  • 32.