Download as PDF, PPTX


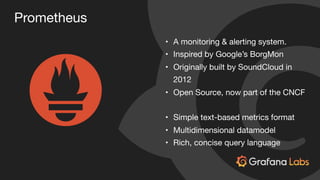
![Prometheus’ data model is very simple:
<identifier> → [ (t0, v0), (t1, v1), ... ]
Timestamps are millisecond int64, values are float64
https://www.slideshare.net/Docker/monitoring-the-prometheus-way-julius-voltz-prometheus](https://image.slidesharecdn.com/monitoringkuberneteswithprometheusdark-181012150316/85/Monitoring-Kubernetes-with-Prometheus-7-320.jpg)


![Can select vectors of values…
PromQL: http_requests_total{job=“nginx”, status=~“5..”}[1m]
{job=“nginx”, instances=“1.2.3.4:80”, path=“/home”, status=“500”} [30, 31, 32, 34]
{job=“nginx”, instances=“1.2.3.4:80”, path=“/settings”, status=“502”} [4, 24, 56, 56]
{job=“nginx”, instances=“2.3.4.5:80”, path=“/home”, status=“500”} [76, 76, 76, 76]
{job=“nginx”, instances=“2.3.4.5:80”, path=“/settings”, status=“502”} [56, 106, 5, 96]
...](https://image.slidesharecdn.com/monitoringkuberneteswithprometheusdark-181012150316/85/Monitoring-Kubernetes-with-Prometheus-10-320.jpg)
![And apply functions…
PromQL: rate(http_requests_total{job=“nginx”, status=~“5..”}[1m])
{job=“nginx”, instances=“1.2.3.4:80”, path=“/home”, status=“500”} 0.0666
{job=“nginx”, instances=“1.2.3.4:80”, path=“/settings”, status=“502”} 0.866
{job=“nginx”, instances=“2.3.4.5:80”, path=“/home”, status=“500”} 0.0
{job=“nginx”, instances=“2.3.4.5:80”, path=“/settings”, status=“502”} 2.43
...](https://image.slidesharecdn.com/monitoringkuberneteswithprometheusdark-181012150316/85/Monitoring-Kubernetes-with-Prometheus-11-320.jpg)
![And aggregate by a dimension…
PromQL: sum by (path) (rate(http_requests_total{job=“nginx”, status=~“5..”}[1m]))
{path=“/home”} 0.0666
{path=“/settings”} 3.3
...](https://image.slidesharecdn.com/monitoringkuberneteswithprometheusdark-181012150316/85/Monitoring-Kubernetes-with-Prometheus-12-320.jpg)
![Do binary operations…
PromQL: sum by (path) (rate(http_requests_total{job=“nginx”, status=~“5..”}[1m]))
/
sum by (path) (rate(http_requests_total{job=“nginx”}[1m]))
{path=“/home”} 0.001
{path=“/settings”} 1.0
...](https://image.slidesharecdn.com/monitoringkuberneteswithprometheusdark-181012150316/85/Monitoring-Kubernetes-with-Prometheus-13-320.jpg)


![USE Method
CPU Utilisation:
1 - avg(rate(node_cpu{mode=“idle"}[1m]))
CPU Saturation:
sum(node_load1)/ sum(node:node_num_cpu:sum)](https://image.slidesharecdn.com/monitoringkuberneteswithprometheusdark-181012150316/85/Monitoring-Kubernetes-with-Prometheus-22-320.jpg)

![USE Method
Container CPU usage by “app” label
sum by (namespace, label_name) (
sum by (pod_name, namespace (
rate(container_cpu_usage_seconds_total[5m])
)
* on (pod_name) group_left(label_name)
label_join(kube_pod_labels, "pod_name", ",", "pod")
)](https://image.slidesharecdn.com/monitoringkuberneteswithprometheusdark-181012150316/85/Monitoring-Kubernetes-with-Prometheus-24-320.jpg)

![RED Method
Most useful alert I’ve found:
100 * sum by(instance, job) (
rate(rest_client_requests_total{code!~”2..”}[5m])
)
/
sum by(instance, job) (
rate(rest_client_requests_total[5m])
)](https://image.slidesharecdn.com/monitoringkuberneteswithprometheusdark-181012150316/85/Monitoring-Kubernetes-with-Prometheus-26-320.jpg)
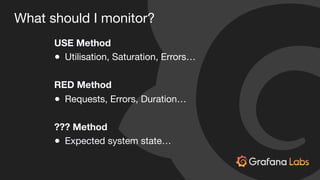
![??? Method
Alert expressions are invariants that describe a healthy
system
kube_deployment_spec_replicas !=
kube_deployment_status_replicas_available
rate(kube_pod_container_status_restarts_total
[15m]) > 0](https://image.slidesharecdn.com/monitoringkuberneteswithprometheusdark-181012150316/85/Monitoring-Kubernetes-with-Prometheus-27-320.jpg)


The document outlines the principles and practices for monitoring Kubernetes with Prometheus, including its data model, query language (PromQL), and various methods for monitoring and alerting. It emphasizes the importance of utilizing cluster and node-level metrics alongside container-level metrics for effective performance management. Resources and references for further learning, including setup guides and community projects, are also provided.


![[PromCon2018] Prometheus Monitoring Mixins: Using Jsonnet to Package Together...](https://cdn.slidesharecdn.com/ss_thumbnails/prometheusmonitoringmixins-180809132927-thumbnail.jpg?width=640&height=640&fit=bounds)


![5G Explained! A High Level Overview [Introduction]](https://cdn.slidesharecdn.com/ss_thumbnails/5gexplainedahighleveloverview-260119165306-cc137a3e-thumbnail.jpg?width=640&height=640&fit=bounds)


