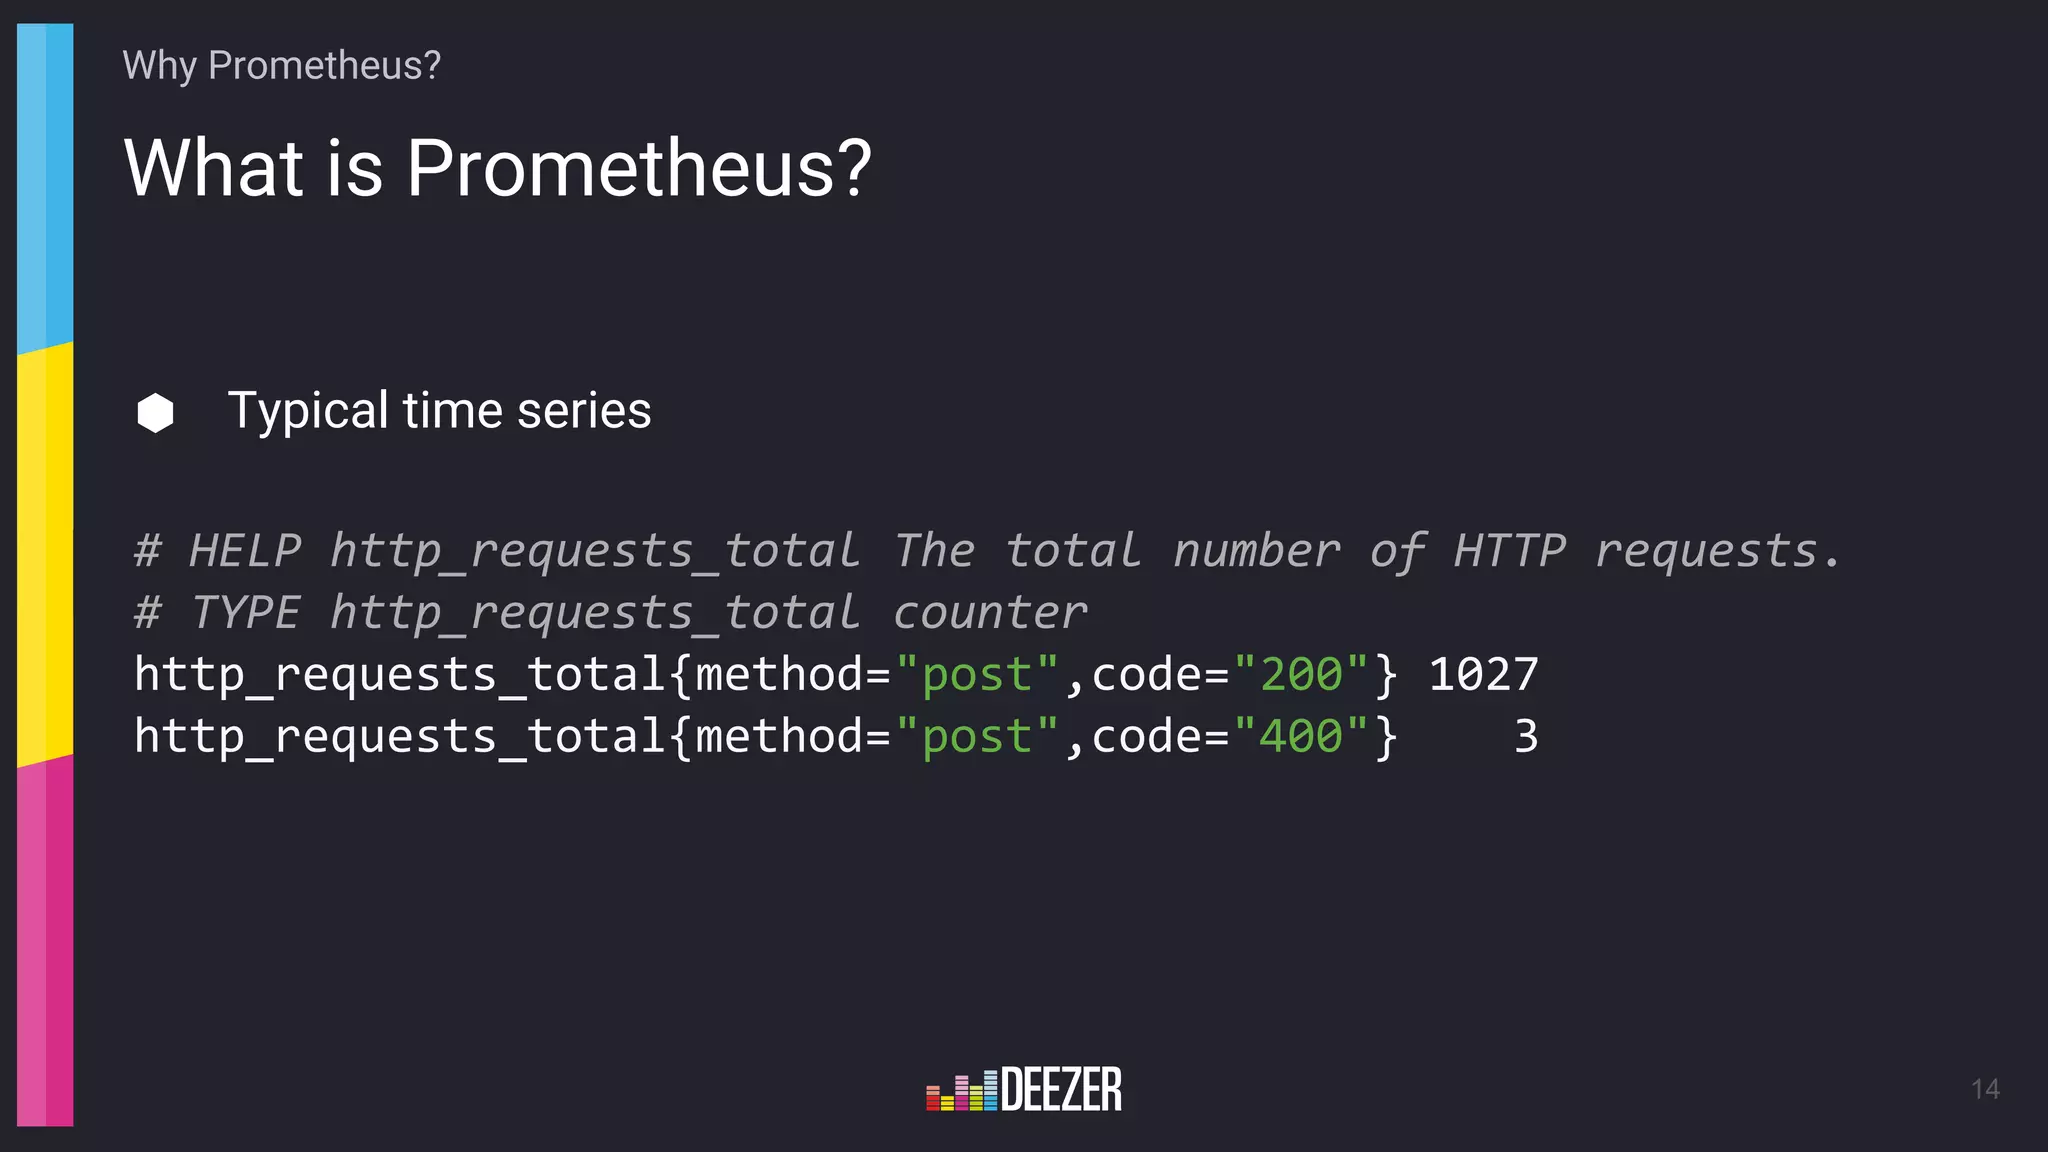
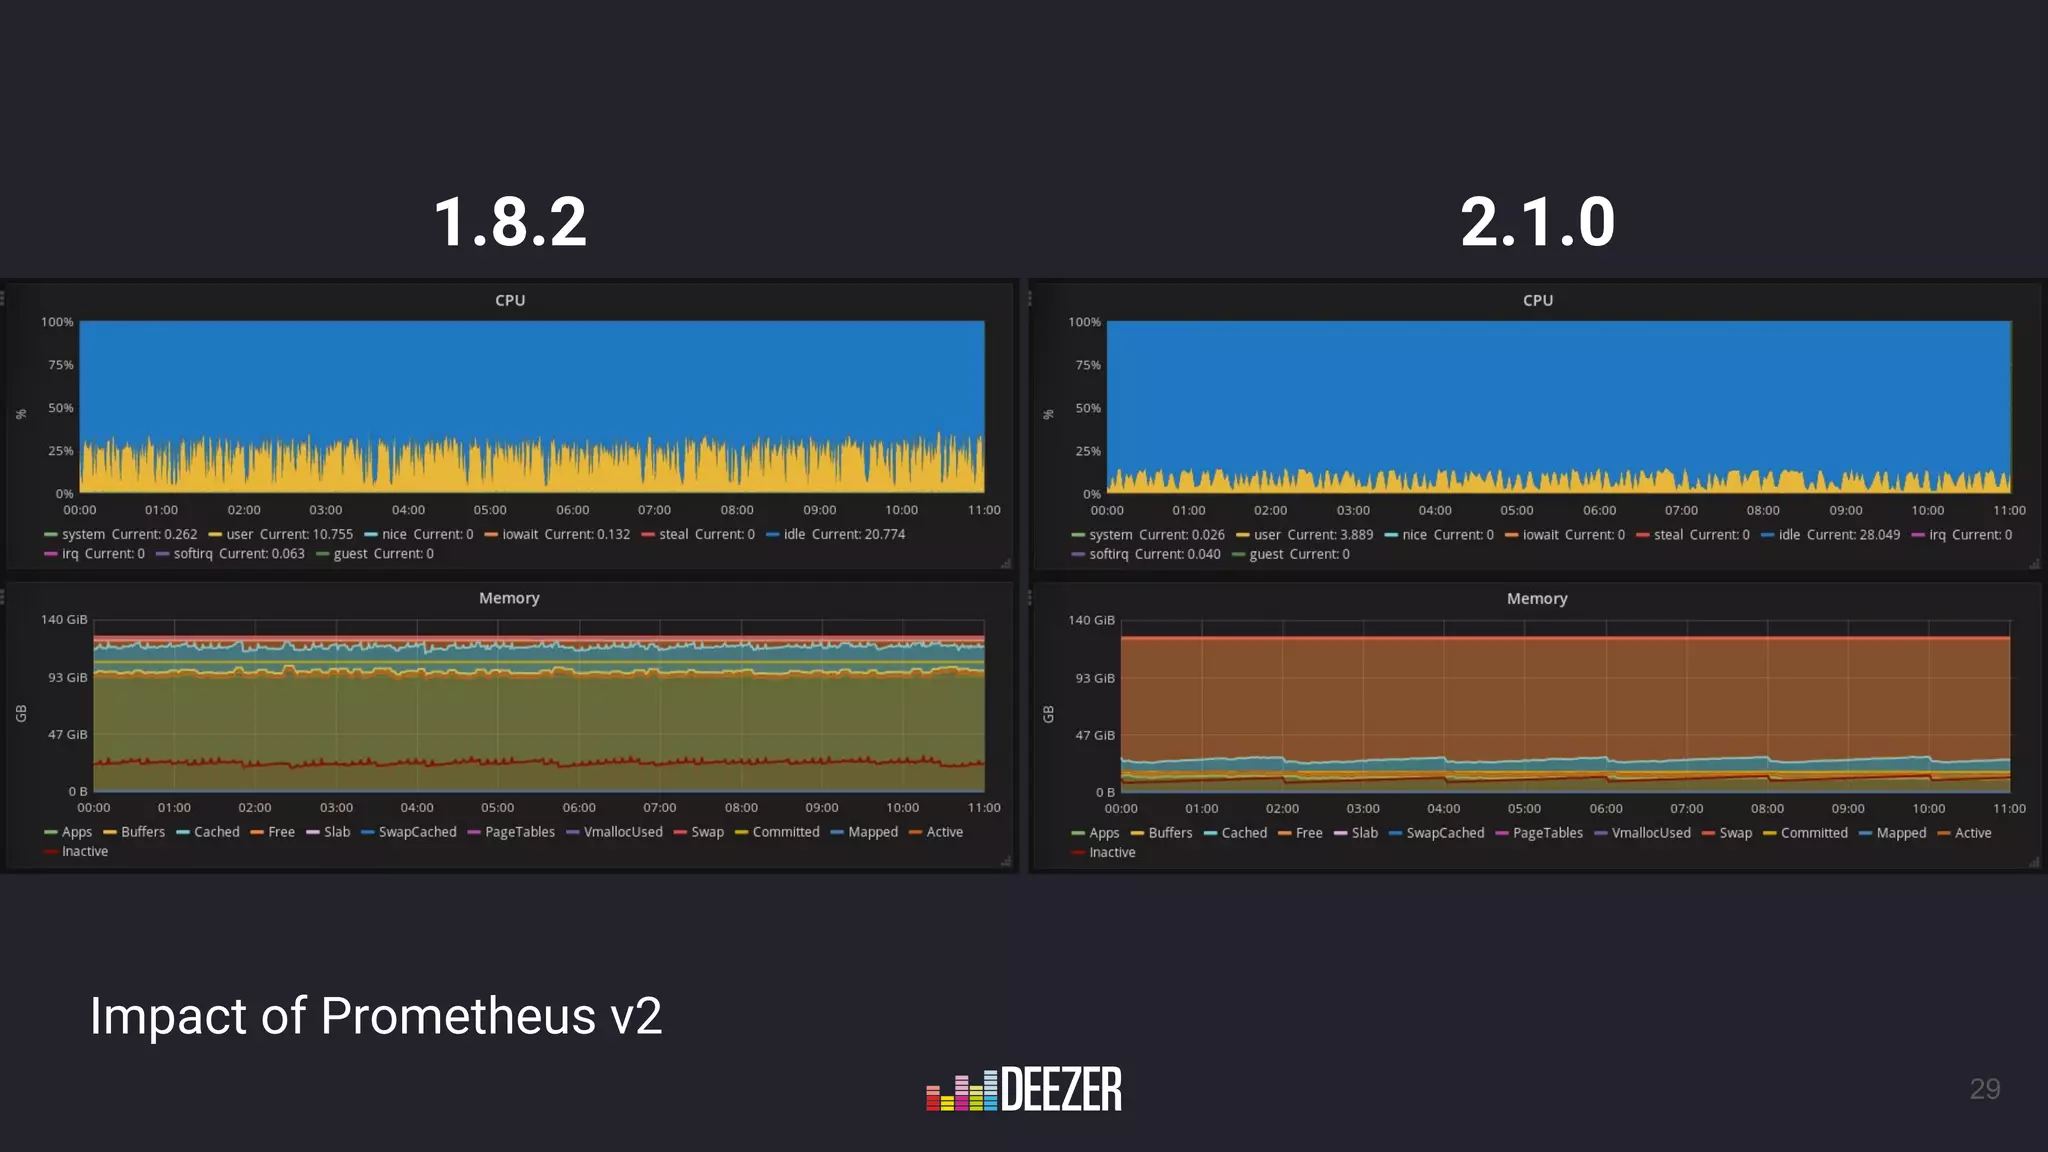
The document presents a talk by Antoine Leroy on Deezer's infrastructure and their experience implementing Prometheus for monitoring. It outlines Deezer's growth in infrastructure from 2016, the motivations for choosing Prometheus, and their technical setup using service discovery with Consul and various exporters. The presentation also touches on future monitoring goals and enhancements planned for their monitoring capabilities.


![Consul Agent configuration
22
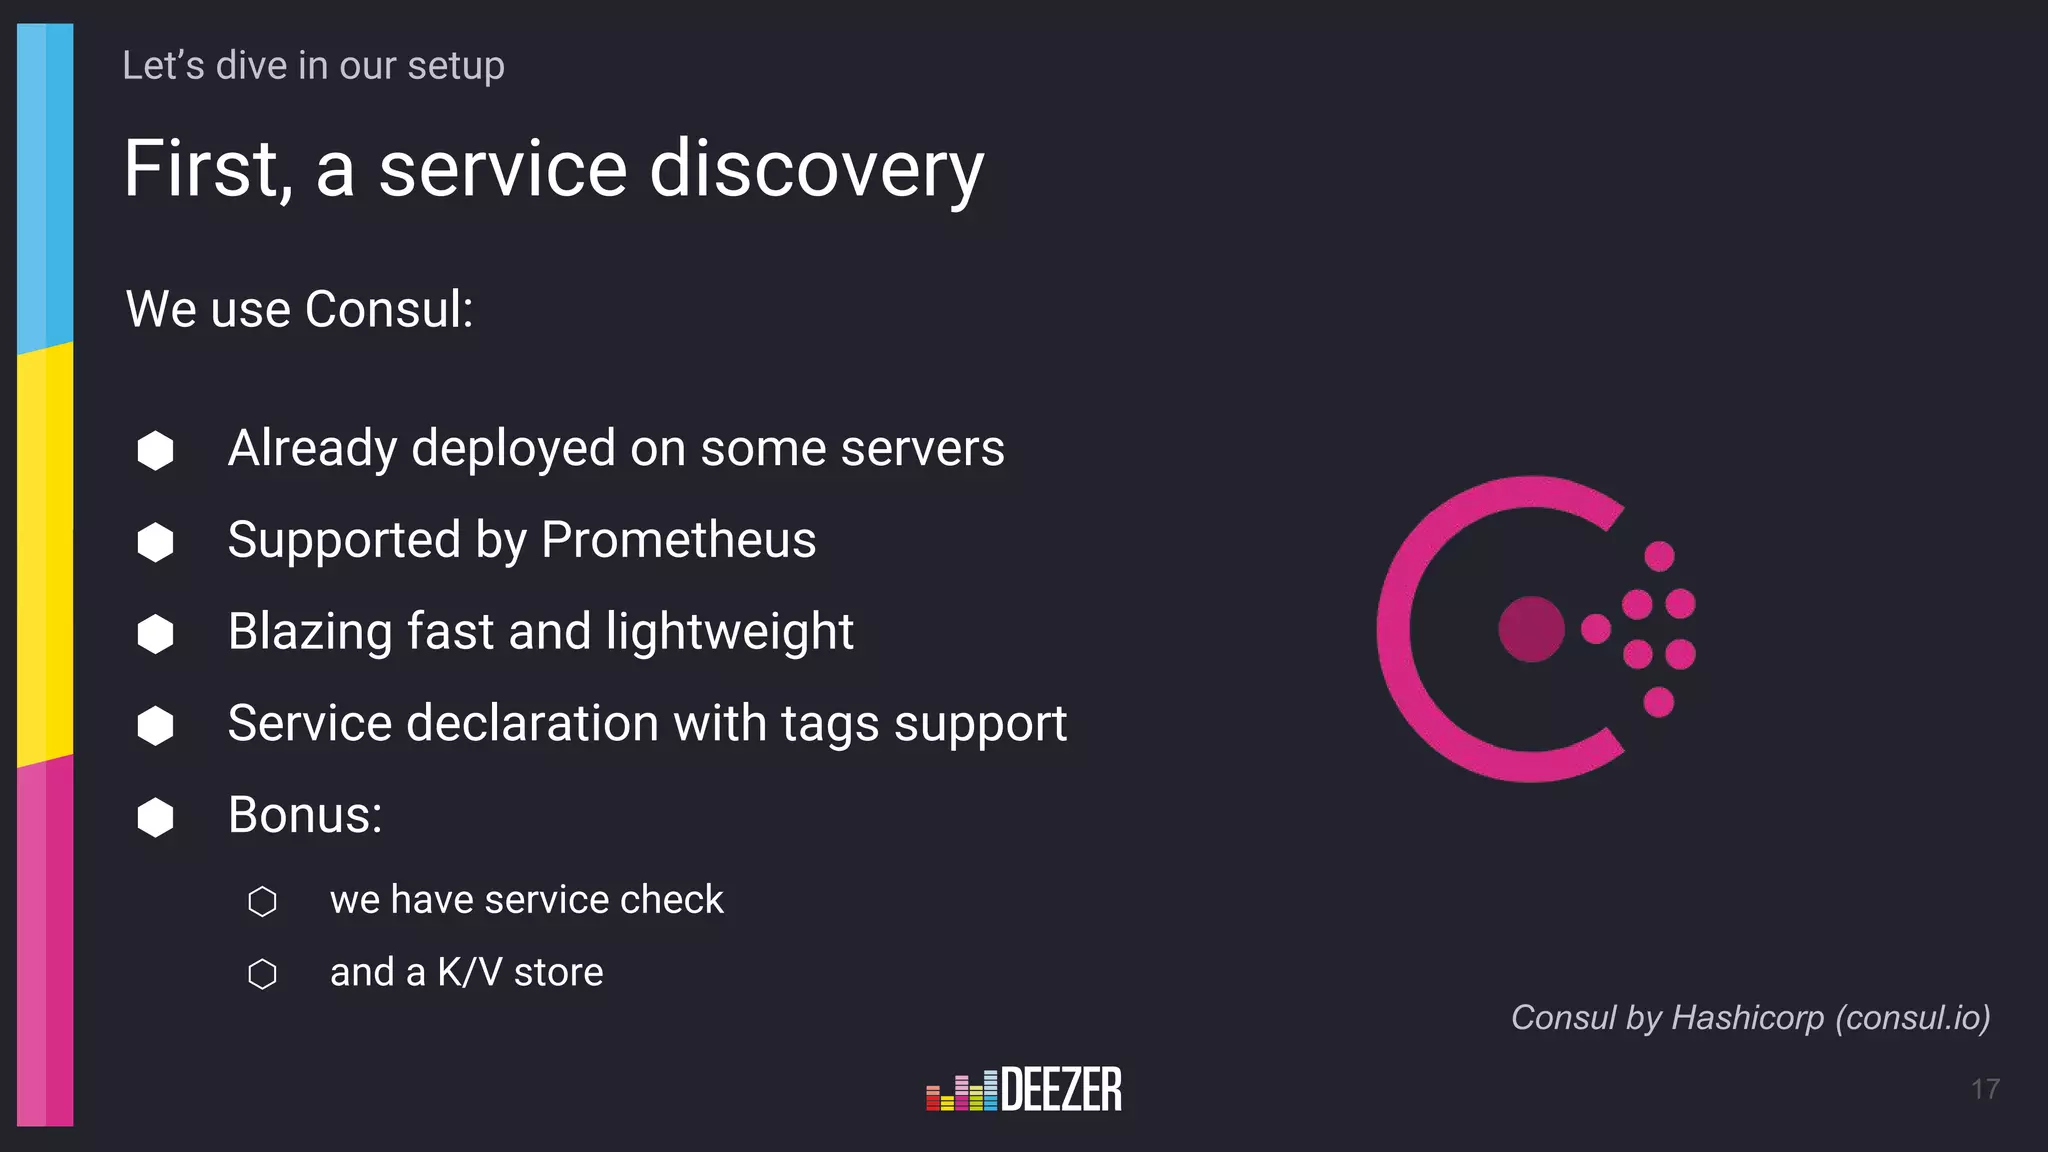
Let’s dive in our setup
port where my exporter is
listening
tag to filter
environment
# Consul Service JSON for Apache
{
"service": {
"name": "apache",
"tags": [
"prod",
"apache",
"exporter-6110"
],
"address": "",
"port": 443,
"enableTagOverride": false,
"checks": [
{
"script": "apache-check.sh",
"interval": "5s"
}
]
}
}](https://image.slidesharecdn.com/45780809191941735165-180216090702/75/From-nothing-to-Prometheus-one-year-after-22-2048.jpg)
![Prometheus relabeling: a strong feature
23
Let’s dive in our setup
⬢ Before scraping, Prometheus allow you to change/create labels
⬢ You can create labels to help you identify your metrics
# Replace job label with service name
- source_labels: [__meta_consul_service]
target_label: job
# Add datacenter label
- source_labels: [__meta_consul_dc]
target_label: dc
# Add instance name
- source_labels: [__meta_consul_node]
target_label: instance
# Create a group label from node name
- source_labels: [__meta_consul_node]
regex: ^(blm|dzr|dev)-([a-z]+)-.*
target_label: group
replacement: ${2}](https://image.slidesharecdn.com/45780809191941735165-180216090702/75/From-nothing-to-Prometheus-one-year-after-23-2048.jpg)
![Prometheus relabeling: a strong feature
24
Let’s dive in our setup
⬢ You can change internal labels of Prometheus
⬡ They start with __ and will be removed before storing the metric
⬡ You can override labels used for scraping to obtain a dynamic configuration
# Retrieve exporter port from consul tags
- source_labels: [__meta_consul_tags]
regex: .*,exporter-([0-9]+),.*
target_label: __exporter_port
replacement: ${1}
# Define addr:port to scrape
- source_labels: [__meta_consul_address,__exporter_port]
separator: ":"
target_label: __address__
replacement: ${1}](https://image.slidesharecdn.com/45780809191941735165-180216090702/75/From-nothing-to-Prometheus-one-year-after-24-2048.jpg)


![# Equal to 2/3 of your total memory
-storage.local.target-heap-size
# Set it to 5m to reduce charge on SSD
-storage.local.checkpoint-interval
# If you have a large number of time series and a low scrape interval
# you can increase this above 10k easily
-storage.local.num-fingerprint-mutexes
# If you have SSD, you can put this one really high
-storage.local.checkpoint-dirty-series-limit
33
Some 1.6.x to 1.8.x settings (in case you need it)
Let’s dive in our setup
Source: Configuring Prometheus for High Performance [A] - Björn Rabenstein, SoundCloud Ltd.](https://image.slidesharecdn.com/45780809191941735165-180216090702/75/From-nothing-to-Prometheus-one-year-after-33-2048.jpg)