Downloaded 18 times


![sort_desc(
topk(5,
sum by (image) (
irate(container_cpu_usage_seconds_total {
id=~"/docker/.*"}[5m]
)
)
)
)
33
To edit go to: Insert > Header and Footer
Fancy Query
Top 5 Docker Images by CPU](https://image.slidesharecdn.com/prometheustraining-190102235603/75/Prometheus-Training-32-2048.jpg)


![ OptimusPrime (bot)3:32 PM
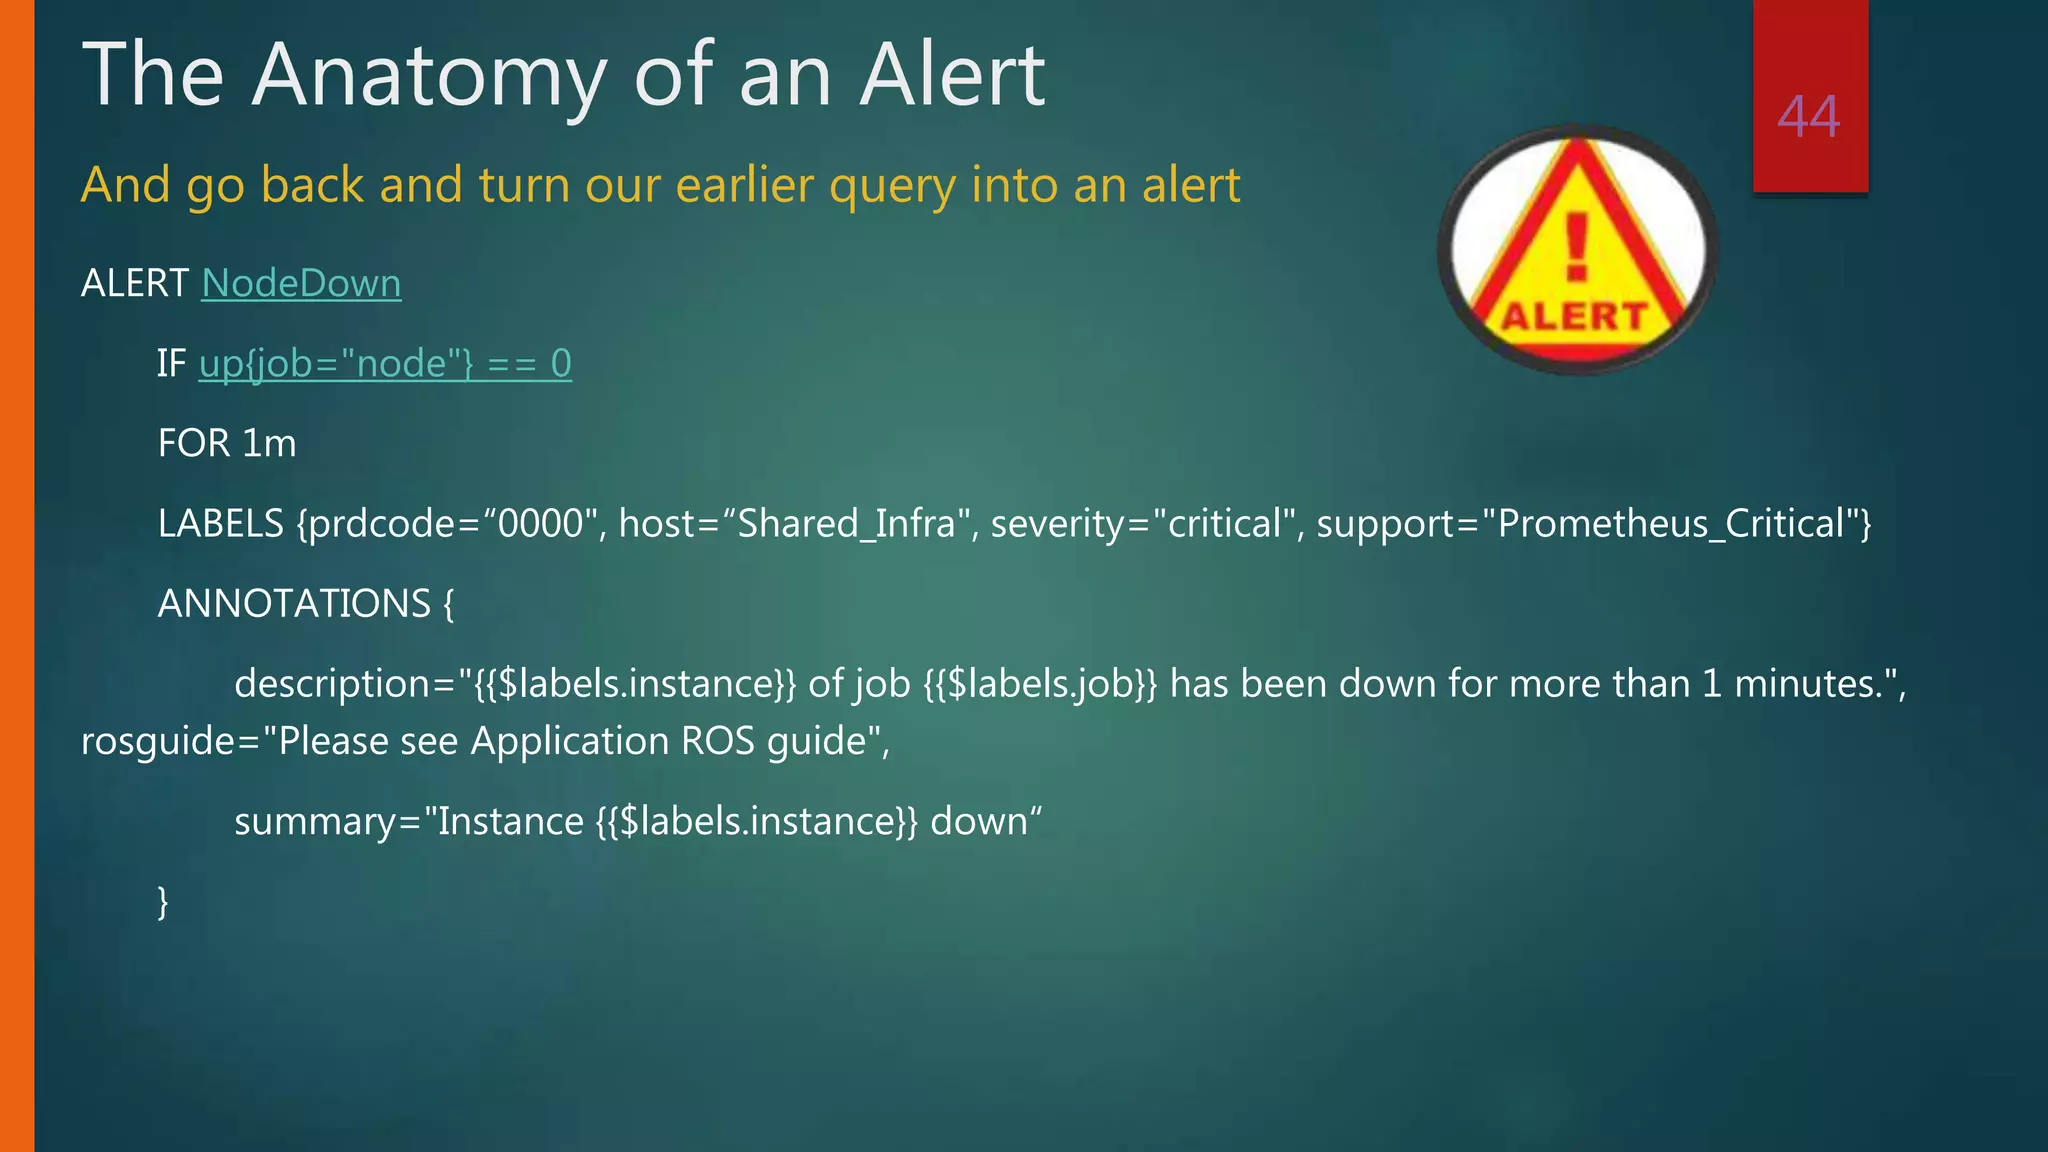
AlertManager message: [FIRING:1] NodeDown (0000 prod
node.metrics Shared_Infra node app critical
Prometheus_Critical). Learn more at
https://somewhere.dockeralerts.company.com:8443/#/alert
s?receiver=ChatBot
45
A NodeDown Alert Sent To Chat
Fate rarely calls on us at a moment of our choosing – Optimus Prime](https://image.slidesharecdn.com/prometheustraining-190102235603/75/Prometheus-Training-44-2048.jpg)


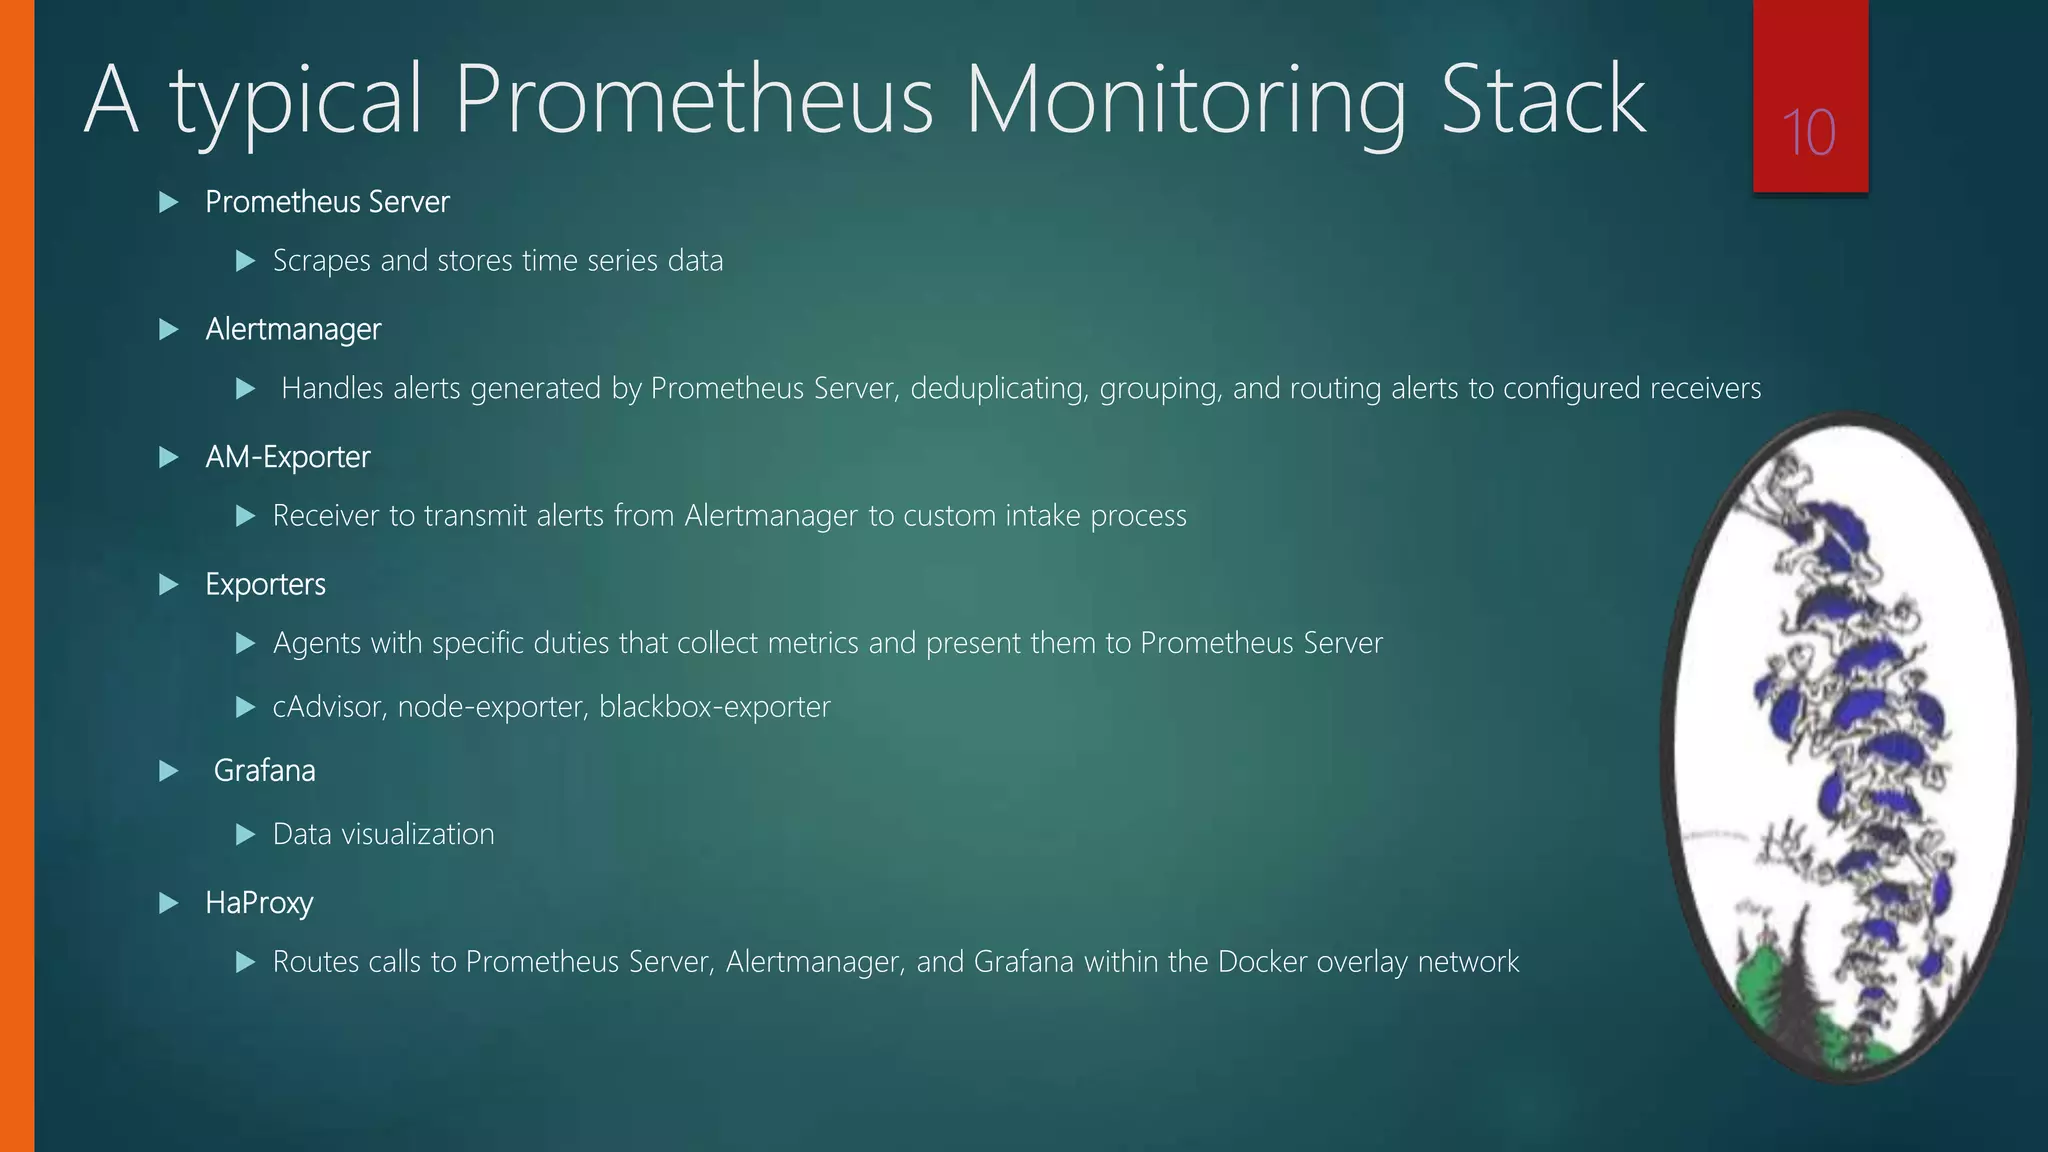
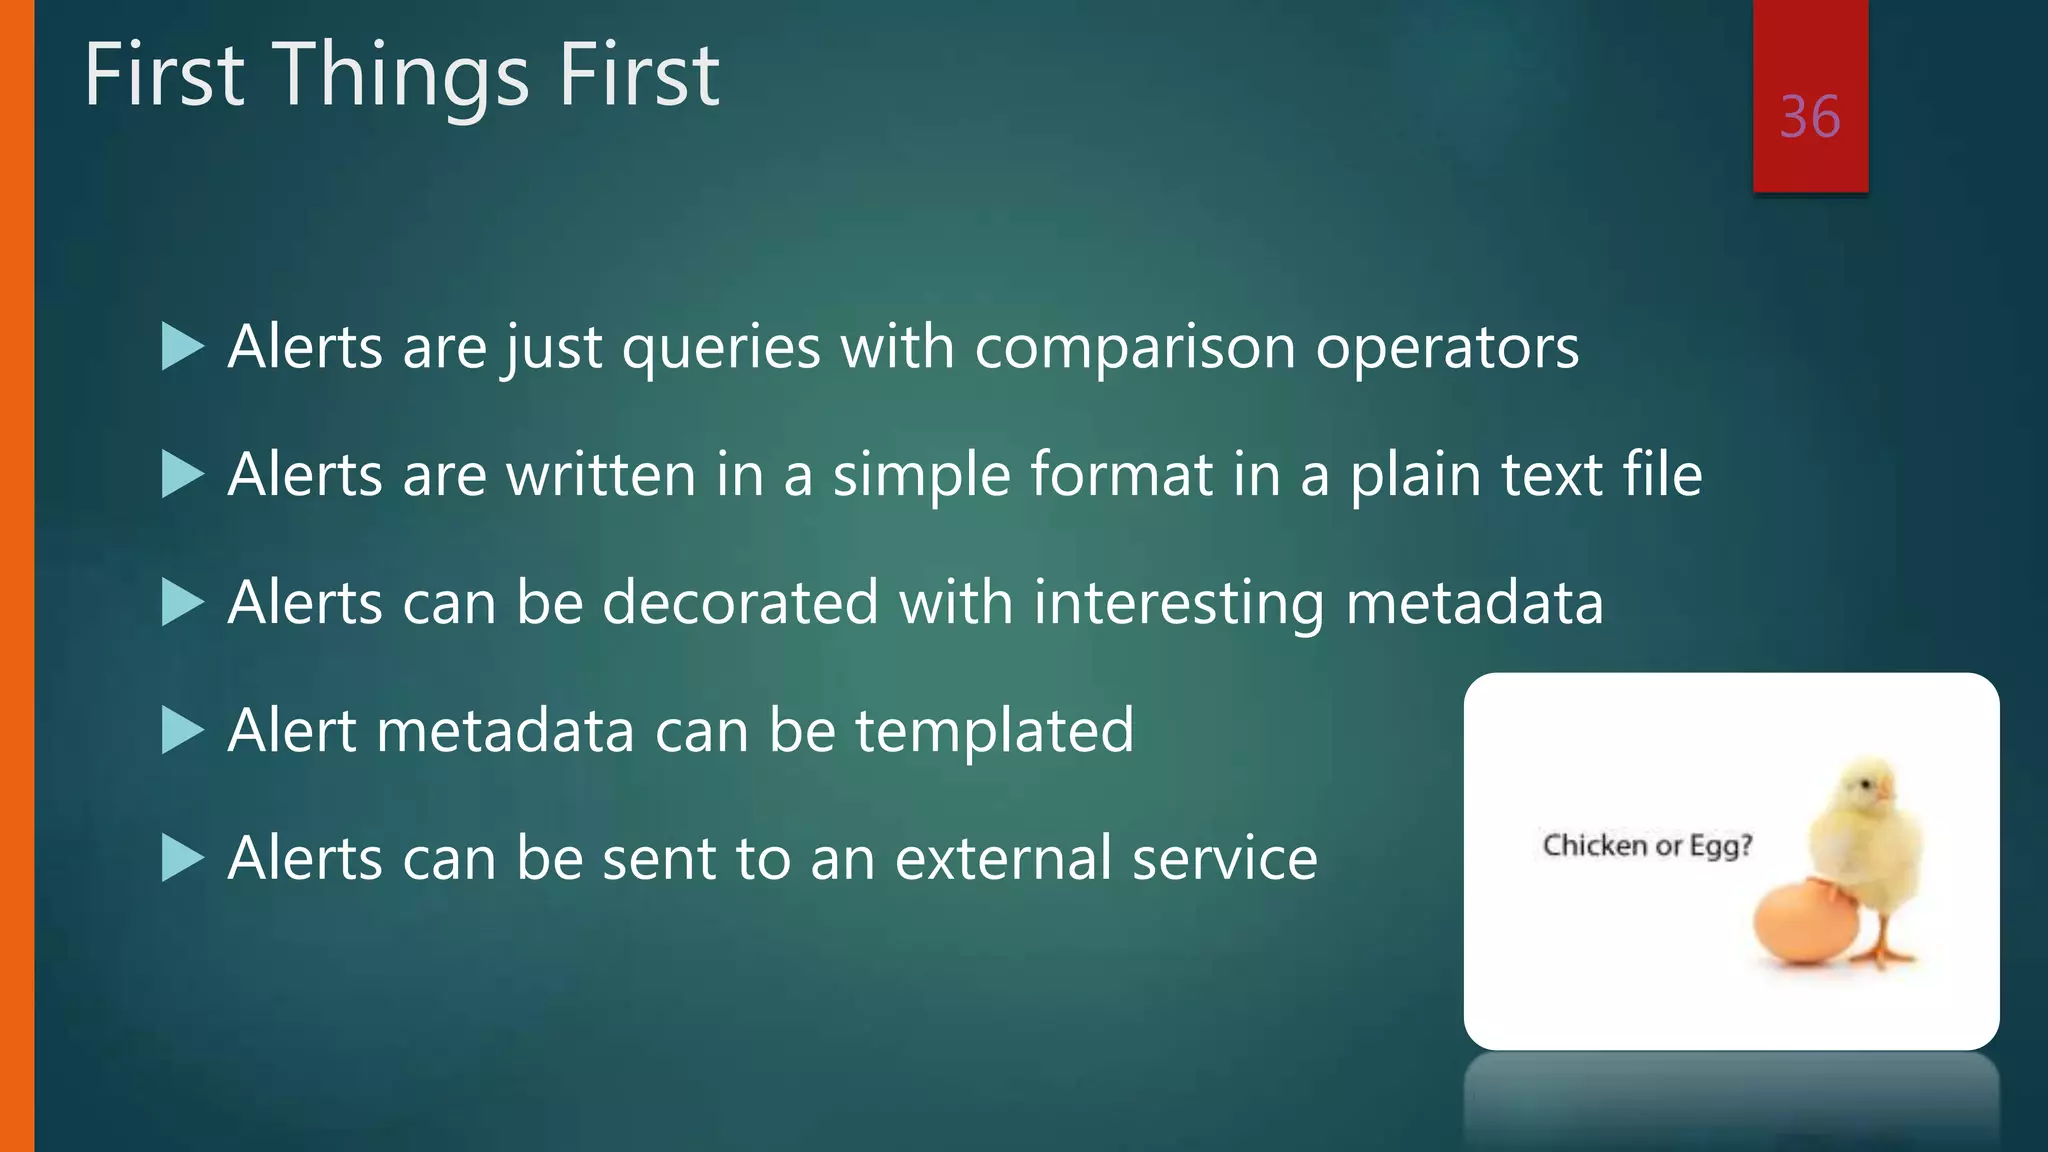
This document details a training presentation on Prometheus monitoring tailored for Docker Enterprise Edition, with content reflecting the state of tools as of 2017. It discusses the complexities of monitoring containerized environments, introduces Prometheus as a primary monitoring solution, and outlines the architecture, components, and functionalities of a typical Prometheus monitoring stack. While the information is somewhat dated, it provides foundational insights for potential updates and implementations in monitoring systems.


![Vibe Coding vs. Spec-Driven Development [Free Meetup]](https://cdn.slidesharecdn.com/ss_thumbnails/vibecodingvsspecdrivendevelopment-251209105622-43f455e7-thumbnail.jpg?width=640&height=640&fit=bounds)


