Downloaded 71 times
![Multiple Dimensions
from prometheus_client import Counter
REQUESTS = Counter('requests_total',
'Total requests', ['method'])
def my_handler(request):
REQUESTS.labels(request.method).inc()
pass // Your code here](https://image.slidesharecdn.com/fermilabtalk2018-prometheusformonitoringmetrics-180509154403/75/Prometheus-for-Monitoring-Metrics-Fermilab-2018-11-2048.jpg)
![Analytics: Top 5 Docker images by CPU
topk(5,
sum by (image)(
rate(container_cpu_usage_seconds_total{
id=~"/system.slice/docker.*"}[5m]
)
)
)](https://image.slidesharecdn.com/fermilabtalk2018-prometheusformonitoringmetrics-180509154403/75/Prometheus-for-Monitoring-Metrics-Fermilab-2018-15-2048.jpg)


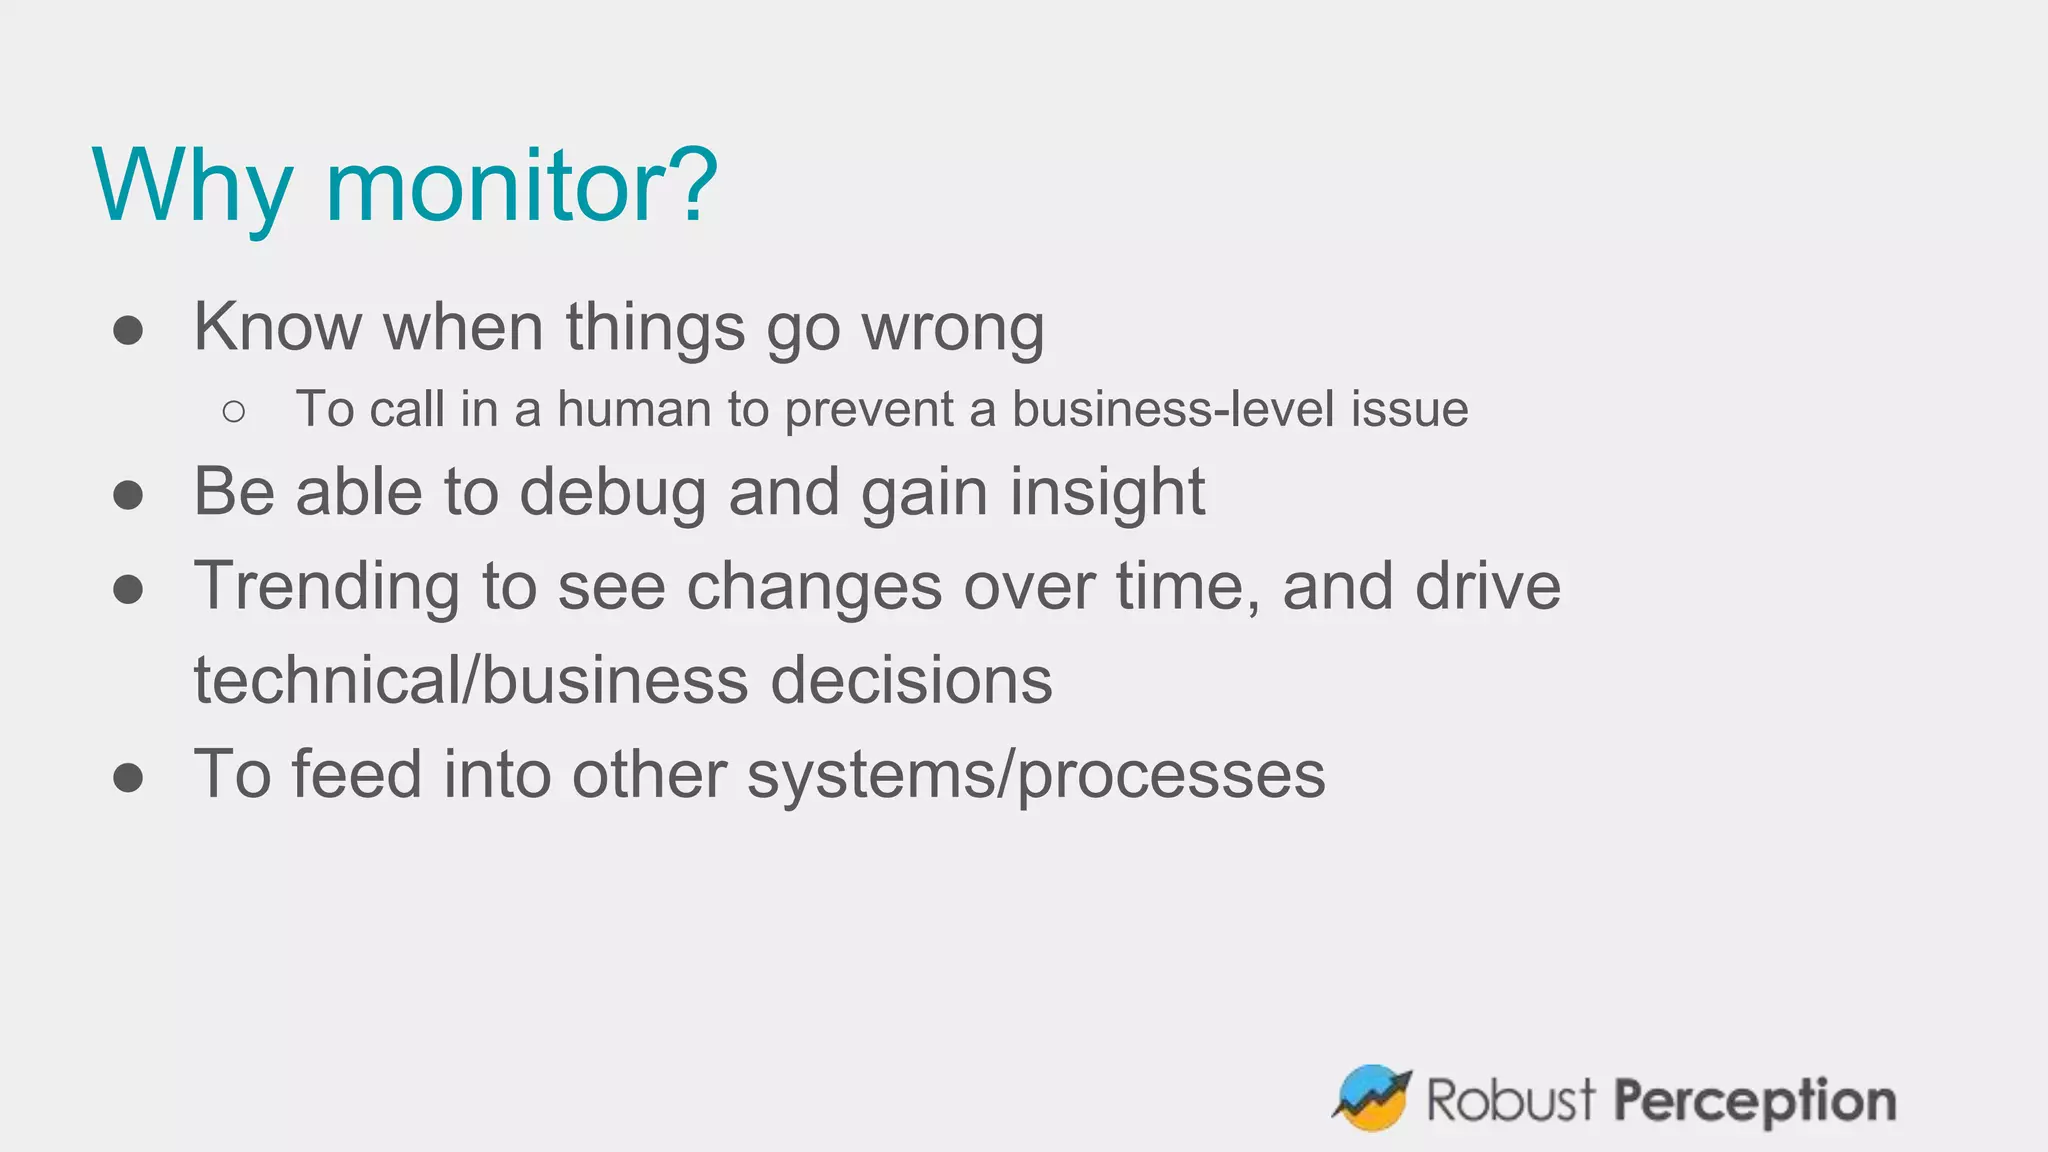
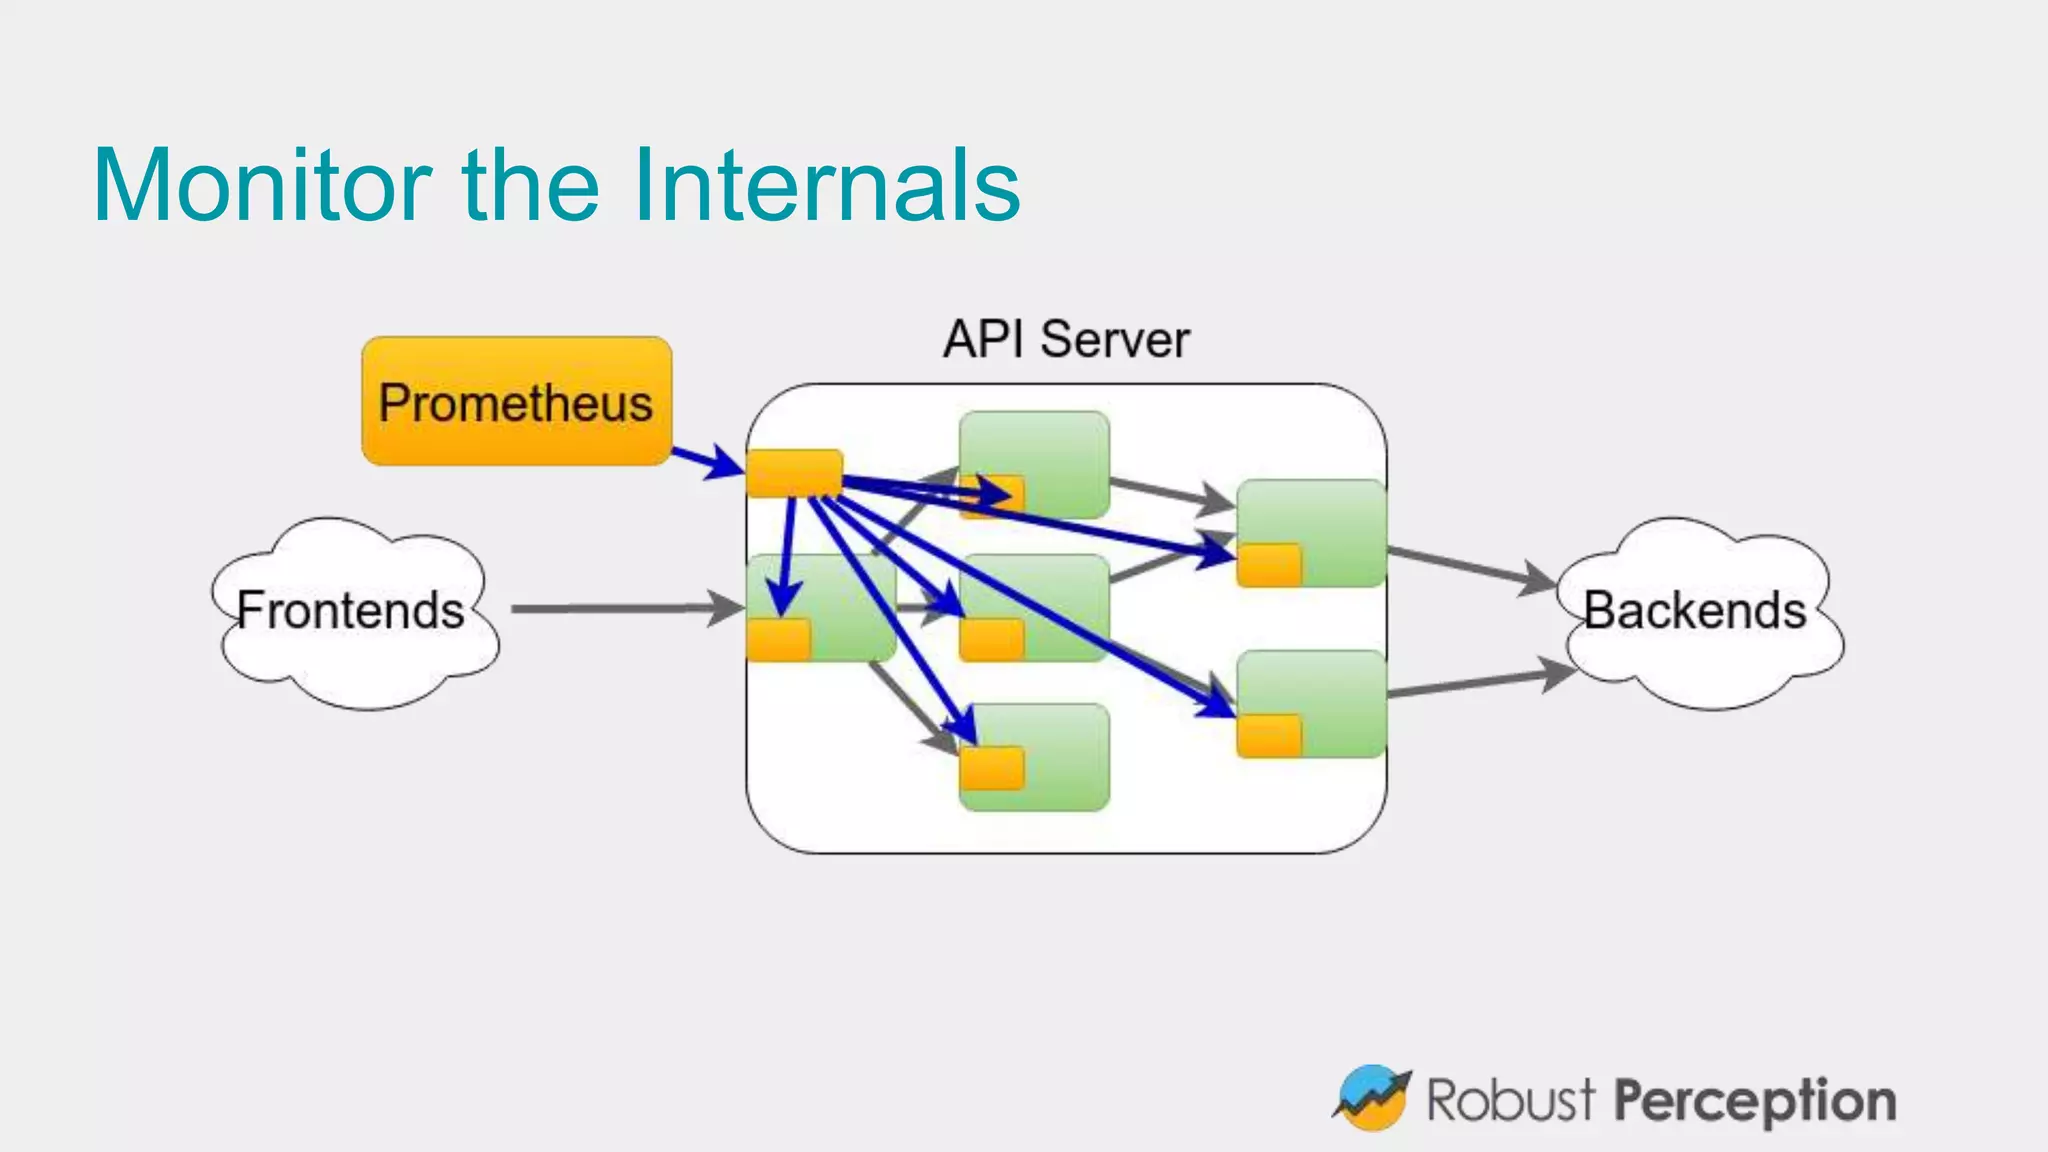
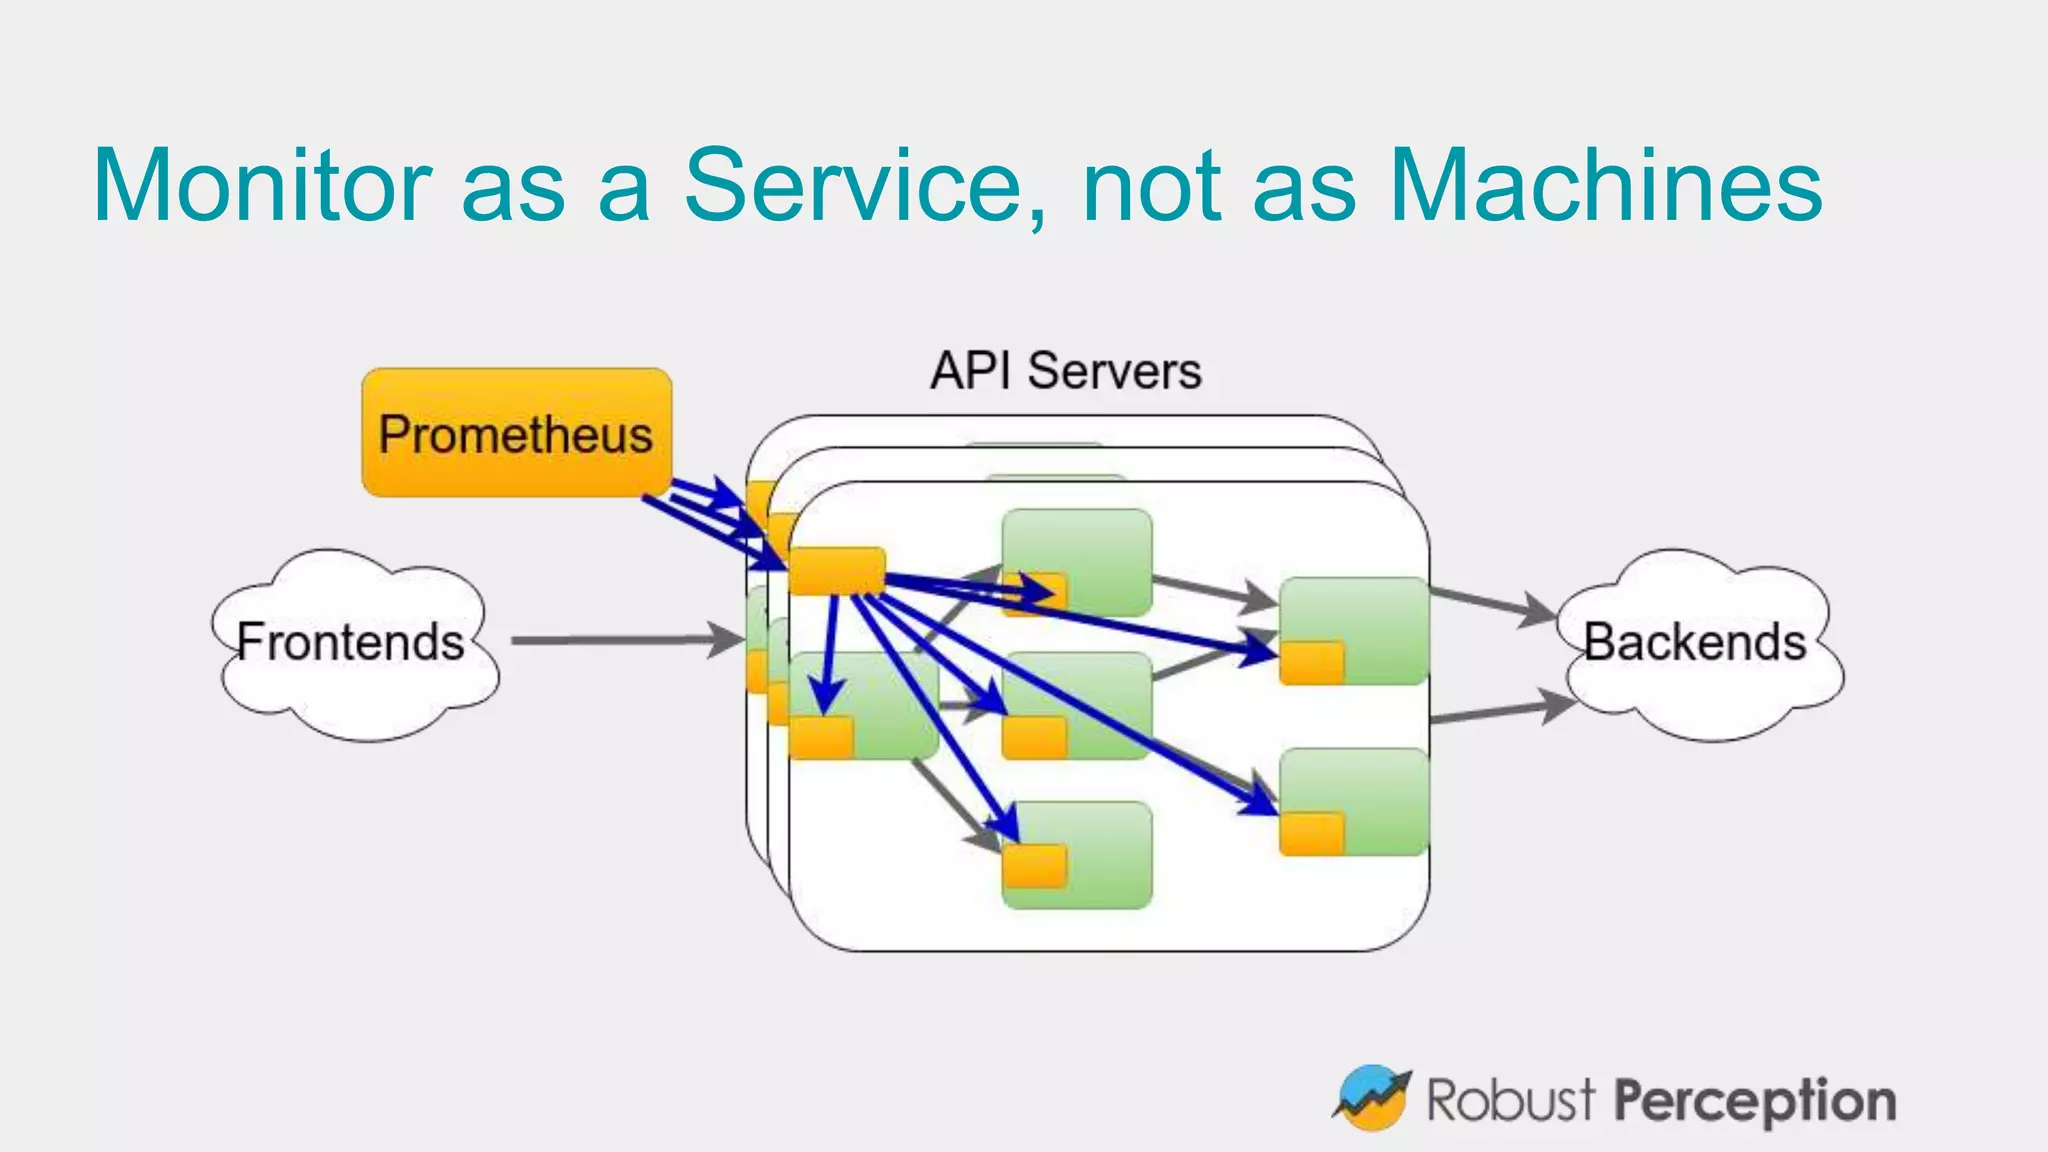
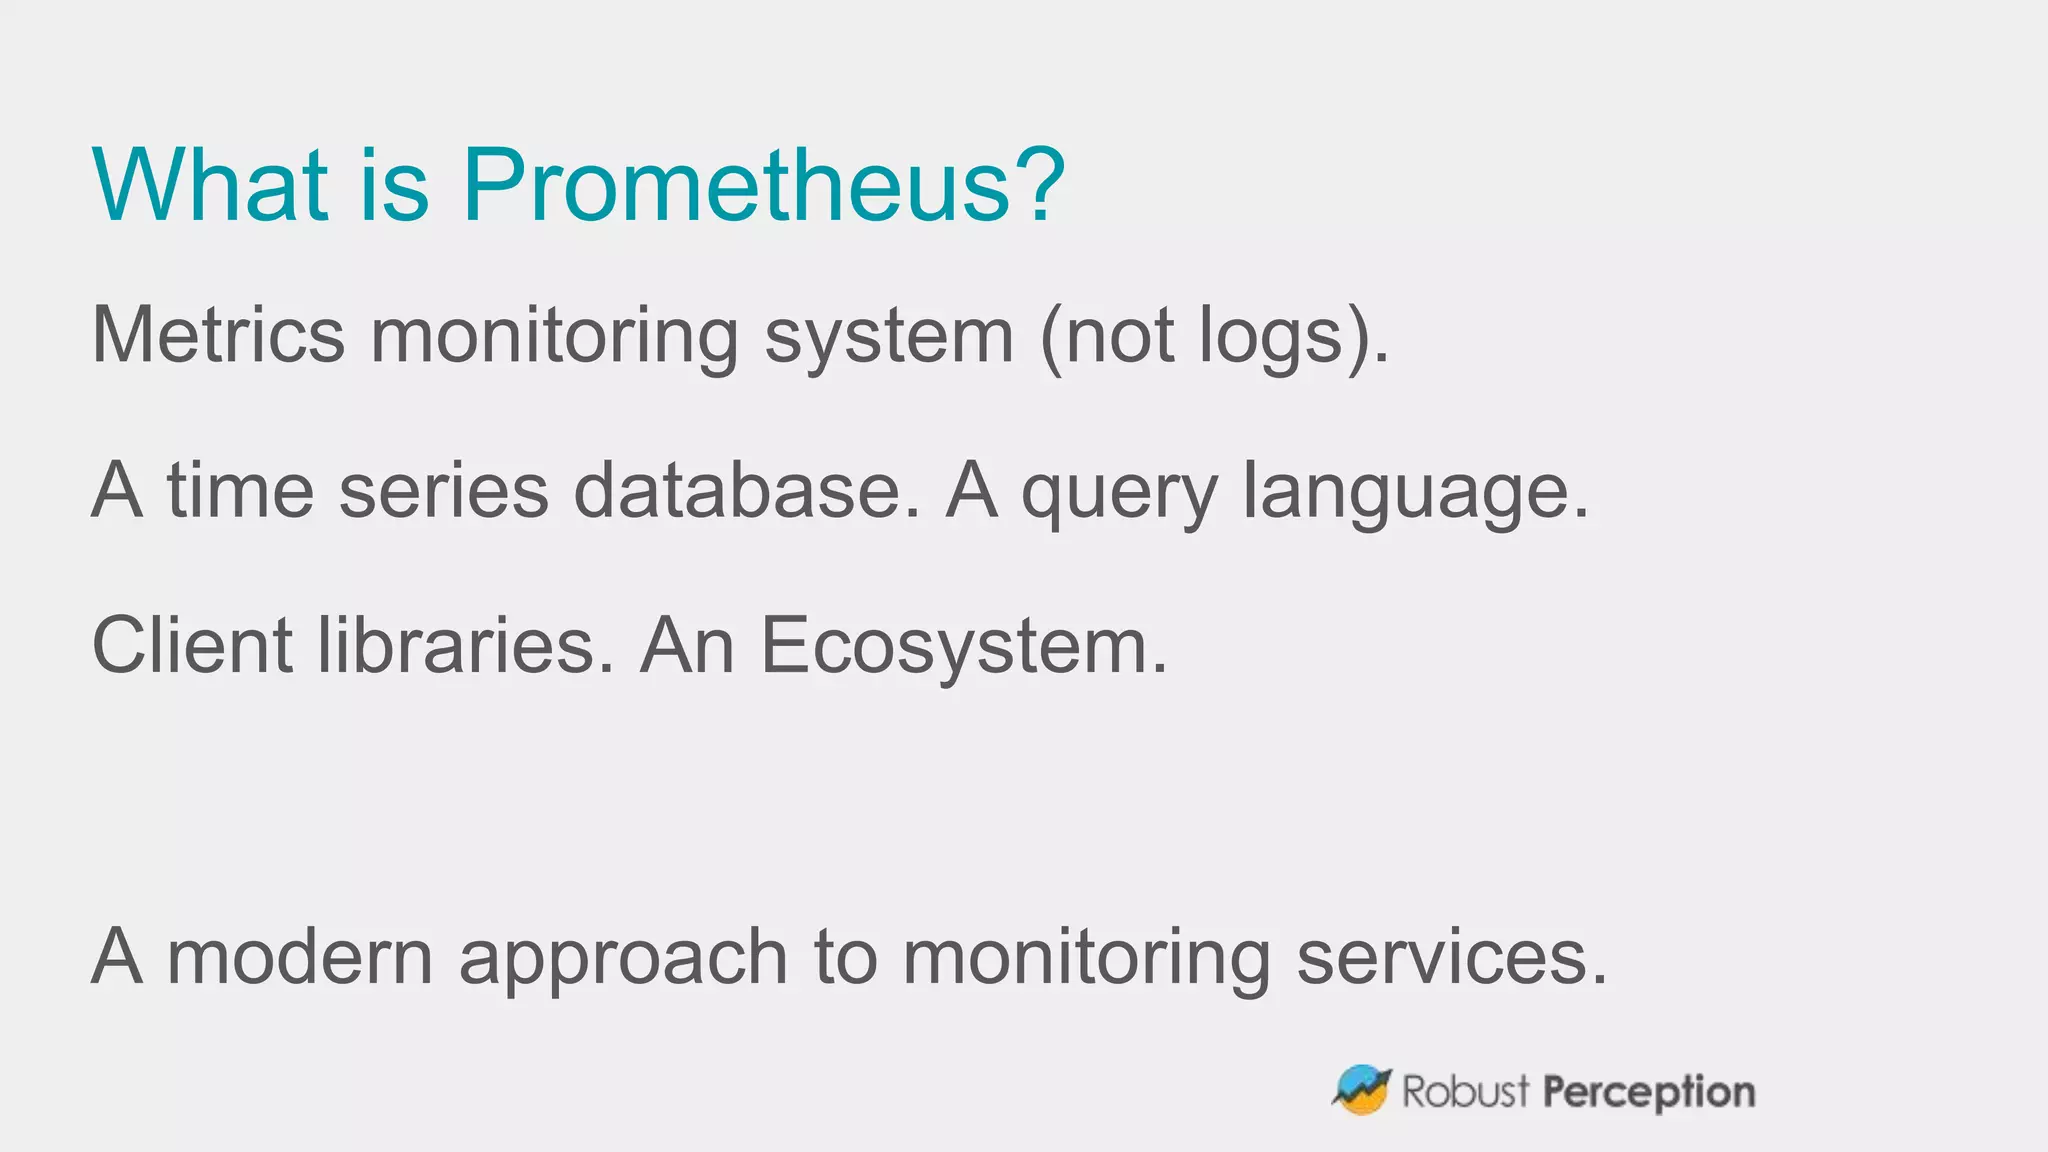
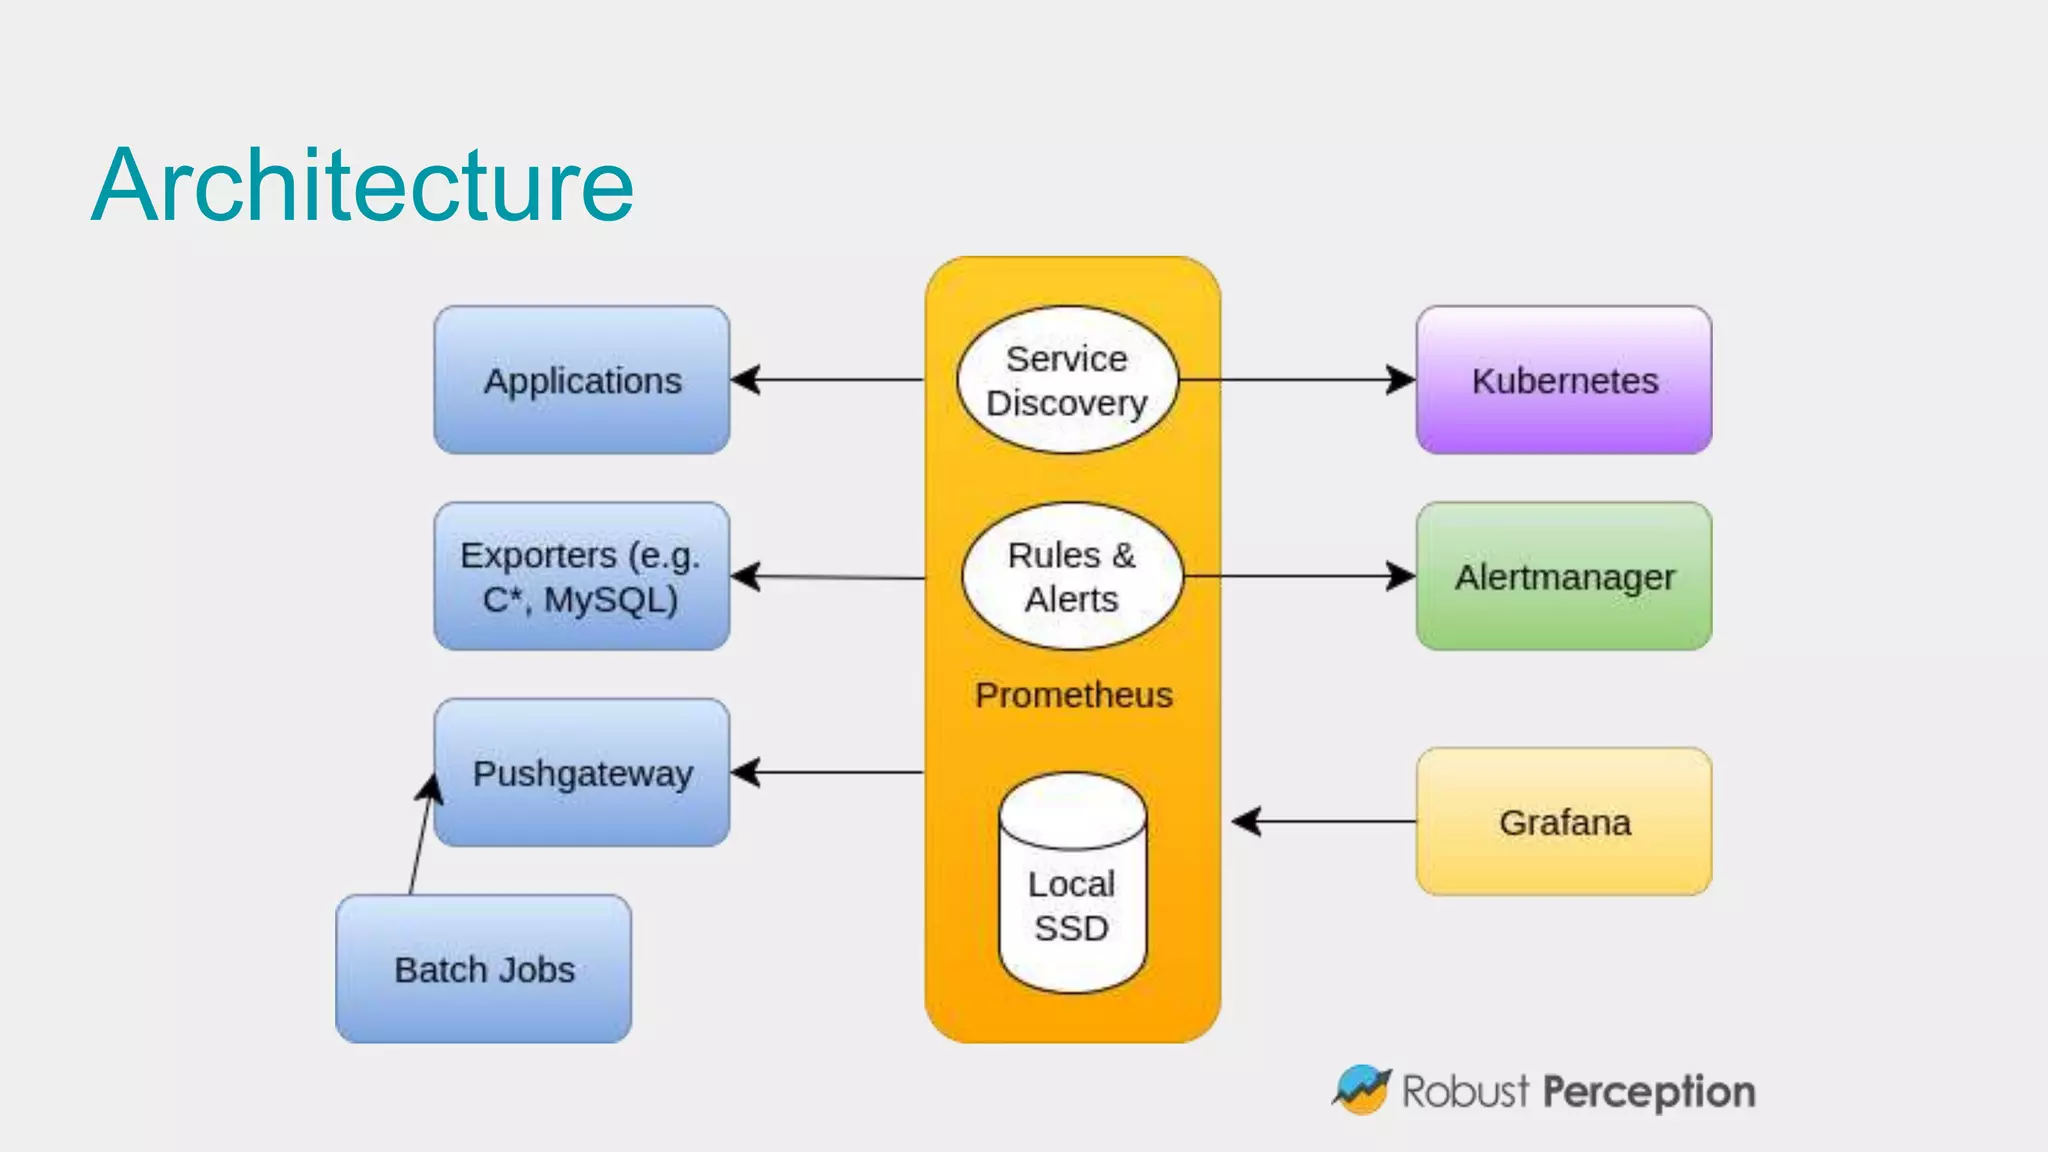
The document discusses Prometheus, a metrics monitoring system and time series database developed by Brian Brazil. It highlights its architecture, features such as client libraries, PromQL query language, and alert management, while emphasizing the importance of monitoring for debugging and business insights. The document also mentions the active community contributing to Prometheus and presents resources for further information.


![Number_Guessing_Game_Dsbsbssbzboc[1].pptx](https://cdn.slidesharecdn.com/ss_thumbnails/numberguessinggamedoc1-251206215042-a076fc05-thumbnail.jpg?width=640&height=640&fit=bounds)


