


![Expressions (and sub-expressions)
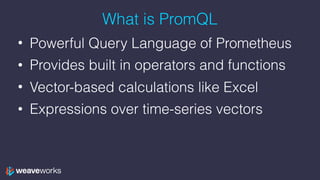
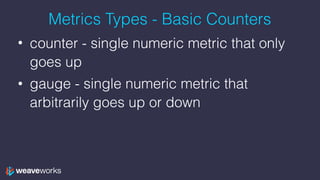
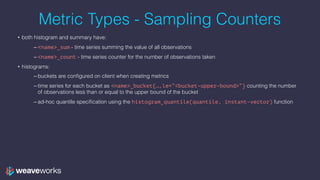
• Instant Vector - set of time series containing single sample for each time series, all sharing
same timestamp
• e.g. http_request_count => results in:
• http_request_count{status=“200”} 20
• http_request_count{status=“404”} 3
• http_request_count{status=“500”} 5
• Range Vector - set of time series containing a range of data points over time for each series
• e.g. http_request_count[5m] => results in:
• http_request_count{status=“200”}](https://image.slidesharecdn.com/5-prometheus-promqldeepdive-171016155833/85/PromQL-Deep-Dive-The-Prometheus-Query-Language-5-320.jpg)
![Expressions (and sub-expressions)
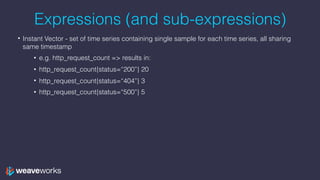
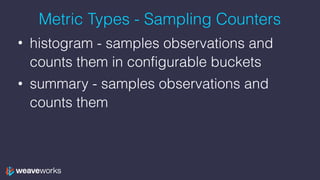
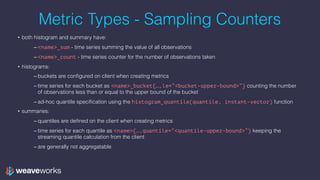
• Instant Vector - set of time series containing single sample for each time series, all sharing
same timestamp
• e.g. http_request_count => results in:
• http_request_count{status=“200”} 20
• http_request_count{status=“404”} 3
• http_request_count{status=“500”} 5
• Range Vector - set of time series containing a range of data points over time for each series
• e.g. http_request_count[5m] => results in:
• http_request_count{status=“200”}
• Scalar - as a literal and as result of an expression
• String - only currently as a literal in an expression](https://image.slidesharecdn.com/5-prometheus-promqldeepdive-171016155833/85/PromQL-Deep-Dive-The-Prometheus-Query-Language-6-320.jpg)
![Time Series Selectors
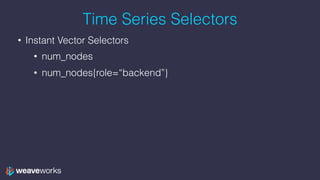
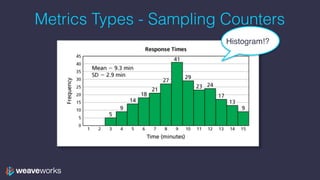
• Instant Vector Selectors
• num_nodes
• num_nodes{role=“backend”}
• Range Vector Selectors (s, m, h, d, w, y)
• num_nodes{role=“backend”}[5m]](https://image.slidesharecdn.com/5-prometheus-promqldeepdive-171016155833/85/PromQL-Deep-Dive-The-Prometheus-Query-Language-8-320.jpg)
![Time Series Selectors
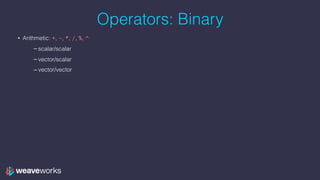
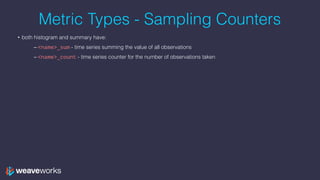
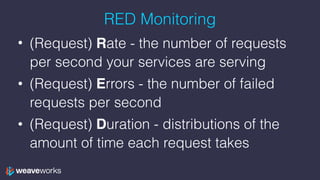
• Instant Vector Selectors
• num_nodes
• num_nodes{role=“backend”}
• Range Vector Selectors (s, m, h, d, w, y)
• num_nodes{role=“backend”}[5m]
• Offset Modifier
• num_nodes{role=“backend”}[5m] offset 1w](https://image.slidesharecdn.com/5-prometheus-promqldeepdive-171016155833/85/PromQL-Deep-Dive-The-Prometheus-Query-Language-9-320.jpg)


![Functions: Range Vector
• changes()ˆ
• delta()˚*, idelta()˚* - diff between first and last in each time series element
• deriv()* - per sec derivative using simple linear regression
• holt_winters(v, sf scalar, tf scalar)* - smooth value for time series based on
range in v
• increase()ˆ - syntactic sugar for rate(v[T]) * (seconds in T)
• irate()ˆ, rate()ˆ - per second instant/avg rate of increase
• predict_linear(v, t scalar)* - predict value at time t using simple linear regression
• resets()ˆ - number of times a counter reset
• <aggregation>_over_time()˚ - aggregate each series of a range vector over time
returning instant vector with per series aggregation results
• ˚returns an instant vector, *should only be used with gauges, ˆshould only be used with
counters](https://image.slidesharecdn.com/5-prometheus-promqldeepdive-171016155833/85/PromQL-Deep-Dive-The-Prometheus-Query-Language-24-320.jpg)

![Refining Rate
rate(requests[5m])](https://image.slidesharecdn.com/5-prometheus-promqldeepdive-171016155833/85/PromQL-Deep-Dive-The-Prometheus-Query-Language-33-320.jpg)
![Refining Rate
rate(requests[5m])
sum(rate(requests[5m])) by(service_name)](https://image.slidesharecdn.com/5-prometheus-promqldeepdive-171016155833/85/PromQL-Deep-Dive-The-Prometheus-Query-Language-34-320.jpg)
![Refining Rate
rate(requests[5m])
sum(rate(requests[5m])) by(service_name)
sum(rate(requests{service_name=“catalogue”}[5m]))
by(instance)](https://image.slidesharecdn.com/5-prometheus-promqldeepdive-171016155833/85/PromQL-Deep-Dive-The-Prometheus-Query-Language-35-320.jpg)
![Refining Rate
rate(requests[5m])
sum(rate(requests[5m])) by(service_name)
sum(rate(requests{service_name=“catalogue”}[5m]))
by(instance)
request_duration as a histogram](https://image.slidesharecdn.com/5-prometheus-promqldeepdive-171016155833/85/PromQL-Deep-Dive-The-Prometheus-Query-Language-36-320.jpg)
![Refining Rate
rate(requests[5m])
sum(rate(requests[5m])) by(service_name)
sum(rate(requests{service_name=“catalogue”}[5m]))
by(instance)
request_duration as a histogram
- derive average request duration over a rolling 5
minute period](https://image.slidesharecdn.com/5-prometheus-promqldeepdive-171016155833/85/PromQL-Deep-Dive-The-Prometheus-Query-Language-37-320.jpg)
![Refining Rate
rate(requests[5m])
sum(rate(requests[5m])) by(service_name)
sum(rate(requests{service_name=“catalogue”}[5m]))
by(instance)
request_duration as a histogram
- derive average request duration over a rolling 5
minute period
rate(request_duration_sum[5m]) /
rate(request_duration_count[5m])](https://image.slidesharecdn.com/5-prometheus-promqldeepdive-171016155833/85/PromQL-Deep-Dive-The-Prometheus-Query-Language-38-320.jpg)


The document provides an in-depth overview of PromQL, the powerful query language of Prometheus, detailing its operators, functions, and data types. It covers topics such as instant and range vectors, time series selectors, and various arithmetic and aggregation operators. Hands-on sessions include building queries, visualizing data in Grafana, and applying these concepts in a real application context.