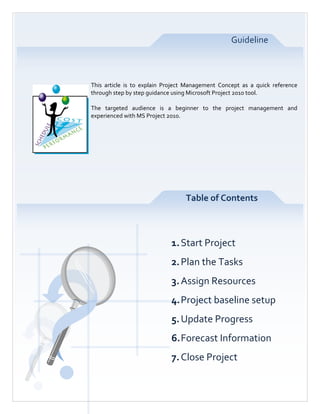
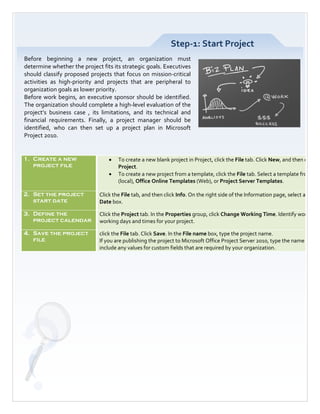
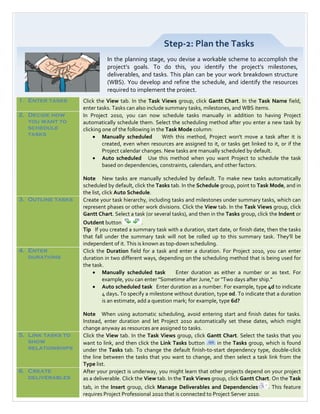
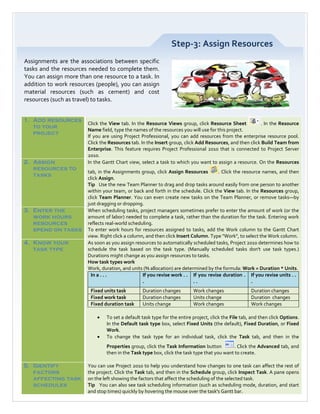
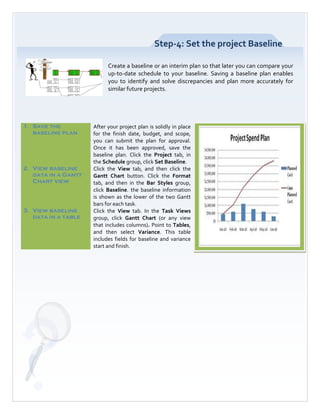
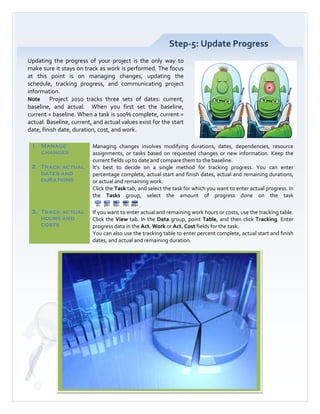
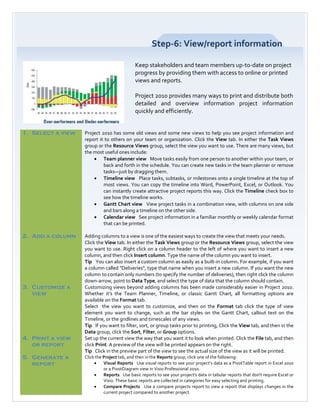
This document provides guidance on using Microsoft Project 2010 to manage a project. It outlines 7 steps: 1) Start the project by creating a new project file. 2) Plan tasks by entering, scheduling, and outlining tasks. 3) Assign resources by adding resources and assigning them to tasks. 4) Set the baseline plan by saving the baseline. 5) Update progress by tracking actual dates, durations, hours, and costs. 6) View and report information using different views and reports. 7) Close the project by creating a final report and archiving the project plan. The document is targeted at beginners to project management who are experienced using MS Project 2010.
This is the basics training for Navisworks beginner
which tends to learn....
Navisworks is coordination tool
It is useful to simulate, timeline, and Clash detection
We can use Revit also for clash detection, Navis will help us to make detection in depth. But, Main work of Navis is to view whole model whether it is architecturally and technically good or not.
Installation of primavera (optional)
Open primavera
Create EPS
Create your own project with minimum 30 activities(Live projects are preferable)
Data entry
Inserting activities
Assigning relationship
Activates codes
Basic formatting of Bars(Bar style, Bar label)
Inserting and modifying columns
Group by and short by
User defined filed
Interfering floats
Make 2 more of your self
Filters
New filters
Modify filters
Cases of Constraints
Case of difference between total float and free float
calendar
Import & Export
Live project Information
Filters ( 1-line, 2-line, 3-line Filters)
RESOURCE ASSIGNING AND LEVELLING
Resource Levelling
RESOURCE LOADING (Bell type, front loaded, back loaded, linear etc.)
EARNED VALUE ANALYSIS
Cost Account
Expenses
Reports
Role
User Defined fields
Admin Preferences
Renumbering Activities
Project Portfolio
Edit Columns
Save layout
Working with multiple projects
Activity Steps
Global change
Multiple Projects
USING WORK PRODUCTS AND DOCUMENTS
UPDATING PROJECT BY "AUTO ACTUALS" METHOD
UPDATING, SCHEDULING PROJECT - WITH SPOTLIGHT FEATURE
ASSIGN BASELINE
MAINTAIN BASELINE
PROJECT CODES
Project Standard and Project Professional 2010 Product GuideEPC Group
Project Standard and Project Professional 2010 Product Guide
EPC Group's Microsoft Project Server Consulting Practice - Product Overview and Training Documentation
I HAVE ATTACHED A PPT CONSIST OF VARIOUS COMMANDS OF MICROSOFT PROJECT.
I HAVE INCLUDED INTRODUCTION TO MACROS, WHICH ARE BEING USED IN NORMAL CONSTRUCTION INDUSTRY.
I HOPE YOU LIKE IT. REVIEWS & SUGGESTIONS ARE MOST WELCOME.
Project Management is often seen as a complex activity. MS Office Project 2007 makes things easier as a tool to effective project management. This tutorial gives a general guideline to manage your projects.
Slides on MS Project covering the following
Project Scheduling
• Overview and Context
• Opening Microsoft Project and Customizing the User Interface
• Starting a New Project
• Working with Durations and the Time Scale
• Outlining a Project
• Linking Tasks
• Adding Lags to Links
• Working with Date Constraints
• Creating and managing Milestones
• Working with Project Tasks
• The Critical Path
• Filters
• Sorting and Grouping
• Customizing Fields
• Other View and Display Options
• Creating Reports
• Adding Graphics and Multimedia Objects to the Gantt Area
• Formatting for Printing
• Exporting Project Images and Data to Other Applications
• The Organizer
Resource Management
• The Resource Sheet
• Assigning Single Resources to Tasks
• Assigning Multiple Resources to Tasks
• Special Tools for Resource Assignment and Cost Estimating
• Managing Resource Workloads
• Resource Leveling
• Working with Calendars
Tracking Progress
• The Baseline
• Tracking Progress with the Percent of Completion Method
• Tracking Actual Hours with the Usage Views
• Earned Value Concepts
• Progress Lines and Updating Tools
• Issues and Problems Arising With Tracking
Multiple Projects
• Resource Pooling
• Consolidating Projects
• Links Among Projects in a Consolidation
CSCI 714 Software Project Planning and EstimationLec.docxmydrynan
*
CSCI 714: Software Project Planning and Estimation
Lecture 4B: Work Breakdown Structure
Gursimran Singh Walia
North Dakota State University
[email protected]
*
The Work Breakdown StructureA work breakdown structure (WBS) is an outcome-oriented analysis of the work involved in a project that defines the total scope of the projectIt is a foundation document in project management because it provides the basis for planning and managing project schedules, costs, and changes
Approaches to Developing WBSsUsing guidelines: Some organizations, like the DOD, provide guidelines for preparing WBSsThe analogy approach: It often helps to review WBSs of similar projectsThe top-down approach: Start with the largest items of the project and keep breaking them downThe bottoms-up approach: Start with the detailed tasks and roll them up
Basic Principles for Creating WBSs*
1. A unit of work should appear at only one place in the WBS.
3. A WBS item is the responsibility of only one individual, even though many people may be working on it.
4. The WBS must be consistent with the way in which work is actually going to be performed; it should serve the project team first and other purposes only if practical.
5. Project team members should be involved in developing the WBS to ensure consistency and buy-in.
6. Each WBS item must be documented to ensure accurate understanding of the scope of work included and not included in that item.
7. The WBS must be a flexible tool to accommodate inevitable changes while properly maintaining control of the work content in the project according to the scope statement. *Cleland, David I. Project Management: Strategic Design and Implementation, 1994
Good WBS Design PrinciplesThe 100% RuleThe WBS defines 100% of the work of the projectAnything that isn’t defined in the WBS is outside the scope of the project.The work content on any item is the sum of what is included under that work itemUpper Levels are Planned outcomes (deliverables), not planned actionsEnds of WBS include the activities needed to create the project deliverablesMutually-exclusive elementsWork should only appear in one place in the WBSWBS must be consistent with the way the project will be performed and controlledMust be easy to update
WBS RolePartition the major project deliverables into smaller components to improve the accuracy of cost estimatesProvide a mechanism for collecting actual costsProvide a mechanism for performance measurement and control
Why create a WBS?Cost EstimatingCost BudgetingResource PlanningRisk Management PlanningActivity Definition
SchedulingScheduling forces:Quantification of discrete effortPlacement of tasks in proper relationshipTwo most common scheduling methodologiesBar Charts (aka Gantt Charts)Critical Path Method (CPM) using Precedence Diagramming Method (PDM)
Bar / Gantt Charts Defined:Analyze and specify the basic approach in executionSegment into reasonable number of activitiesEstimate the time required.
Learn MS Project Software Free PDF Download - Nice Presentation done by Bhadanis Quantity Surveying Institute Call 9990990844 or visit www.billingengineer.com
Awarded for Rashrta Vibhushan {excellence in Business and Social} award by FACE @ 2014
Nominated for Indian Leadership award for Industrial Development by AIAF @ 2014
Top 50 Mobile Application Directory by Silicon India @ 2014
20 MOST PROMISING ERP COMPANIES by CIO REVIEW @ 2014
Cool Startup @ 2013
Innovative Product Launch in India IT Show @ 2013
Top 10 Mobile App Vendors in India @ 2013
Winner of Top Mobile App award by Silicon India @ 2013
Nominated for innovative product of the year 2013 by Franchised India
Vehicle Tracking system for Government and Logistics by DeepBizWadhwani Foundation
VTS for Logistics & Governance is a one day regional conference focusing on the use-cases of vehicle tracking systems in logistics industry and different vertical segments of governance like municipality, public transport, public distribution & civil supplies, FMCG, oil & gas and many more. The conference will bring the exclusive case-studies from the local government and the upcoming tech-trends from the service providers.
ICareU is an innovative cloud platform to provide an end-to-end Usage Based Insurance Solution to an Indian Motor Insurance Companies to adopt and implement a cost effective Insurance service to their customers.
ICareU is a highly secured cloud based UBI Platform to connect GPS/OBD devices with Vehicles, managing and analyzing driving data, providing BI analytical reports and forecasting the total CarePoints scored by the vehicle to the insurers. Based on the CarePoints’ loyalty score, the insurer can provide competitive advantage across the full insurance value chain to their customer during the renewal period.
1 Drive safely and save money up to 35% a year. [Claim your better incentive to drive better rather than when you are stuck with a fixed premium.]
2 Increase the market share of Own Damage [OD] up to 80% [Analyzing the driving pattern identifies the safest driver and retain them by offering better loyalty bonus.]
3 Get your CarePoint loyalty reward points up to 60% for add-on services[Award the loyalty bonus points to benefit Insurance Discounts, along with other value added services.]
4 ICareU supports 24/7 service for e-call or b-call and save lives up to 20%][ Fast and correct response reduces severity of injuries by automatically contacting the emergency services or breakdown company pinpointing]
5 We contribute: Increase Indian Economy. Decrease Pollution Control [Monitor how “green” a driver is by measuring the impact of driving behavior leads in decreasing 2% of CO2 emission and 4% of Fuel Consumption.]
6 Theft Recovery 100% and Teen Safety [Live tracking cuts the chances of theft on theft-prone vehicles and stolen vehicle and increasing the likelihood of recovery]
Sponsorship Opportunity in National TSD Rally Round III at Bangalore.Wadhwani Foundation
Sponsorship Opportunity in National TSD Rally Round III at Bangalore, organized by Karnataka Motor Sports Club.
Rush for your Booking @ president@kmsc.org or info@kmsc.org
Date: Aug 16 and 17
Venue: The Club, Bangalore, Karnataka, India
Dealership, distributors model for international market for iGateway GPS Platform enterprise application.
Contact @ info@deepbiz.net or call us @ +91(988)619-7840
What Makes Candle Making The Ultimate Bachelorette CelebrationWick & Pour
The above-discussed factors are the reason behind an increasing number of millennials opting for candle making events to celebrate their bachelorette. If you are in search of any theme for your bachelorette then do opt for a candle making session to make your celebration memorable for everyone involved.
Johnny Depp Long Hair: A Signature Look Through the Yearsgreendigital
Johnny Depp, synonymous with eclectic roles and unparalleled acting prowess. has also been a significant figure in fashion and style. Johnny Depp long hair is a distinctive trademark among the various elements that define his unique persona. This article delves into the evolution, impact. and cultural significance of Johnny Depp long hair. exploring how it has contributed to his iconic status.
Follow us on: Pinterest
Introduction
Johnny Depp is an actor known for his chameleon-like ability to transform into a wide range of characters. from the eccentric Captain Jack Sparrow in "Pirates of the Caribbean" to the introspective Edward Scissorhands. His long hair is one constant throughout his evolving roles and public appearances. Johnny Depp long hair is not a style choice but a significant aspect of his identity. contributing to his allure and mystique. This article explores the journey and significance of Johnny Depp long hair. highlighting how it has become integral to his brand.
The Early Years: A Budding Star with Signature Locks
1980s: The Rise of a Young Heartthrob
Johnny Depp's journey in Hollywood began in the 1980s. with his breakout role in the television series "21 Jump Street." During this time, his hair was short, but it was already clear that Depp had a penchant for unique and edgy styles. By the decade's end, Depp started experimenting with longer hair. setting the stage for a lifelong signature.
1990s: From Heartthrob to Icon
The 1990s were transformative for Johnny Depp his career and personal style. Films like "Edward Scissorhands" (1990) and "Benny & Joon" (1993) saw Depp sporting various hair lengths and styles. But, his long, unkempt hair in "What's Eating Gilbert Grape" (1993) began to draw significant attention. This period marked the beginning of Johnny Depp long hair. which became a defining feature of his image.
The Iconic Roles: Hair as a Character Element
Edward Scissorhands (1990)
In "Edward Scissorhands," Johnny Depp's character had a wild and mane that complemented his ethereal and misunderstood persona. This role showcased how long hair Johnny Depp could enhance a character's depth and mystery.
Captain Jack Sparrow: The Pirate with Flowing Locks
One of Johnny Depp's iconic roles is Captain Jack Sparrow from the "Pirates of the Caribbean" series. Sparrow's long, dreadlocked hair symbolised his rebellious and unpredictable nature. The character's look, complete with beads and trinkets woven into his hair. was a collaboration between Depp and the film's costume designers. This style became iconic and influenced fashion trends and Halloween costumes worldwide.
Other Memorable Characters
Depp's long hair has also been featured in other roles, such as Ichabod Crane in "Sleepy Hollow" (1999). and Roux in "Chocolat" (2000). In these films, his hair added a layer of authenticity and depth to his characters. proving that Johnny Depp with long hair is more than a style—it's a storytelling tool.
Off-Screen Influenc
Is your favorite ring slipping and sliding on your finger? You're not alone. Must Read this Guide on What To Do If Your Ring Is Too Big as shared by the experts of Andrews Jewelers.
La transidentité, un sujet qui fractionne les FrançaisIpsos France
Ipsos, l’une des principales sociétés mondiales d’études de marché dévoile les résultats de son étude Ipsos Global Advisor “Pride 2024”. De ses débuts aux Etats-Unis et désormais dans de très nombreux pays, le mois de juin est traditionnellement consacré aux « Marches des Fiertés » et à des événements festifs autour du concept de Pride. A cette occasion, Ipsos a réalisé une enquête dans vingt-six pays dressant plusieurs constats. Les clivages des opinions entre générations s’accentuent tandis que le soutien à des mesures sociétales et d’inclusion en faveur des LGBT+ notamment transgenres continue de s’effriter.
From Stress to Success How Oakland's Corporate Wellness Programs are Cultivat...Kitchen on Fire
Discover how Oakland's innovative corporate wellness initiatives are transforming workplace culture, nurturing the well-being of employees, and fostering a thriving environment. From comprehensive mental health support to flexible work arrangements and holistic wellness workshops, these programs are empowering individuals to navigate stress effectively, leading to increased productivity, satisfaction, and overall success.
From Stress to Success How Oakland's Corporate Wellness Programs are Cultivat...
Project management by MS Project 2010
1. Project Management
Quick Reference Guide
For
Project 2010
Initiate
Assign
Close
Plan
Muthu Swamy S, APSM, PMP, CSM, PM-2008
Friday, October 1, 2010
Rms.reddy@hotmail.com
2. Guideline
This article is to explain Project Management Concept as a quick reference
through step by step guidance using Microsoft Project 2010 tool.
The targeted audience is a beginner to the project management and
experienced with MS Project 2010.
Table of Contents
1. Start Project
2. Plan the Tasks
3. Assign Resources
4. Project baseline setup
5. Update Progress
6. Forecast Information
7. Close Project
3. Step-1: Start Project
Before beginning a new project, an organization must
determine whether the project fits its strategic goals. Executives
should classify proposed projects that focus on mission-critical
activities as high-priority and projects that are peripheral to
organization goals as lower priority.
Before work begins, an executive sponsor should be identified.
The organization should complete a high-level evaluation of the
project’s business case , its limitations, and its technical and
financial requirements. Finally, a project manager should be
identified, who can then set up a project plan in Microsoft
Project 2010.
1. Create a new • To create a new blank project in Project, click the File tab. Click New, and then c
project file Project.
• To create a new project from a template, click the File tab. Select a template fro
(local), Office Online Templates (Web), or Project Server Templates.
2. Set the project Click the File tab, and then click Info. On the right side of the Information page, select a
start date Date box.
3. Define the Click the Project tab. In the Properties group, click Change Working Time. Identify wor
project calendar working days and times for your project.
4. Save the project click the File tab. Click Save. In the File name box, type the project name.
file If you are publishing the project to Microsoft Office Project Server 2010, type the name
include any values for custom fields that are required by your organization.
4. Step-2: Plan the Tasks
In the planning stage, you devise a workable scheme to accomplish the
project’s goals. To do this, you identify the project’s milestones,
deliverables, and tasks. This plan can be your work breakdown structure
(WBS). You develop and refine the schedule, and identify the resources
required to implement the project.
1. Enter tasks Click the View tab. In the Task Views group, click Gantt Chart. In the Task Name field,
enter tasks. Tasks can also include summary tasks, milestones, and WBS items.
2. Decide how In Project 2010, you can now schedule tasks manually in addition to having Project
you want to automatically schedule them. Select the scheduling method after you enter a new task by
schedule clicking one of the following in the Task Mode column:
tasks • Manually scheduled With this method, Project won't move a task after it is
created, even when resources are assigned to it, or tasks get linked to it, or if the
Project calendar changes. New tasks are manually scheduled by default.
• Auto scheduled Use this method when you want Project to schedule the task
based on dependencies, constraints, calendars, and other factors.
Note New tasks are manually scheduled by default. To make new tasks automatically
scheduled by default, click the Tasks tab. In the Schedule group, point to Task Mode, and in
the list, click Auto Schedule.
3. Outline tasks Create your task hierarchy, including tasks and milestones under summary tasks, which can
represent phases or other work divisions. Click the View tab. In the Task Views group, click
Gantt Chart. Select a task (or several tasks), and then in the Tasks group, click the Indent or
Outdent button .
Tip If you created a summary task with a duration, start date, or finish date, then the tasks
that fall under the summary task will not be rolled up to this summary task. They'll be
independent of it. This is known as top-down scheduling.
4. Enter Click the Duration field for a task and enter a duration. For Project 2010, you can enter
durations duration in two different ways, depending on the scheduling method that is being used for
the task.
• Manually scheduled task Enter duration as either a number or as text. For
example, you can enter "Sometime after June," or "Two days after ship."
• Auto scheduled task Enter duration as a number. For example, type 4d to indicate
4 days. To specify a milestone without duration, type 0d. To indicate that a duration
is an estimate, add a question mark; for example, type 6d?
Note When using automatic scheduling, avoid entering start and finish dates for tasks.
Instead, enter duration and let Project 2010 automatically set these dates, which might
change anyway as resources are assigned to tasks.
5. Link tasks to Click the View tab. In the Task Views group, click Gantt Chart. Select the tasks that you
show want to link, and then click the Link Tasks button in the Tasks group, which is found
relationships under the Tasks tab. To change the default finish-to-start dependency type, double-click
the line between the tasks that you want to change, and then select a task link from the
Type list.
6. Create After your project is underway, you might learn that other projects depend on your project
deliverables as a deliverable. Click the View tab. In the Task Views group, click Gantt Chart. On the Task
tab, in the Insert group, click Manage Deliverables and Dependencies . This feature
requires Project Professional 2010 that is connected to Project Server 2010.
5. Step-3: Assign Resources
Assignments are the associations between specific
tasks and the resources needed to complete them.
You can assign more than one resource to a task. In
addition to work resources (people), you can assign
material resources (such as cement) and cost
resources (such as travel) to tasks.
1. Add resources
Click the View tab. In the Resource Views group, click Resource Sheet . In the Resource
to your
Name field, type the names of the resources you will use for this project.
project
If you are using Project Professional, you can add resources from the enterprise resource pool.
Click the Resources tab. In the Insert group, click Add Resources, and then click Build Team from
Enterprise. This feature requires Project Professional 2010 that is connected to Project Server
2010.
2. Assign In the Gantt Chart view, select a task to which you want to assign a resource. On the Resources
resources to
tab, in the Assignments group, click Assign Resources . Click the resource names, and then
tasks
click Assign.
Tip Use the new Team Planner to drag and drop tasks around easily from one person to another
within your team, or back and forth in the schedule. Click the View tab. In the Resources group,
click Team Planner. You can even create new tasks on the Team Planner, or remove tasks—by
just dragging or dropping.
3. Enter the When scheduling tasks, project managers sometimes prefer to enter the amount of work (or the
work hours amount of labor) needed to complete a task, rather than the duration for the task. Entering work
resources reflects real-world scheduling.
spend on tasks To enter work hours for resources assigned to tasks, add the Work column to the Gantt Chart
view. Right click a column, and then click Insert Column. Type "Work", to select the Work column.
4. Know your As soon as you assign resources to automatically scheduled tasks, Project 2010 determines how to
task type schedule the task based on the task type. (Manually scheduled tasks don't use task types.)
Durations might change as you assign resources to tasks.
How task types work
Work, duration, and units (% allocation) are determined by the formula: Work = Duration * Units.
In a . . . If you revise work . . If you revise duration . If you revise units . .
. .. .
Fixed units task Duration changes Work changes Duration changes
Fixed work task Duration changes Units change Duration changes
Fixed duration task Units change Work changes Work changes
• To set a default task type for the entire project, click the File tab, and then click Options.
In the Default task type box, select Fixed Units (the default), Fixed Duration, or Fixed
Work.
• To change the task type for an individual task, click the Task tab, and then in the
Properties group, click the Task Information button . Click the Advanced tab, and
then in the Task type box, click the task type that you want to create.
5. Identify You can use Project 2010 to help you understand how changes to one task can affect the rest of
factors the project. Click the Task tab, and then in the Schedule group, click Inspect Task. A pane opens
affecting task on the left showing the factors that affect the scheduling of the selected task.
schedules Tip You can also see task scheduling information (such as scheduling mode, duration, and start
and stop times) quickly by hovering the mouse over the task's Gantt bar.
6. Step-4: Set the project Baseline
Create a baseline or an interim plan so that later you can compare your
up-to-date schedule to your baseline. Saving a baseline plan enables
you to identify and solve discrepancies and plan more accurately for
similar future projects.
1. Save the After your project plan is solidly in place
baseline plan for the finish date, budget, and scope,
you can submit the plan for approval.
Once it has been approved, save the
baseline plan. Click the Project tab, in
the Schedule group, click Set Baseline.
2. View baseline Click the View tab, and then click the
data in a Gantt Gantt Chart button. Click the Format
Chart view tab, and then in the Bar Styles group,
click Baseline. the baseline information
is shown as the lower of the two Gantt
bars for each task.
3. View baseline Click the View tab. In the Task Views
data in a table group, click Gantt Chart (or any view
that includes columns). Point to Tables,
and then select Variance. This table
includes fields for baseline and variance
start and finish.
7. Step-5: Update Progress
Updating the progress of your project is the only way to
make sure it stays on track as work is performed. The focus
at this point is on managing changes, updating the
schedule, tracking progress, and communicating project
information.
Note Project 2010 tracks three sets of dates: current,
baseline, and actual. When you first set the baseline,
current = baseline. When a task is 100% complete, current =
actual. Baseline, current, and actual values exist for the start
date, finish date, duration, cost, and work.
1. Manage Managing changes involves modifying durations, dates, dependencies, resource
changes assignments, or tasks based on requested changes or new information. Keep the
current fields up to date and compare them to the baseline.
2. Track actual It’s best to decide on a single method for tracking progress. You can enter
dates and percentage complete, actual start and finish dates, actual and remaining durations,
durations or actual and remaining work.
Click the Task tab, and select the task for which you want to enter actual progress. In
the Tasks group, select the amount of progress done on the task
.
3. Track actual If you want to enter actual and remaining work hours or costs, use the tracking table.
hours and Click the View tab. In the Data group, point Table, and then click Tracking. Enter
costs progress data in the Act. Work or Act. Cost fields for the task.
You can also use the tracking table to enter percent complete, actual start and finish
dates, and actual and remaining duration.
8. Step-6: View/report information
Keep stakeholders and team members up-to-date on project
progress by providing them with access to online or printed
views and reports.
Project 2010 provides many ways to print and distribute both
detailed and overview information project information
quickly and efficiently.
1. Select a view Project 2010 has some old views and some new views to help you see project information and
report it to others on your team or organization. Click the View tab. In either the Task Views
group or the Resource Views group, select the view you want to use. There are many views, but
the most useful ones include:
• Team planner view Move tasks easily from one person to another within your team, or
back and forth in the schedule. You can create new tasks in the team planner or remove
tasks—just by dragging them.
• Timeline view Place tasks, subtasks, or milestones onto a single timeline at the top of
most views. You can copy the timeline into Word, PowerPoint, Excel, or Outlook. You
can instantly create attractive project reports this way. Click the Timeline check box to
see how the timeline works.
• Gantt Chart view View project tasks in a combination view, with columns on one side
and bars along a timeline on the other side.
• Calendar view See project information in a familiar monthly or weekly calendar format
that can be printed.
2. Add a column Adding columns to a view is one of the easiest ways to create the view that meets your needs.
Click the View tab. In either the Task Views group or the Resource Views group, select the view
you want to use. Right click on a column header to the left of where you want to insert a new
column, and then click Insert column. Type the name of the column you want to insert.
Tip You can also insert a custom column as easily as a built-in column. For example, if you want
a column called "Deliveries", type that name when you insert a new column. If you want the new
column to contain only numbers (to specify the number of deliveries), then right click the column
down-arrow, point to Data Type, and select the type of data that the column should contain.
3. Customize a Customizing views beyond adding columns has been made considerably easier in Project 2010.
view Whether it’s the Team Planner, Timeline, or classic Gantt Chart, all formatting options are
available on the Format tab.
Select the view you want to customize, and then on the Format tab click the type of view
element you want to change, such as the bar styles on the Gantt Chart, callout text on the
Timeline, or the gridlines and timescales of any views.
Tip If you want to filter, sort, or group tasks prior to printing, Click the View tab, and then in the
Data group, click the Sort, Filter, or Group options.
4. Print a view Set up the current view the way that you want it to look when printed. Click the File tab, and then
or report click Print. A preview of the view will be printed appears on the right.
Tip Click in the preview part of the view to see the actual size of the view as it will be printed.
5. Generate a Click the Project tab, and then in the Reports group, click one of the following:
report • Visual Reports Use visual reports to see your project’s data as a PivotTable report in Excel 2010
or a PivotDiagram view in Visio Professional 2010.
• Reports Use basic reports to see your project's data in tabular reports that don't require Excel or
Visio. These basic reports are collected in categories for easy selecting and printing.
• Compare Projects Use a compare projects report to view a report that displays changes in the
current project compared to another project.
9. Step-7: Close the Project
Just because your project is
almost finished doesn’t mean
that your work is done. You
still need to resolve any final
project details and obtain
customer acceptance of final
deliverables. Conduct a
“lessons learned” session,
recording information about
areas for improvement and
best practices. Make any final
updates to the project plan.
Finally, archive the project
plan according to your
organization’s guidelines.
1. Create a final Click the Project tab. In the Reports group, click Visual Reports to see your project’s
report data as a PivotTable report in Excel 2010 or a PivotDiagram view in Visio Professional
2010.
You can also view basic reports that don’t require Excel or Visio. Click the Project tab,
and in the Reports group, click Reports. Double-click a report category, and then
double-click the predefined report. Enter any requested information. A preview of the
report appears. To print the report, click Print.
2. Save a project After completing a project, you should leverage what you’ve learned in the project by
as a template making it a template for future projects. Click the File tab, click Save As, and then in the
Save As Type box, click Template.
Thank You
Muthu Swamy S, APSM, PMP, CSM, PM-2008
rms.reddy@hotmail.com
http://linkedin.com/in/msbgl