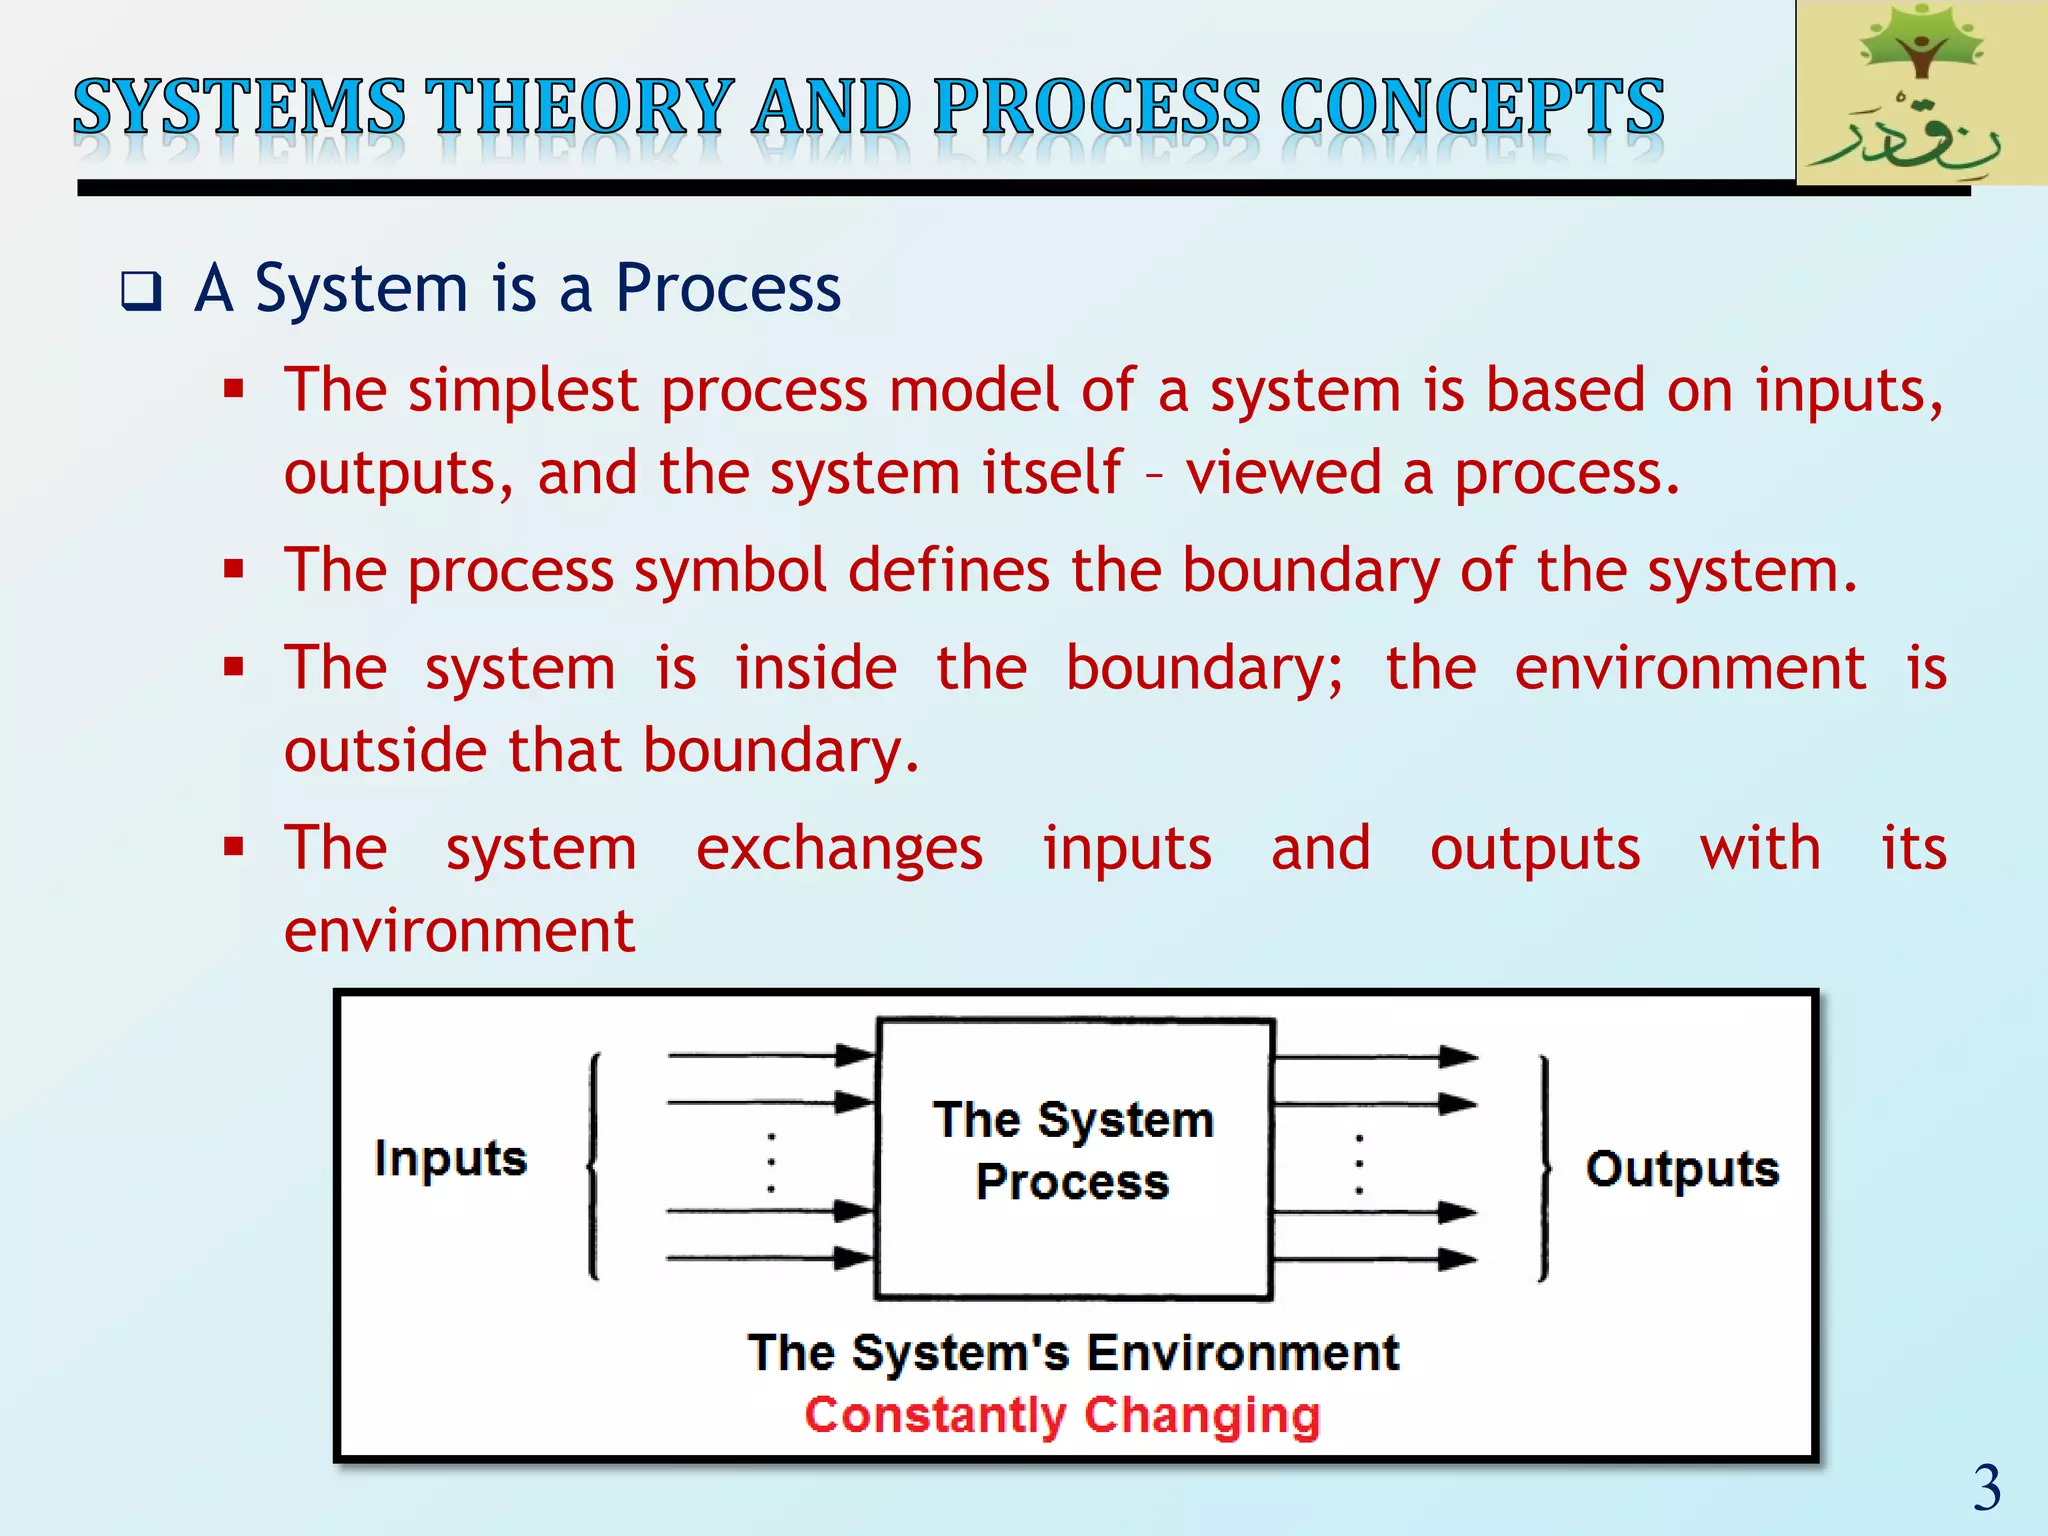
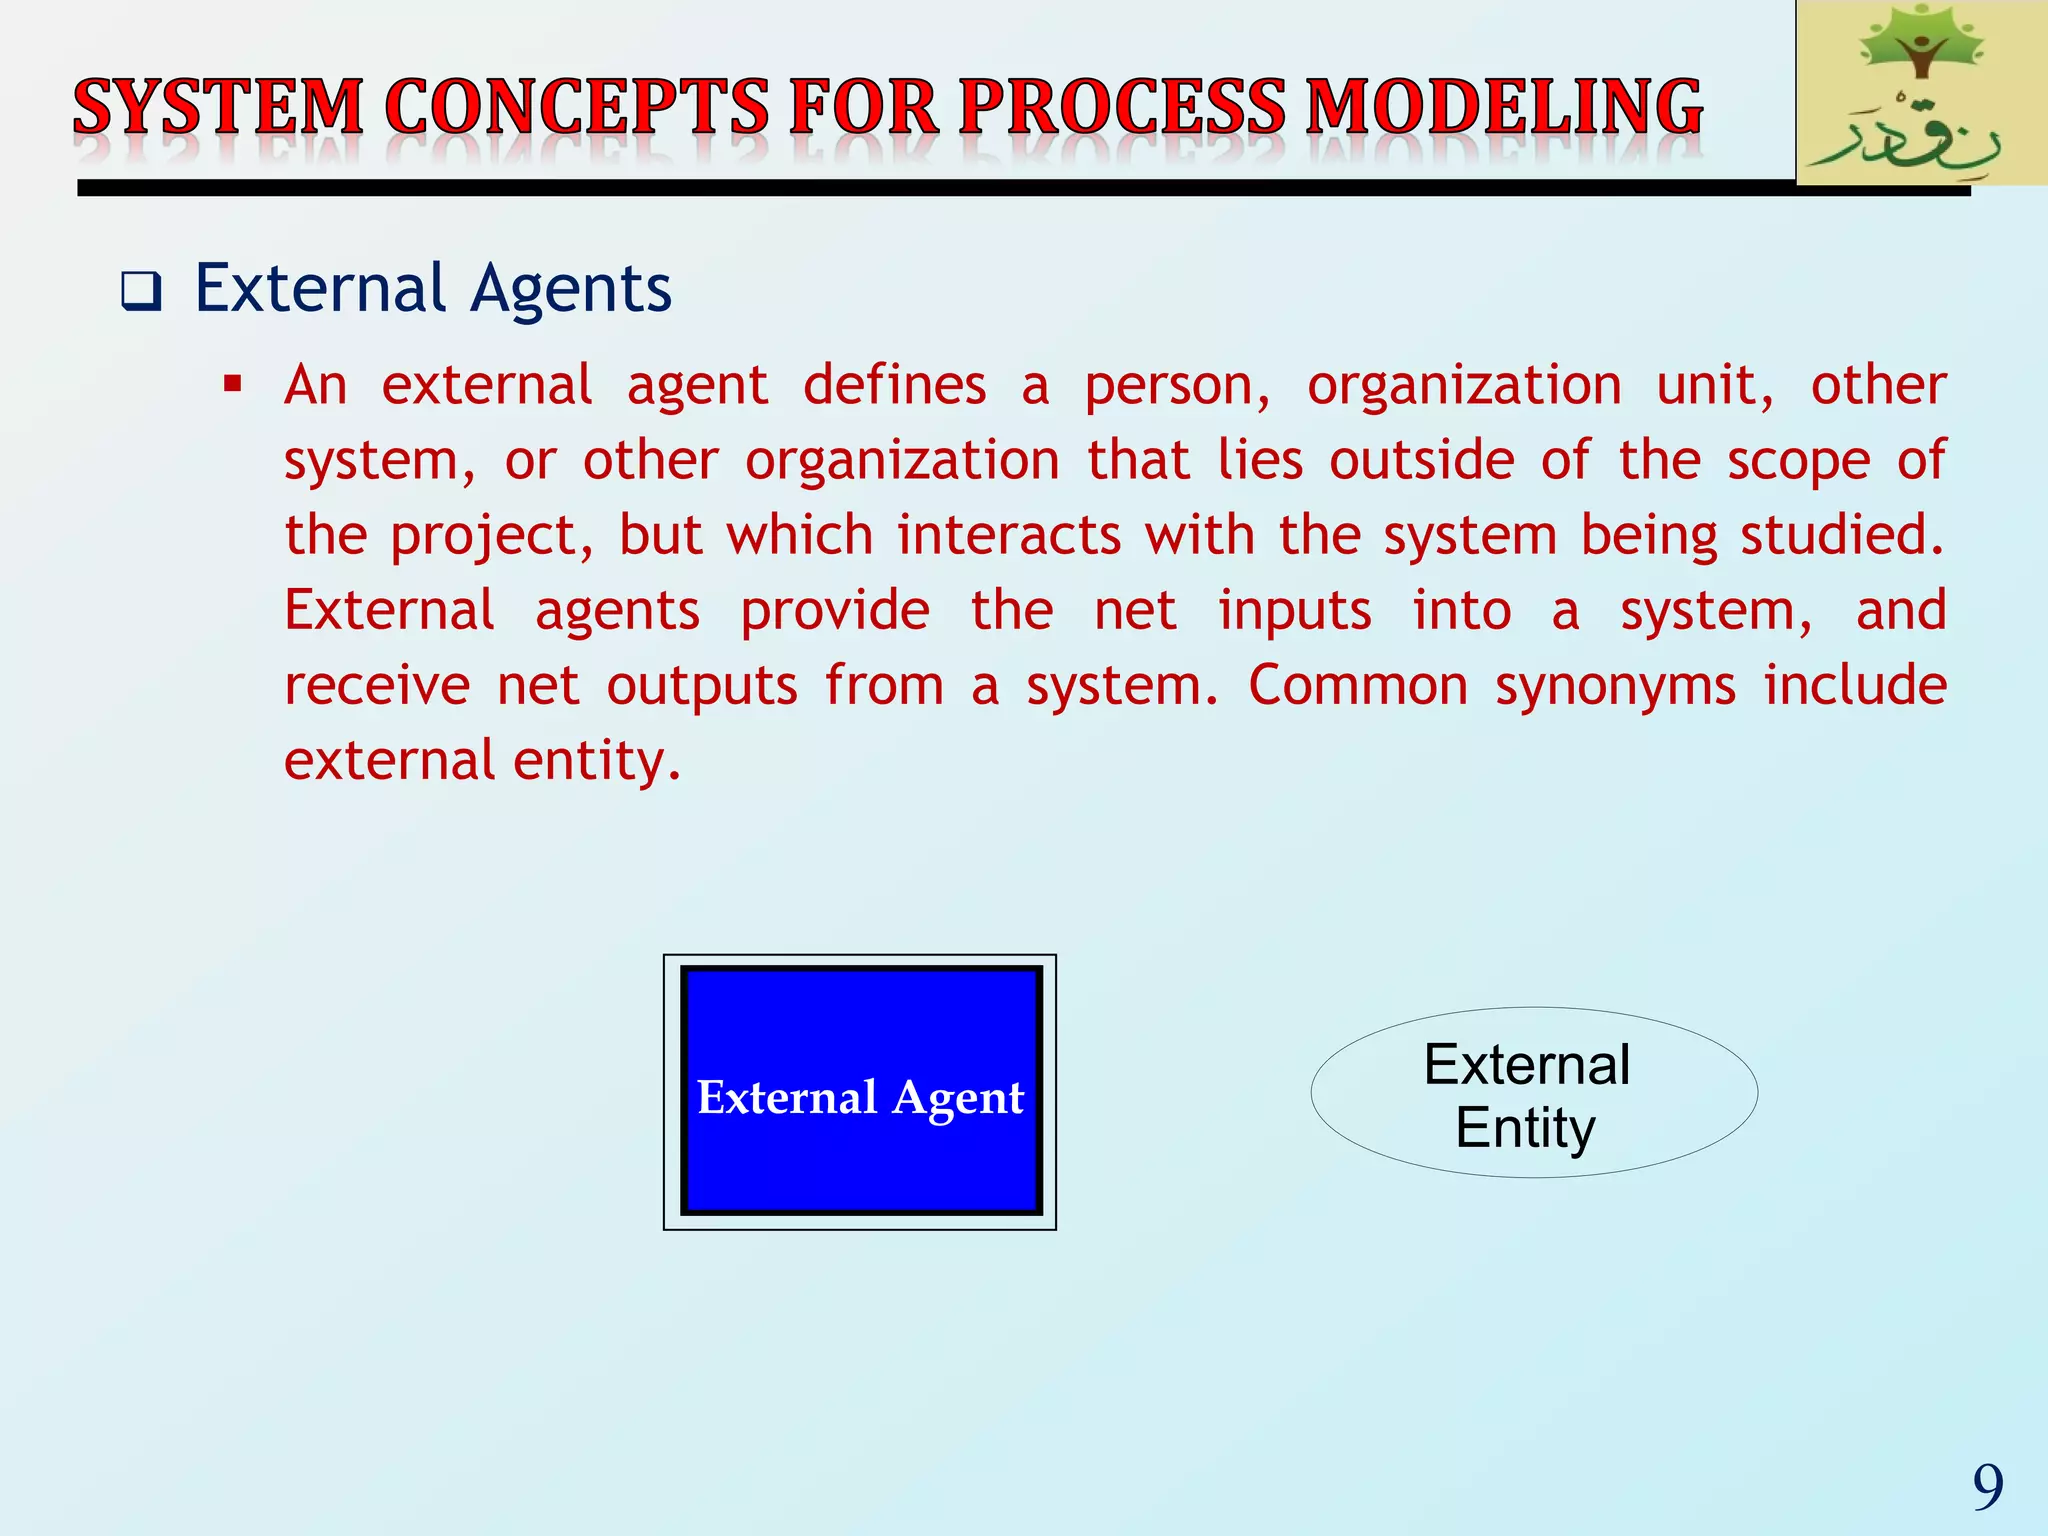
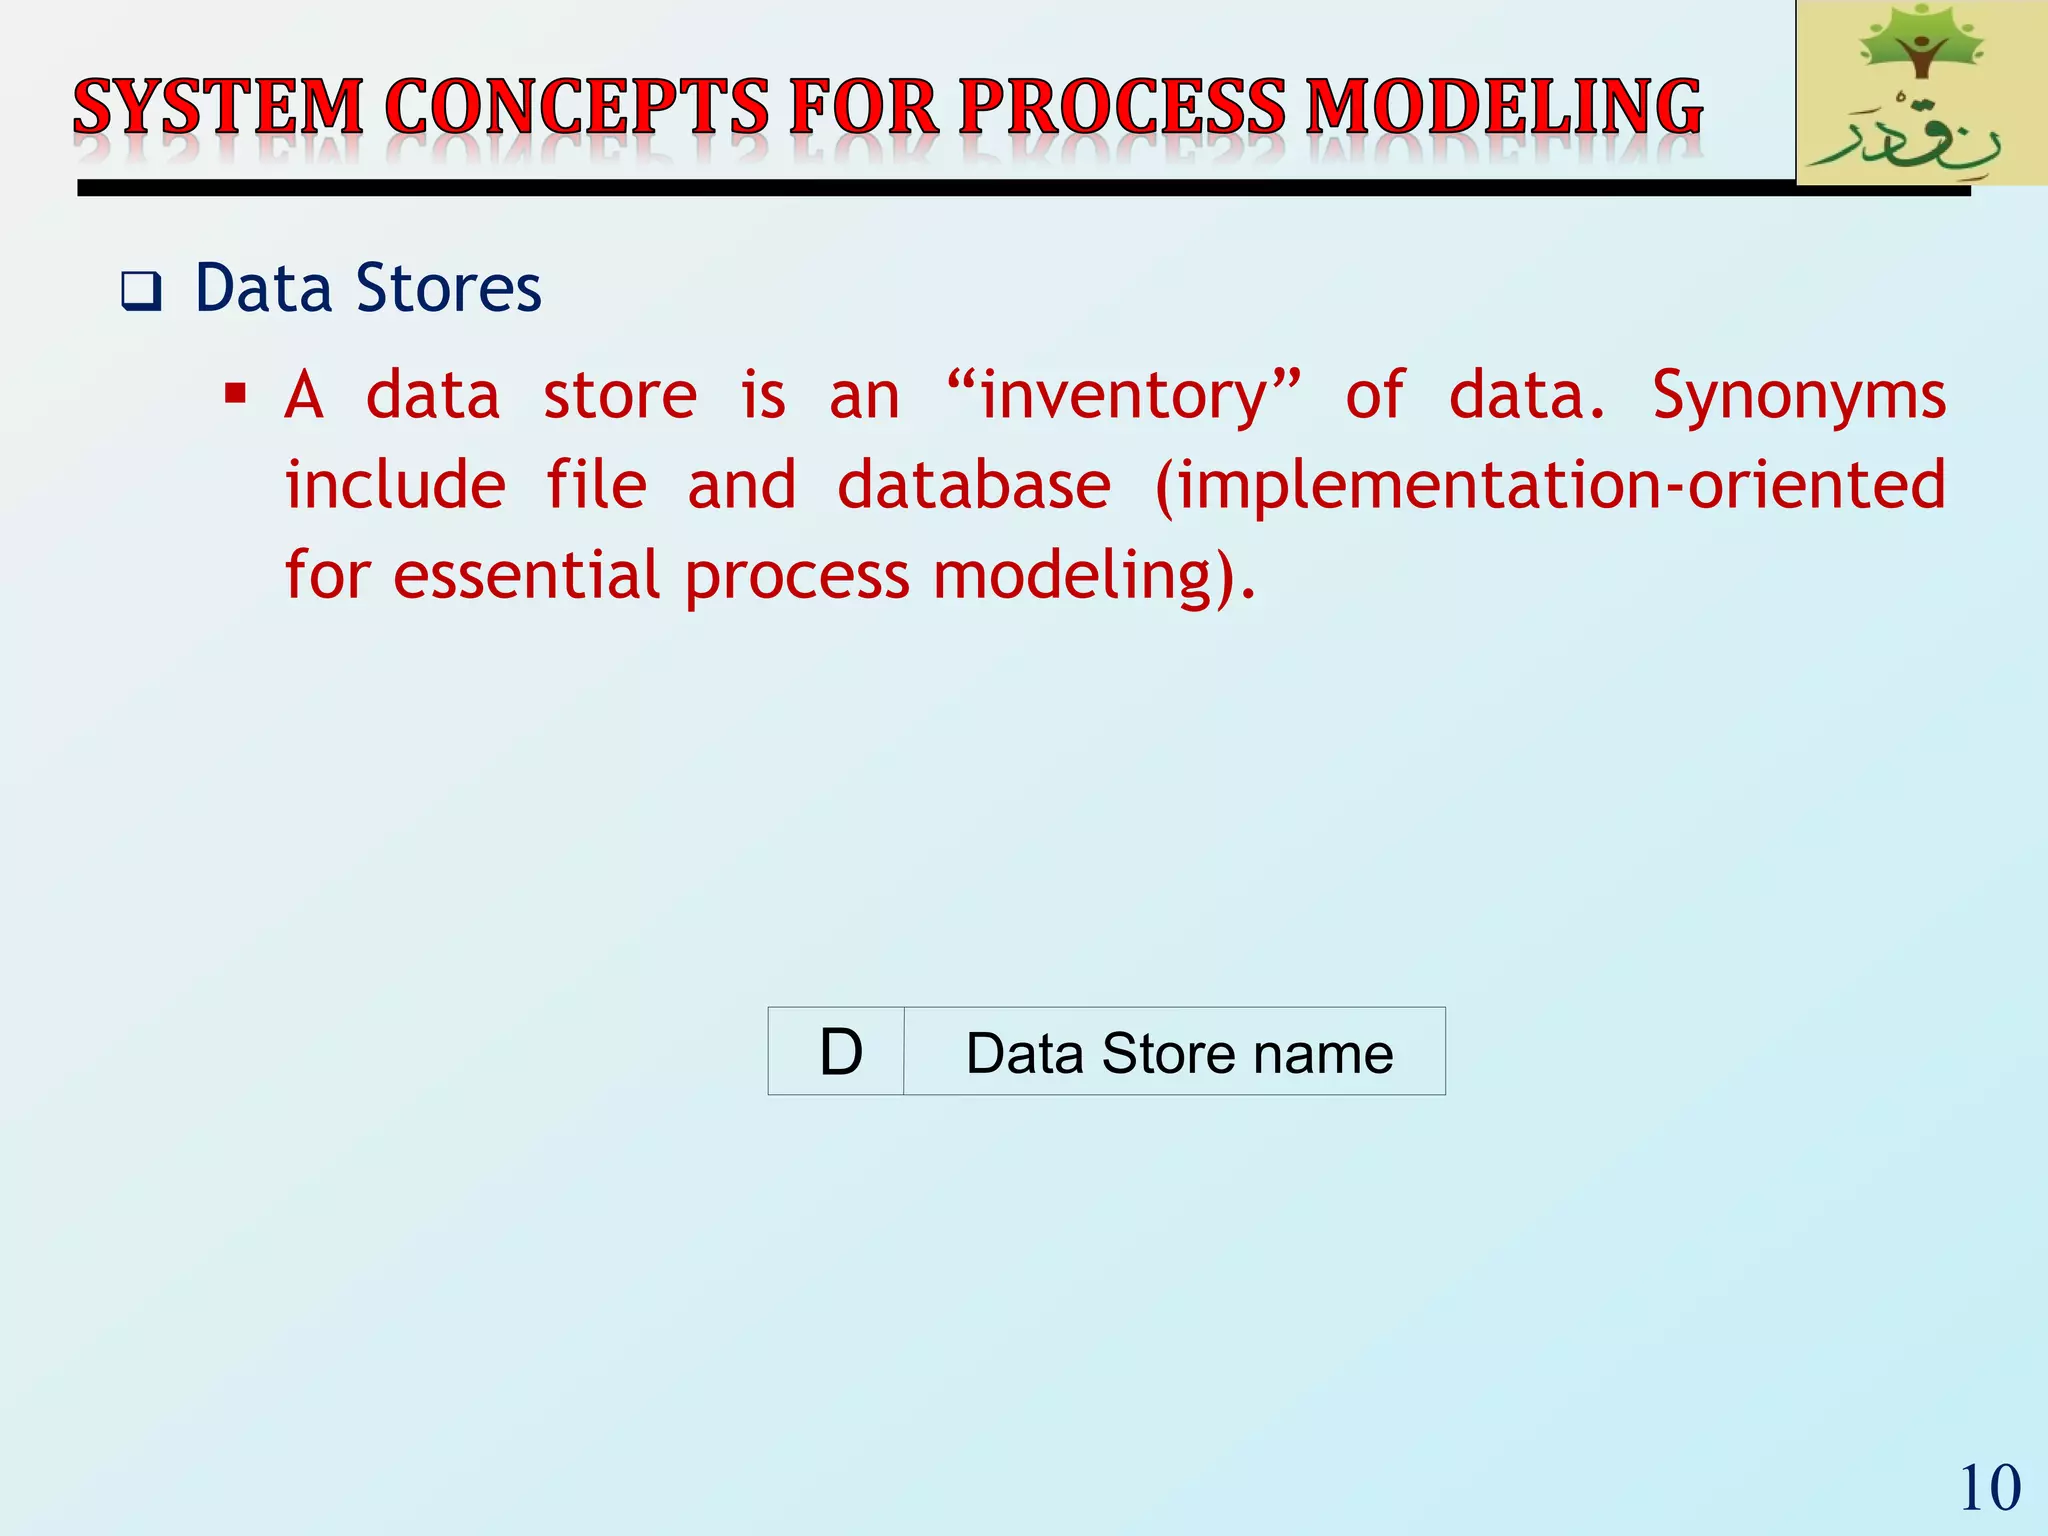
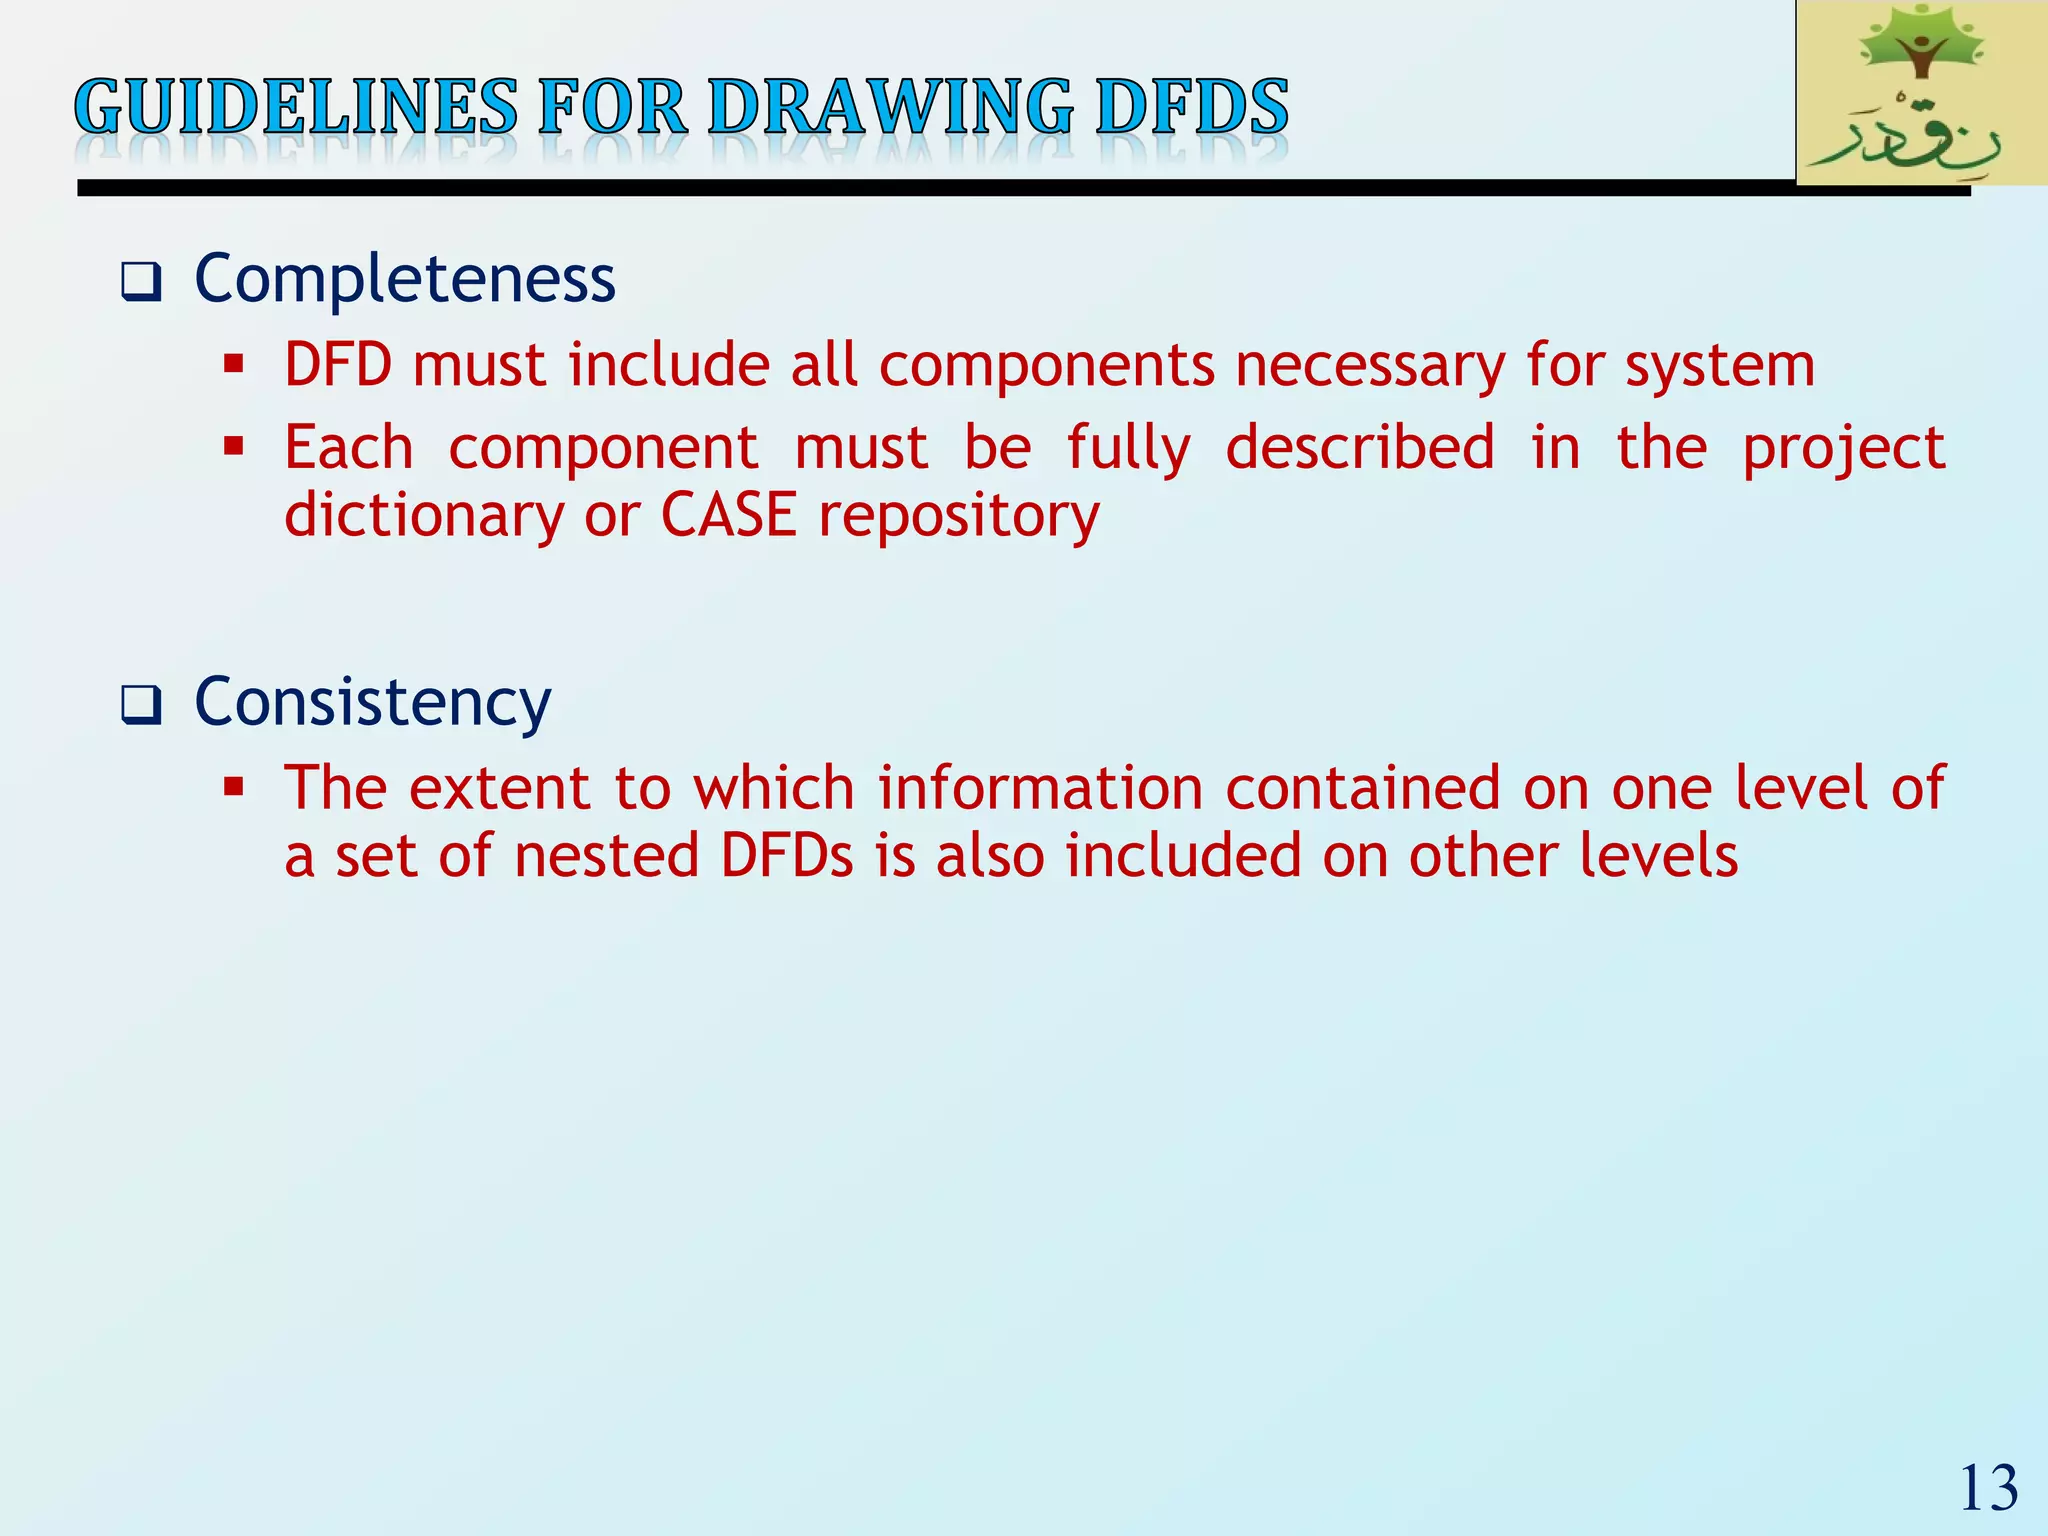
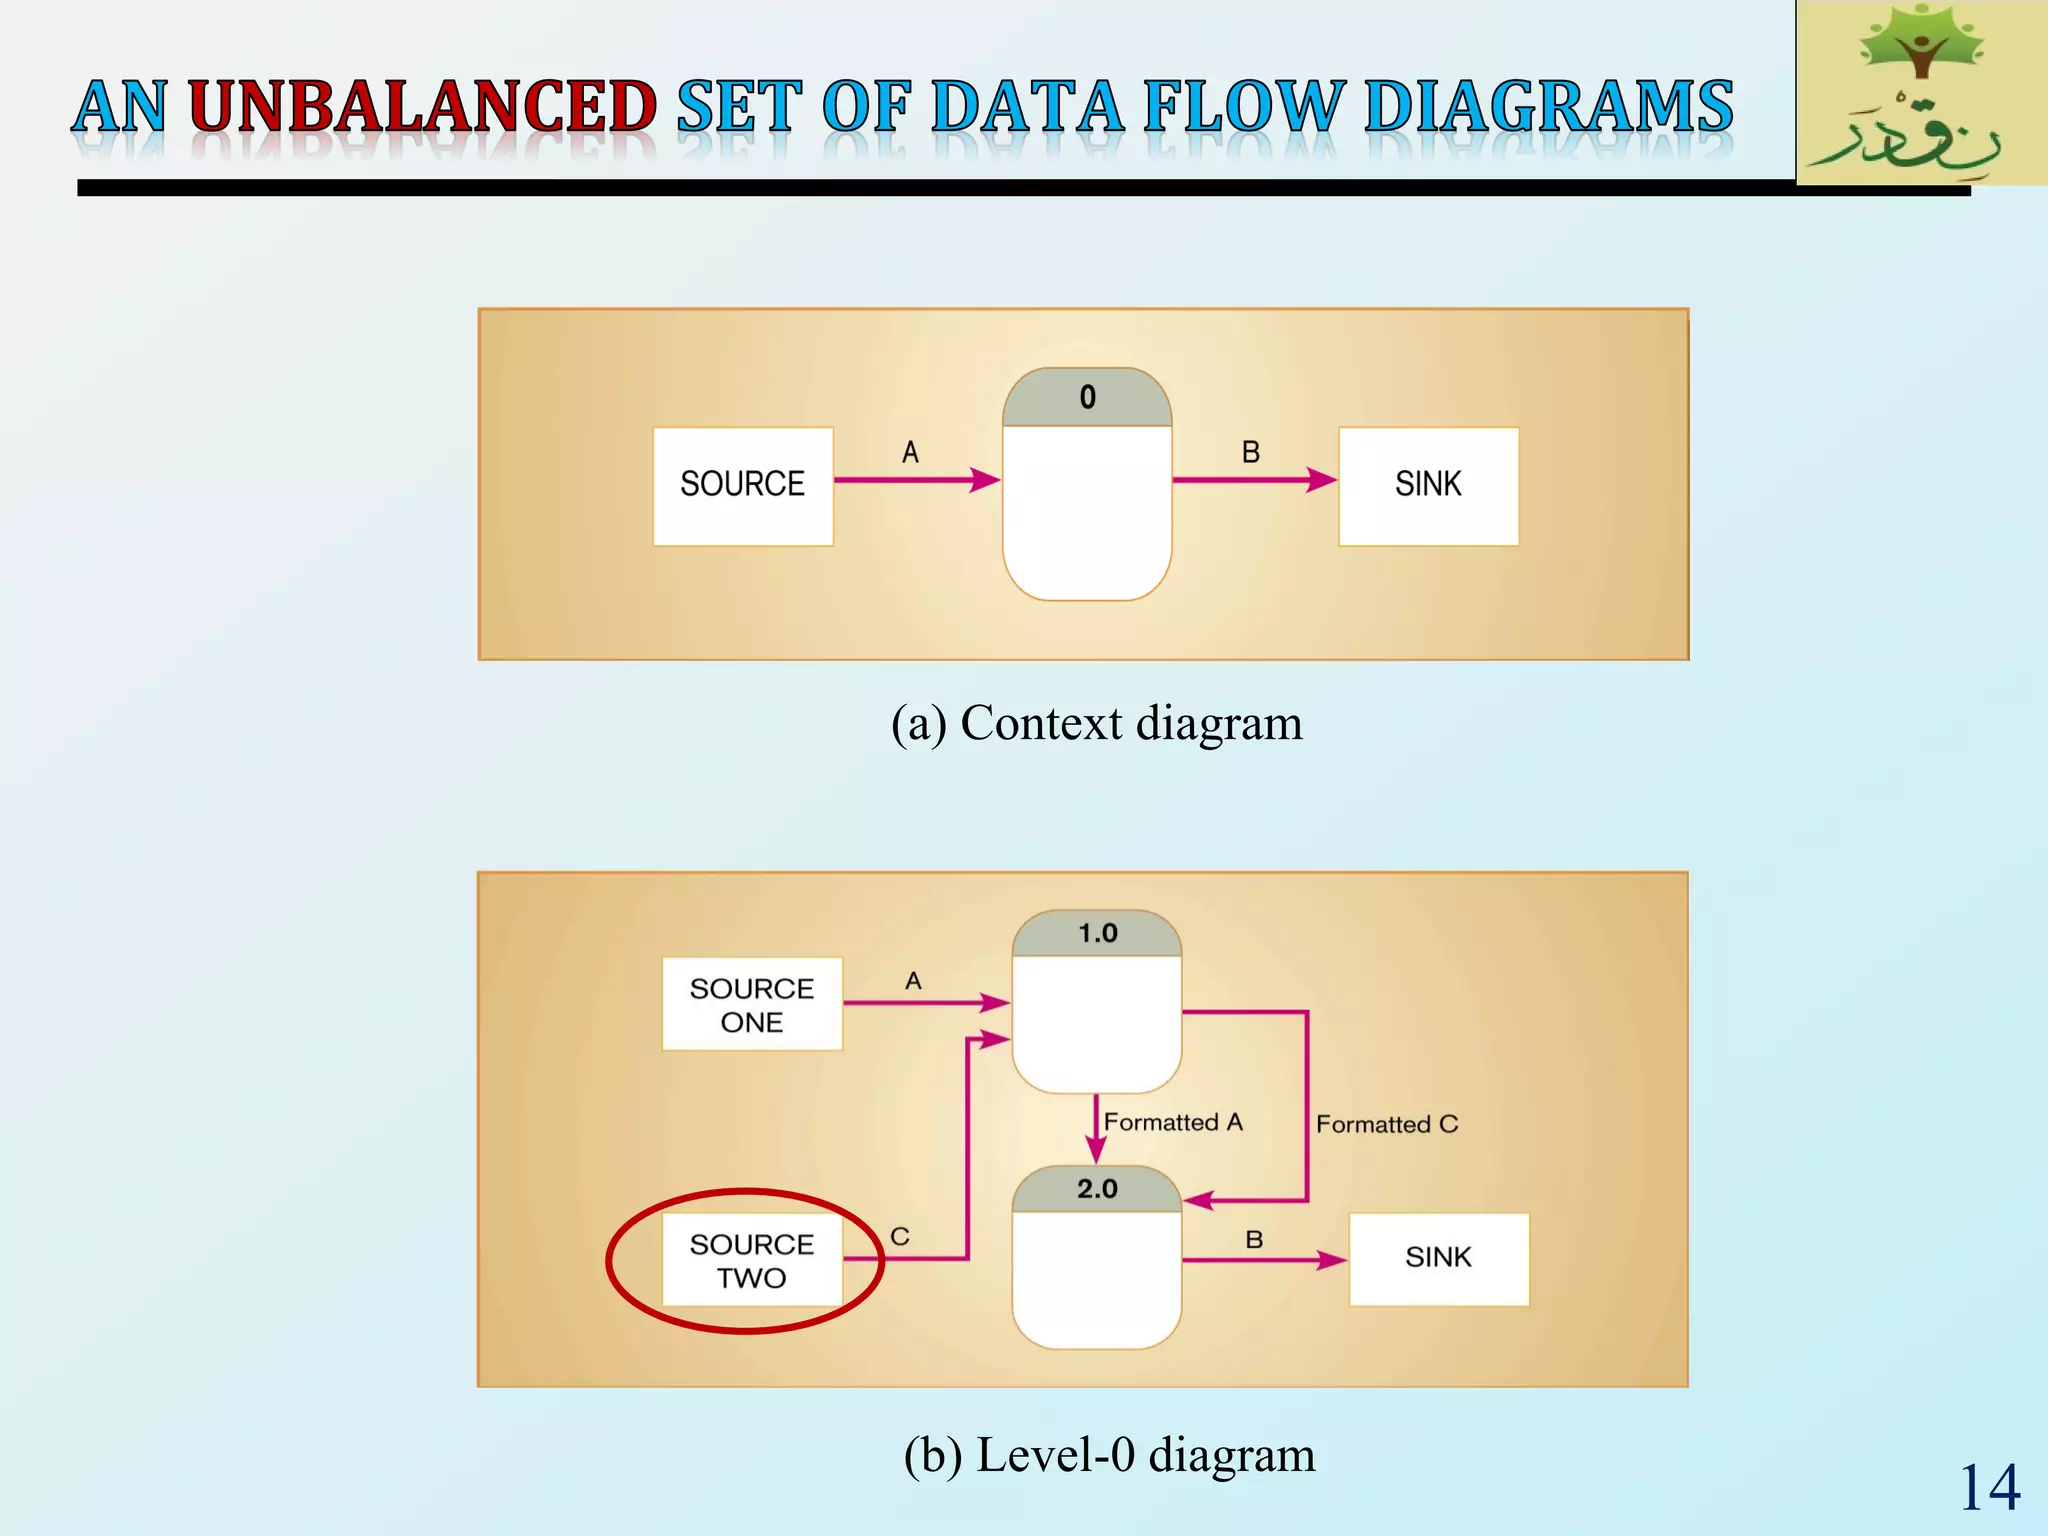
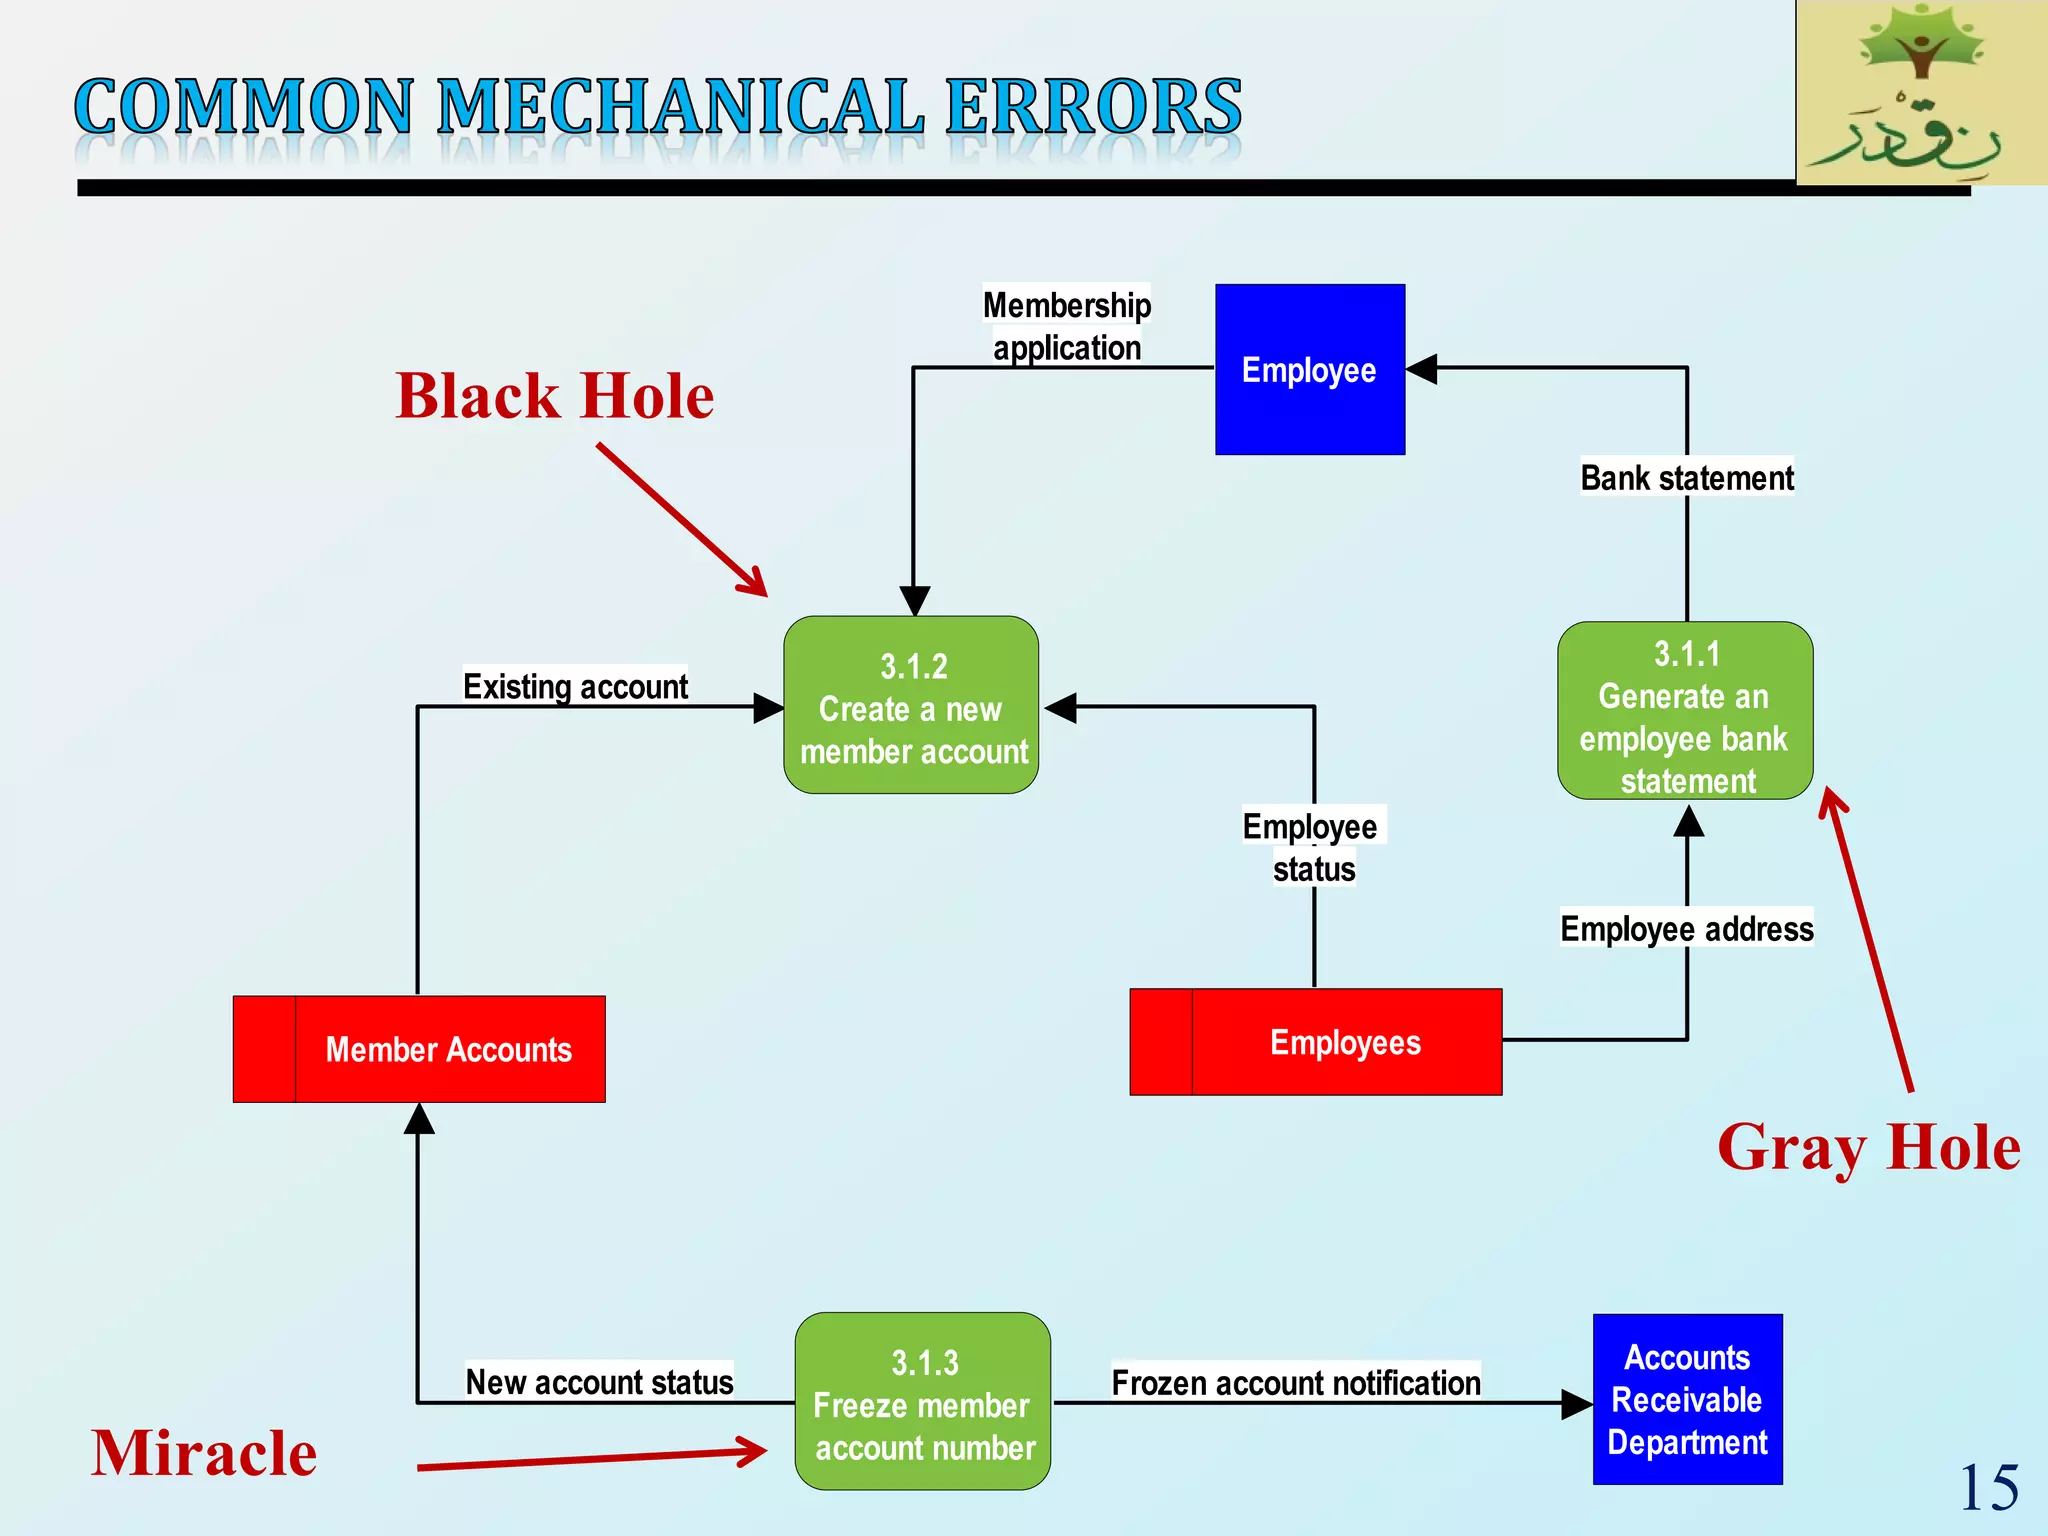
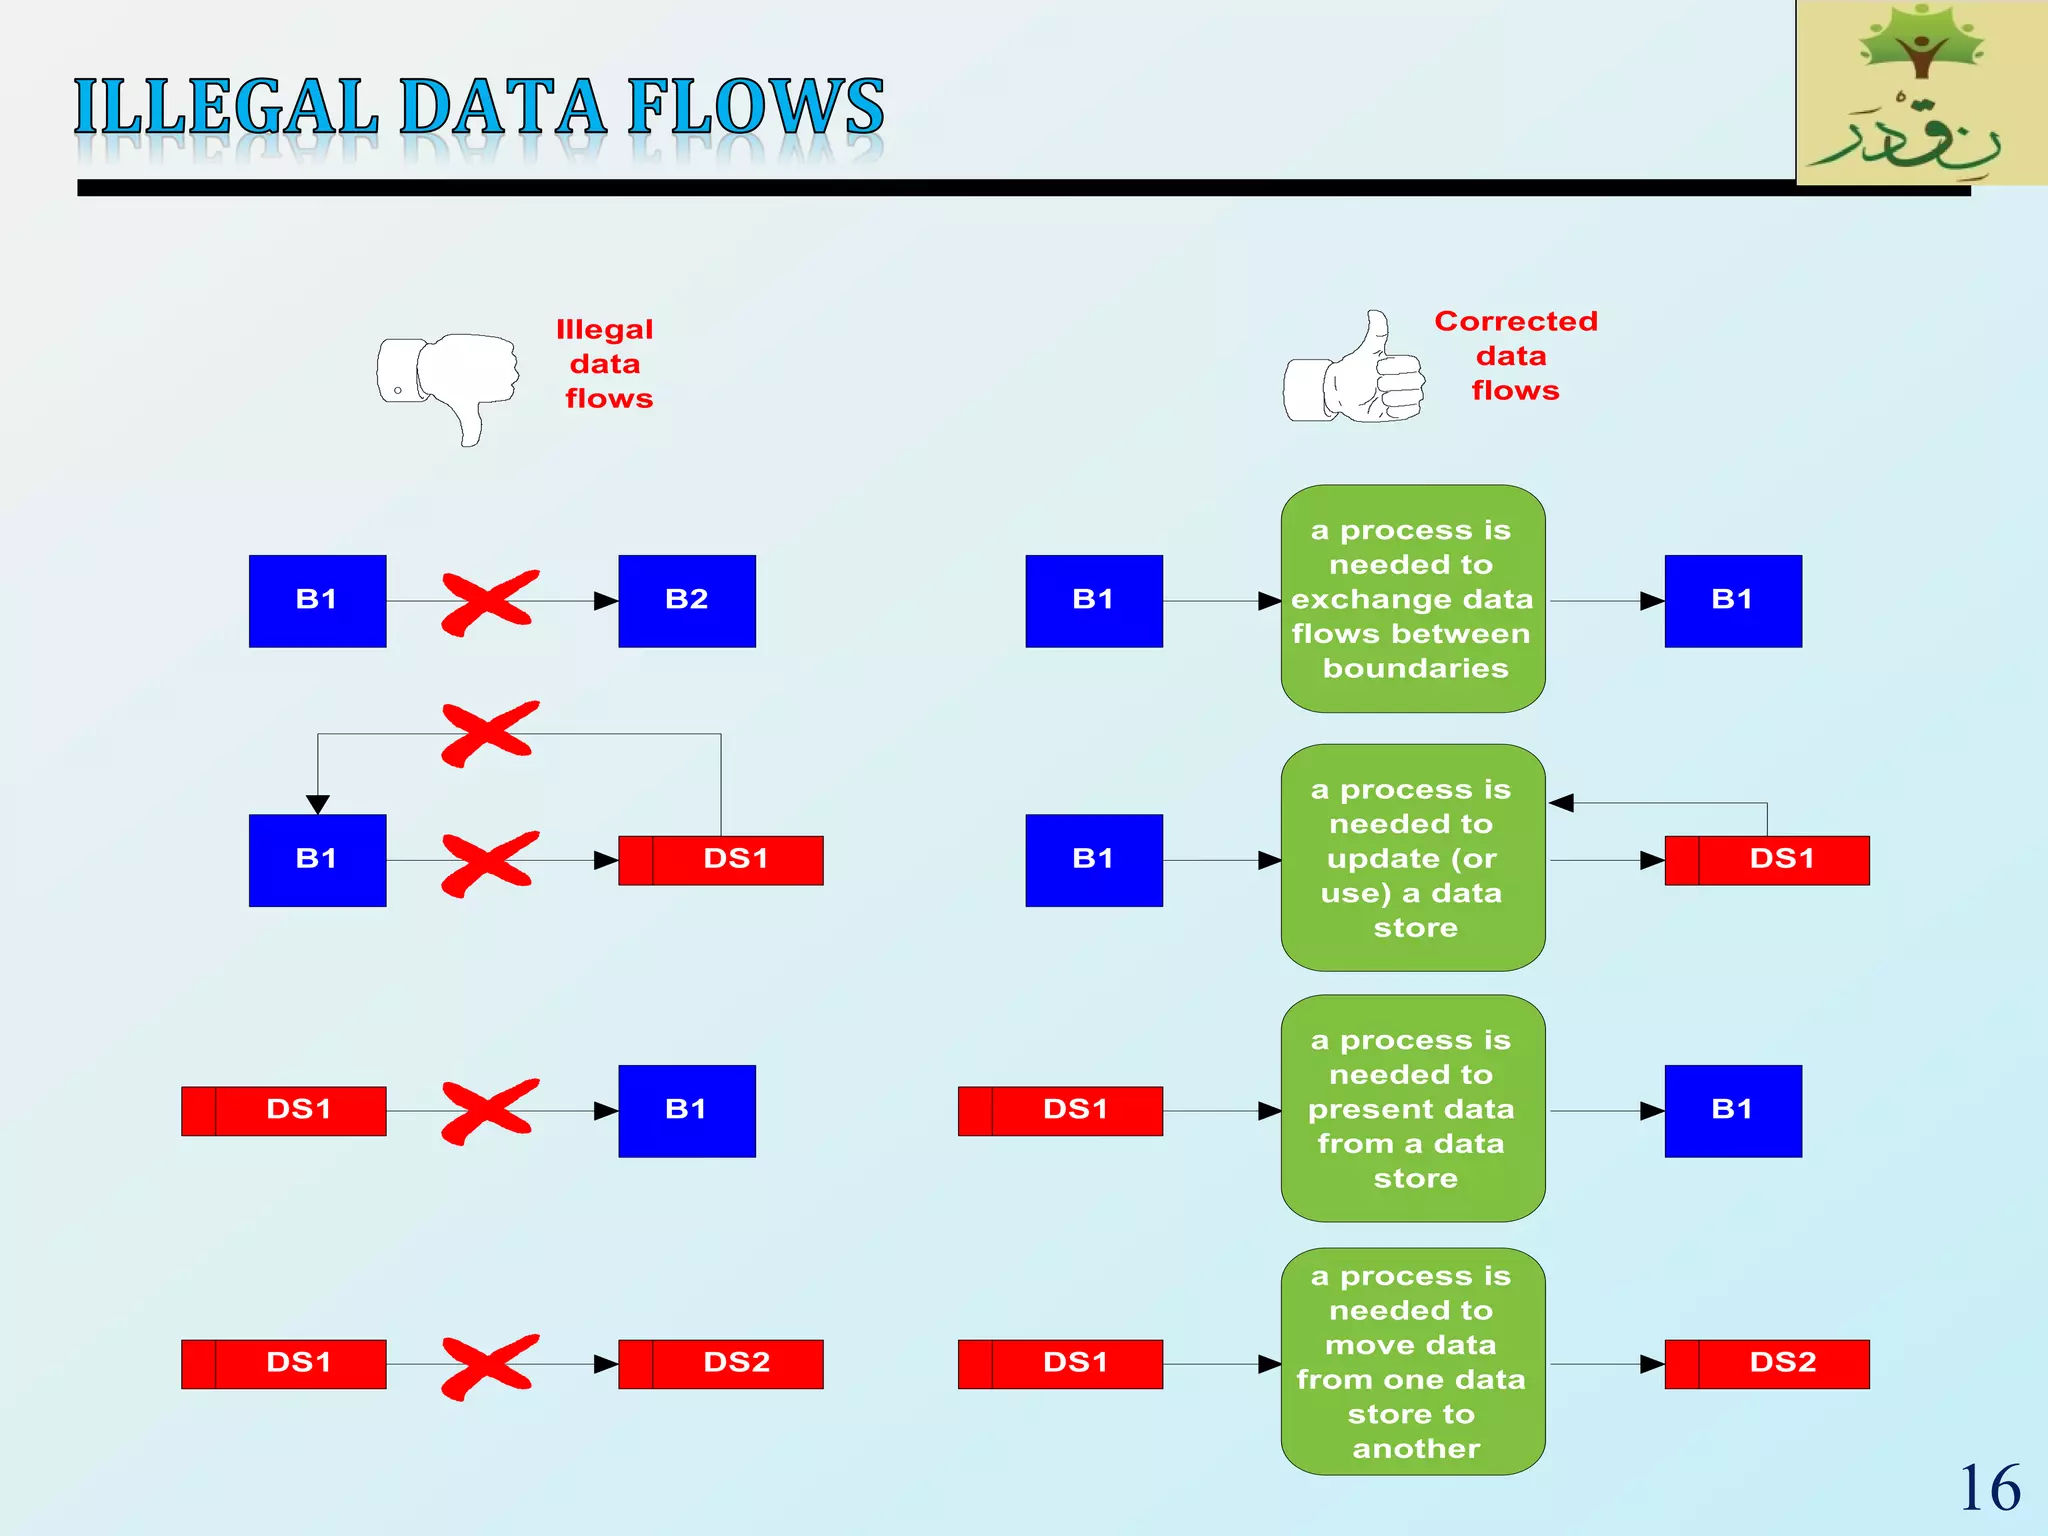
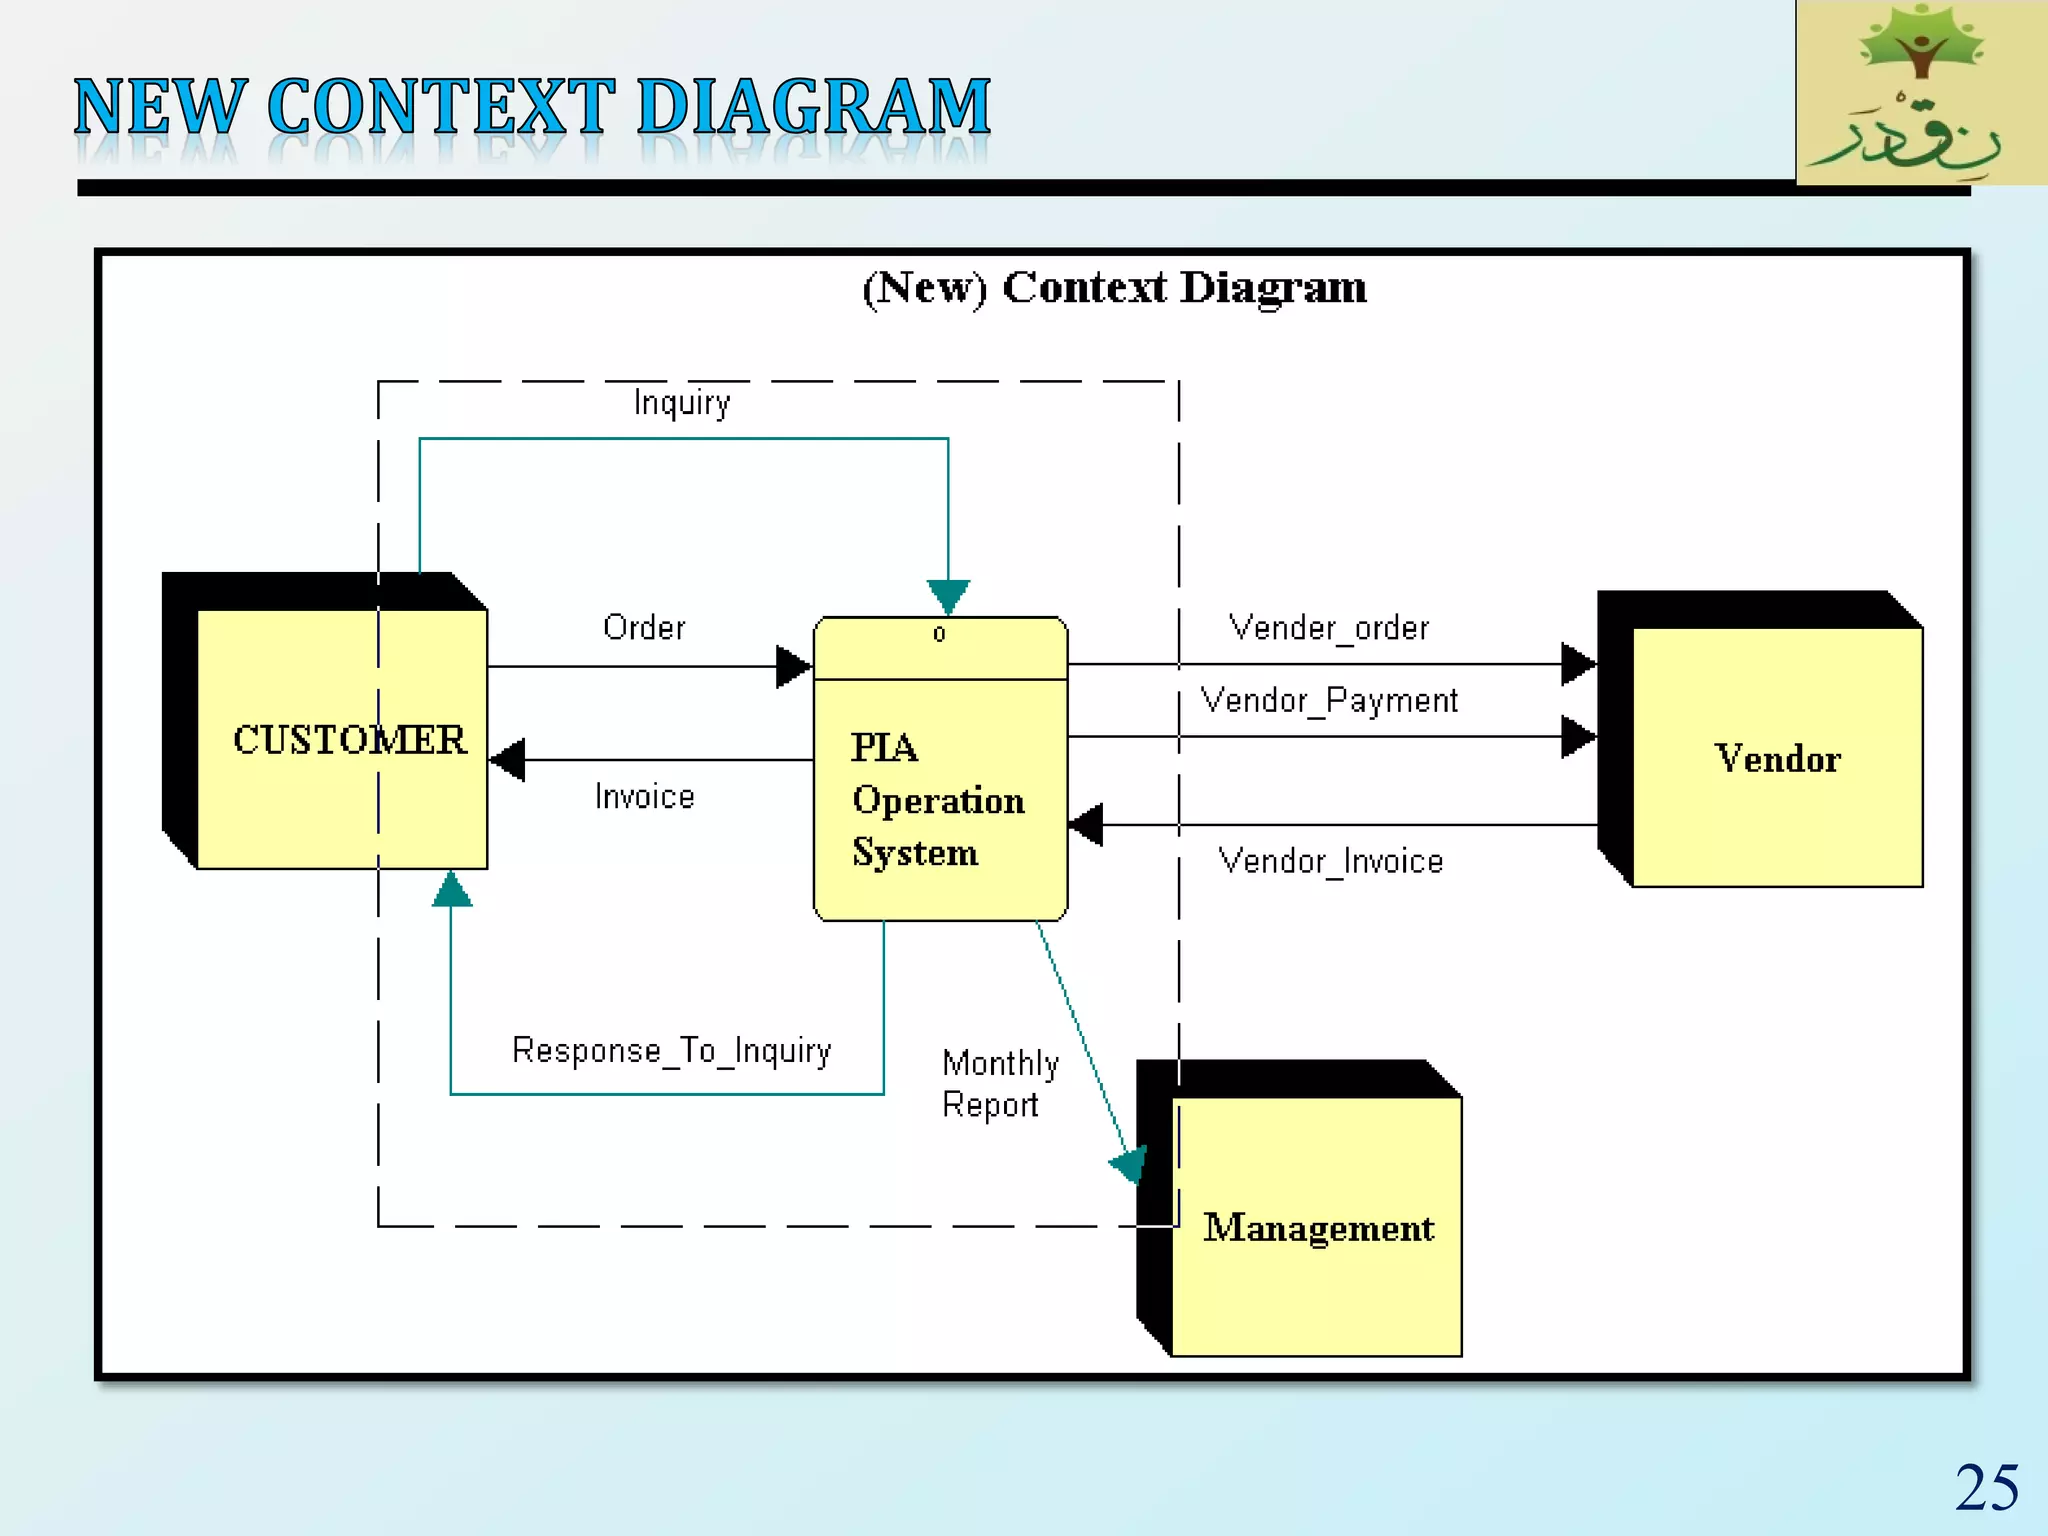
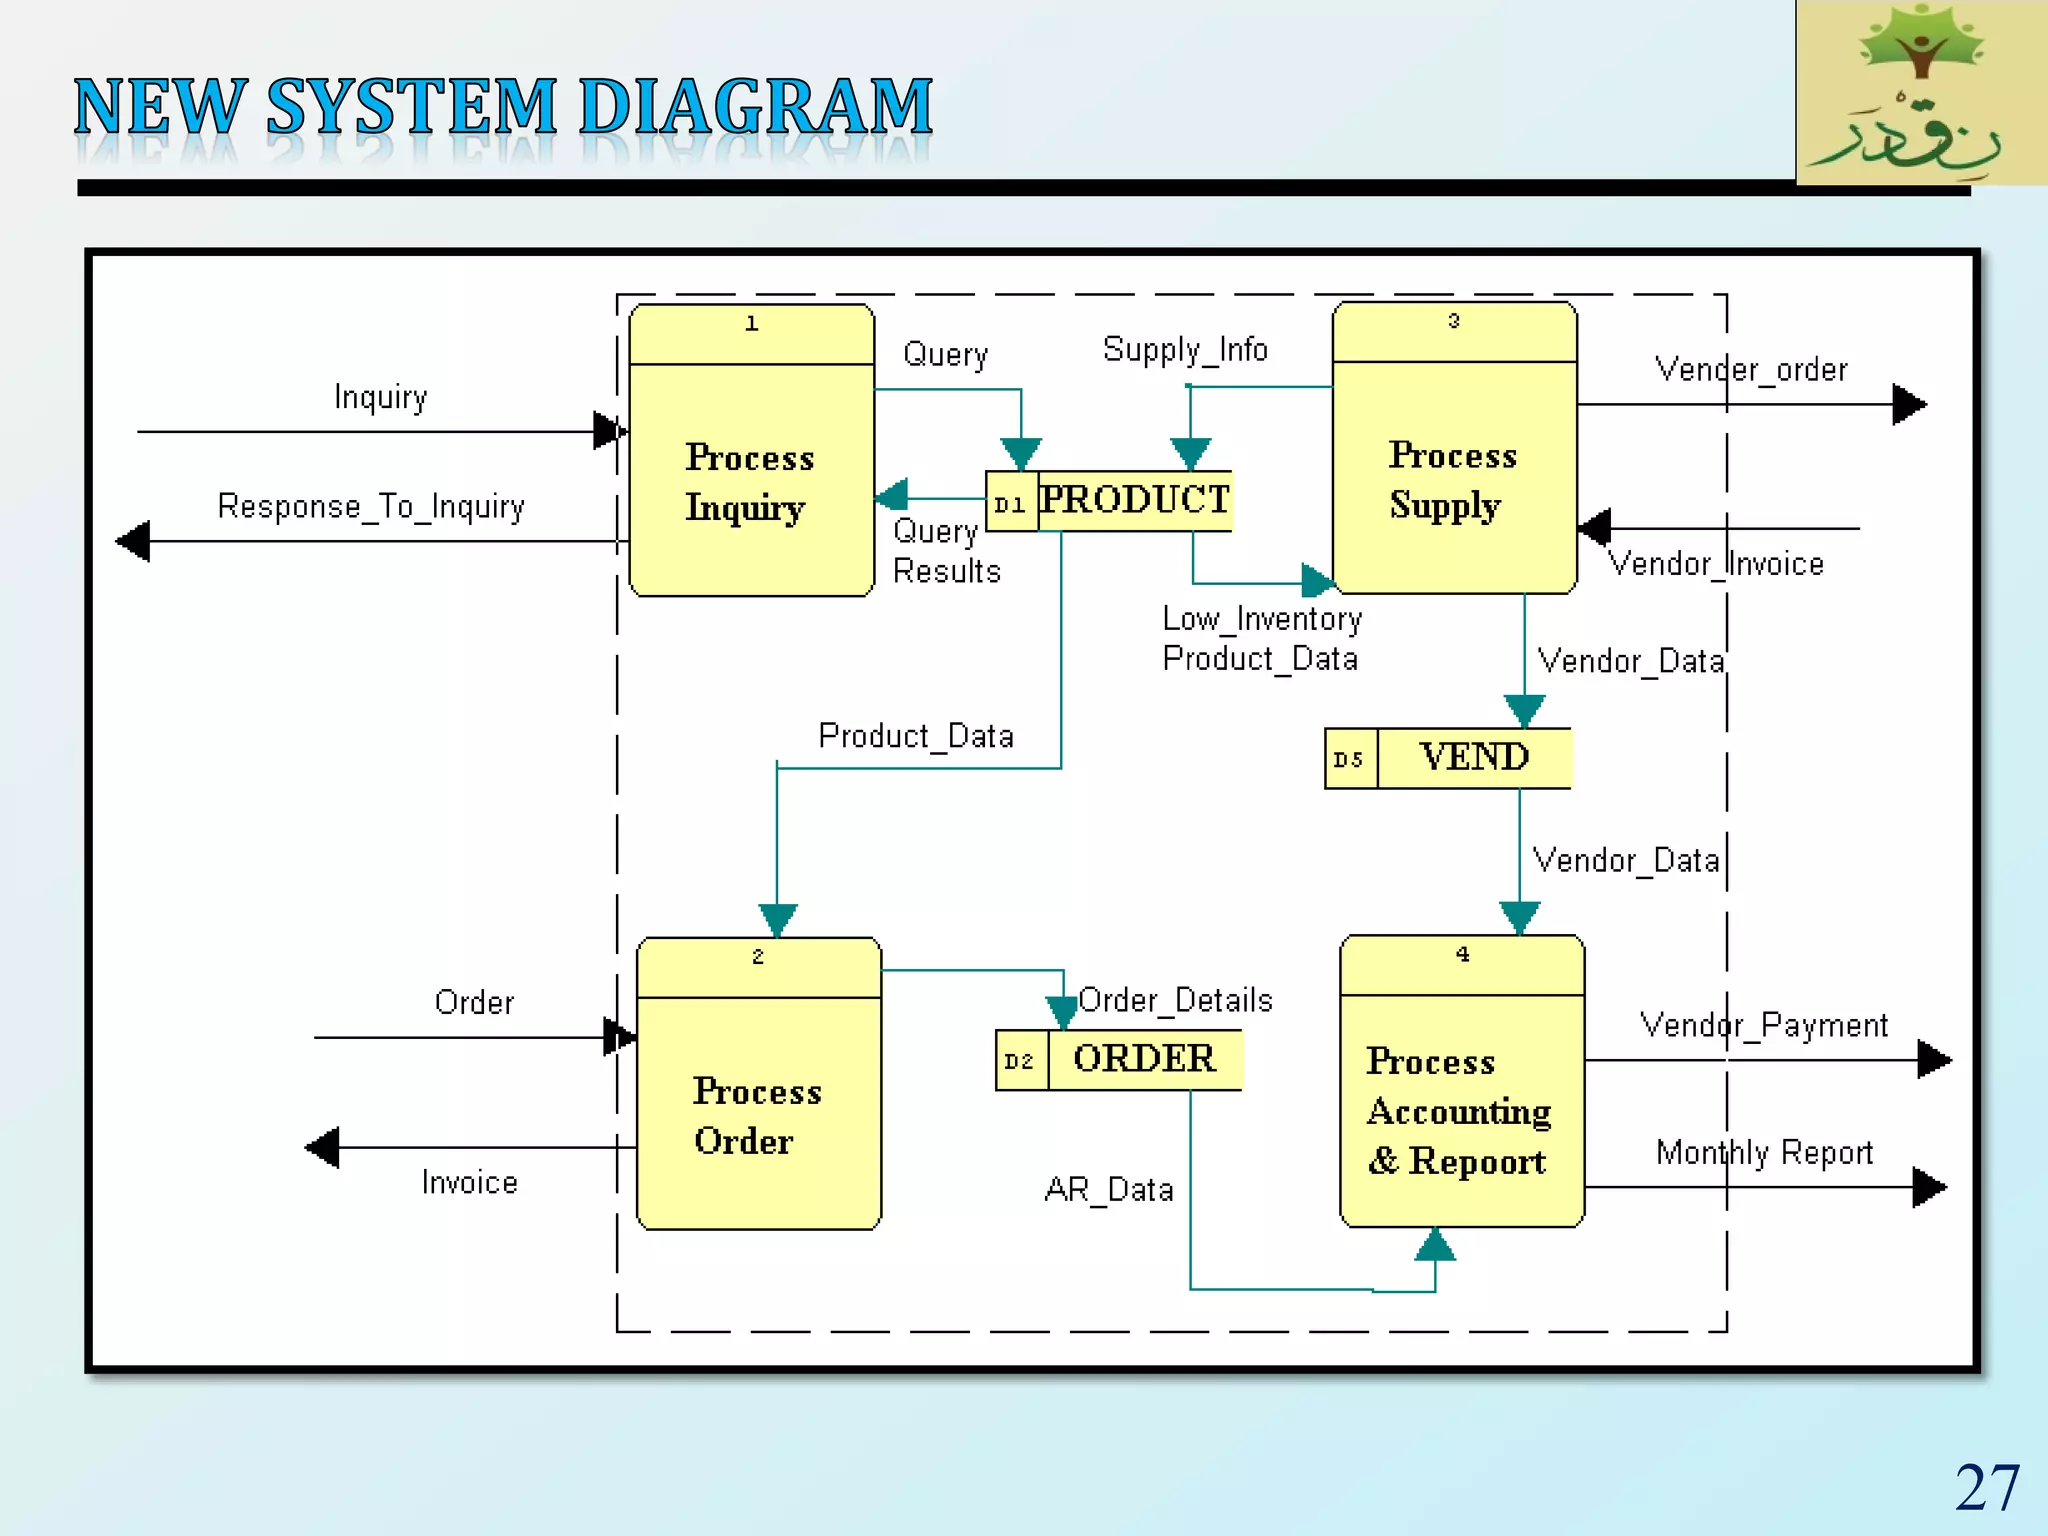
1
‫ر‬َ‫ـد‬ْ‫ق‬‫ِـ‬‫ن‬،،،‫لما‬‫اننا‬ ‫نصدق‬ْْ‫ق‬ِ‫ن‬‫ر‬َ‫د‬
Faculty of Engineering - Helwan University
2
 Discussion
 Systems Theory (Input-Process-Output)
 Process Modeling and Mechanics of DFDs
 Current System Process Modeling
 Future System Process Modeling
3
 A System is a Process
 The simplest process model of a system is based on inputs,
outputs, and the system itself – viewed a process.
 The process symbol defines the boundary of the system.
 The system is inside the boundary; the environment is
outside that boundary.
 The system exchanges inputs and outputs with its
environment
4
 Logical models: show what a system ‘is’ or ‘does’. They
are implementation-independent; that is, they depict
the system independent of any technical
implementation. As such, logical models illustrate the
essence of the system. Popular synonyms include
essential model, conceptual model, and business model.
 Physical models: show not only what a system ‘is’ or
‘does’, but also how the system is physically and
technically implemented. They are implementation-
dependent because they reflect technology choices, and
the limitations of those technology choices. Synonyms
include implementation model and technical model
5
 Process modeling is a technique for organizing and
documenting the structure and flow of data through a
system’s PROCESSES and/or the logic, policies, and
procedures to be implemented by a system’s PROCESSES.
 Process modeling originated in classical software
engineering methods.
 A systems analysis process model consists of data flow
diagrams (DFDs).
 A data flow diagram (DFD) is a tool that depicts the flow
of data through a system and the work or processing
performed by that system.
 Synonyms include bubble chart, transformation graph, and
process model.
6
 There are only three symbols and one
connection:
 The rounded rectangles represent processes or work
to be done.
 The squares represent external agents – the boundary
of the system.
 The open-ended boxes represent data stores,
sometimes called files or databases, and correspond
to all instances of a single entity in a data model.
 The arrows represent data flows, or inputs and
outputs, to and from the processes.
7
 You should be left only with logical processes that:
 Perform computations (e.g., calculate grade point average)
 Make decisions (determine availability of ordered products)
 Sort, filter or otherwise summarize data (identify overdue
invoices)
 Organize data into useful information (e.g., generate a report
or answer a question)
 Trigger other processes (e.g., turn on the furnace or instruct a
robot)
 Use stored data (create, read, update or delete a record)
Process Name Process Name
8
 Data in Motion
 A data flow is data in motion.
• A data flow represents an input of data to a process, or the
output of data (or information) from a process. A data flow is
also used to represent the creation, deletion, or update of
data in a file or database (called a data store on the DFD).
• A data flow is depicted as a solid-line with arrow.
Name of data-flow
9
 External Agents
 An external agent defines a person, organization unit, other
system, or other organization that lies outside of the scope of
the project, but which interacts with the system being studied.
External agents provide the net inputs into a system, and
receive net outputs from a system. Common synonyms include
external entity.
External Agent
External
Entity
10
 Data Stores
 A data store is an “inventory” of data. Synonyms
include file and database (implementation-oriented
for essential process modeling).
D Data Store name
11
 Context Diagram
 A data flow diagram (DFD) of the scope of an
organizational system that shows the system
boundaries, external entities that interact with the
system and the major information flows between the
entities and the system
 Level-0 Diagram
 A data flow diagram (DFD) that represents a system’s
major processes, data flows and data stores at a high
level of detail
12
 Functional decomposition
 Act of going from one single system to many
component processes
 Repetitive procedure
 Level-N Diagrams
 A DFD that is the result of n nested decompositions of
a series of subprocesses from a process on a level-0
diagram
13
 Completeness
 DFD must include all components necessary for system
 Each component must be fully described in the project
dictionary or CASE repository
 Consistency
 The extent to which information contained on one level of
a set of nested DFDs is also included on other levels
14
(a) Context diagram
(b) Level-0 diagram
15
3.1.2
Create a new
member account
3.1.1
Generate an
employee bank
statement
3.1.3
Freeze member
account number
Accounts
Receivable
Department
Employee
Member Accounts Employees
Existing account
New account status
Employee
status
Frozen account notification
Employee address
Bank statement
Membership
application
Black Hole
Miracle
Gray Hole
16
B1 B2 B1 B1
B1 B1
B1 B1
DS1 DS2 DS1
a process is
needed to
exchange data
flows between
boundaries
a process is
needed to
update (or
use) a data
store
a process is
needed to
present data
from a data
store
a process is
needed to
move data
from one data
store to
another
DS2
DS1
DS1 DS1
DS1
Illegal
data
flows
Corrected
data
flows
17
 Logical processes are work or actions that must be performed
no matter how you implement the system.
 Even for the future system, at the definition phase, the process
model should be logical.
 In the study phase, the current system was analyzed in three
levels of models:
 Context Diagram
 System Diagram
 Event Diagrams
 A function is a set of related and on-going activities of the
business.
 An event is a logical unit of work that must be completed as
a whole. An event is triggered by a discrete input, and is
completed when the process has responded with appropriate
outputs. Events are sometimes called transactions.
18
19
20
21
 Step 1: Identify the changes in functional requirements
for the new system
 Step 2: Establish the context for the new system
 Step 3: Create a new system diagram
 Step 4: Create necessary child diagrams
22
 Source: Problem Statement (Cause/Effect)
 Prioritize the “System Objectives” based on the
urgency/importance of the effects
 Regroup the objectives into changes in
functional requirements
e.g.,
 Operational requirements,
 Reporting/Inquiry requirements
23
24
 Analyze the new functional requirements in terms of
necessary input/output of data i.e.,
 Is there any new input?
 Is it necessary to produce new output?
 Is it going to allow new functions to external entities?
25
26
 Principles for creating new DFD
 Keep the model simple
 Try to use data stores to connect all the processes
 Identify the functions that must be affected by
the new functional requirements
 Determine the boundary of the new system
27
28
 Explode each function to depict the flow of data within
the function
 A list of events within the function will be helpful
 Add necessary data stores
29
30

SE2018_Lec 14_ Process Modeling and Data Flow Diagram.pptx

  • 1.
  • 2.
    2  Discussion  SystemsTheory (Input-Process-Output)  Process Modeling and Mechanics of DFDs  Current System Process Modeling  Future System Process Modeling
  • 3.
    3  A Systemis a Process  The simplest process model of a system is based on inputs, outputs, and the system itself – viewed a process.  The process symbol defines the boundary of the system.  The system is inside the boundary; the environment is outside that boundary.  The system exchanges inputs and outputs with its environment
  • 4.
    4  Logical models:show what a system ‘is’ or ‘does’. They are implementation-independent; that is, they depict the system independent of any technical implementation. As such, logical models illustrate the essence of the system. Popular synonyms include essential model, conceptual model, and business model.  Physical models: show not only what a system ‘is’ or ‘does’, but also how the system is physically and technically implemented. They are implementation- dependent because they reflect technology choices, and the limitations of those technology choices. Synonyms include implementation model and technical model
  • 5.
    5  Process modelingis a technique for organizing and documenting the structure and flow of data through a system’s PROCESSES and/or the logic, policies, and procedures to be implemented by a system’s PROCESSES.  Process modeling originated in classical software engineering methods.  A systems analysis process model consists of data flow diagrams (DFDs).  A data flow diagram (DFD) is a tool that depicts the flow of data through a system and the work or processing performed by that system.  Synonyms include bubble chart, transformation graph, and process model.
  • 6.
    6  There areonly three symbols and one connection:  The rounded rectangles represent processes or work to be done.  The squares represent external agents – the boundary of the system.  The open-ended boxes represent data stores, sometimes called files or databases, and correspond to all instances of a single entity in a data model.  The arrows represent data flows, or inputs and outputs, to and from the processes.
  • 7.
    7  You shouldbe left only with logical processes that:  Perform computations (e.g., calculate grade point average)  Make decisions (determine availability of ordered products)  Sort, filter or otherwise summarize data (identify overdue invoices)  Organize data into useful information (e.g., generate a report or answer a question)  Trigger other processes (e.g., turn on the furnace or instruct a robot)  Use stored data (create, read, update or delete a record) Process Name Process Name
  • 8.
    8  Data inMotion  A data flow is data in motion. • A data flow represents an input of data to a process, or the output of data (or information) from a process. A data flow is also used to represent the creation, deletion, or update of data in a file or database (called a data store on the DFD). • A data flow is depicted as a solid-line with arrow. Name of data-flow
  • 9.
    9  External Agents An external agent defines a person, organization unit, other system, or other organization that lies outside of the scope of the project, but which interacts with the system being studied. External agents provide the net inputs into a system, and receive net outputs from a system. Common synonyms include external entity. External Agent External Entity
  • 10.
    10  Data Stores A data store is an “inventory” of data. Synonyms include file and database (implementation-oriented for essential process modeling). D Data Store name
  • 11.
    11  Context Diagram A data flow diagram (DFD) of the scope of an organizational system that shows the system boundaries, external entities that interact with the system and the major information flows between the entities and the system  Level-0 Diagram  A data flow diagram (DFD) that represents a system’s major processes, data flows and data stores at a high level of detail
  • 12.
    12  Functional decomposition Act of going from one single system to many component processes  Repetitive procedure  Level-N Diagrams  A DFD that is the result of n nested decompositions of a series of subprocesses from a process on a level-0 diagram
  • 13.
    13  Completeness  DFDmust include all components necessary for system  Each component must be fully described in the project dictionary or CASE repository  Consistency  The extent to which information contained on one level of a set of nested DFDs is also included on other levels
  • 14.
  • 15.
    15 3.1.2 Create a new memberaccount 3.1.1 Generate an employee bank statement 3.1.3 Freeze member account number Accounts Receivable Department Employee Member Accounts Employees Existing account New account status Employee status Frozen account notification Employee address Bank statement Membership application Black Hole Miracle Gray Hole
  • 16.
    16 B1 B2 B1B1 B1 B1 B1 B1 DS1 DS2 DS1 a process is needed to exchange data flows between boundaries a process is needed to update (or use) a data store a process is needed to present data from a data store a process is needed to move data from one data store to another DS2 DS1 DS1 DS1 DS1 Illegal data flows Corrected data flows
  • 17.
    17  Logical processesare work or actions that must be performed no matter how you implement the system.  Even for the future system, at the definition phase, the process model should be logical.  In the study phase, the current system was analyzed in three levels of models:  Context Diagram  System Diagram  Event Diagrams  A function is a set of related and on-going activities of the business.  An event is a logical unit of work that must be completed as a whole. An event is triggered by a discrete input, and is completed when the process has responded with appropriate outputs. Events are sometimes called transactions.
  • 18.
  • 19.
  • 20.
  • 21.
    21  Step 1:Identify the changes in functional requirements for the new system  Step 2: Establish the context for the new system  Step 3: Create a new system diagram  Step 4: Create necessary child diagrams
  • 22.
    22  Source: ProblemStatement (Cause/Effect)  Prioritize the “System Objectives” based on the urgency/importance of the effects  Regroup the objectives into changes in functional requirements e.g.,  Operational requirements,  Reporting/Inquiry requirements
  • 23.
  • 24.
    24  Analyze thenew functional requirements in terms of necessary input/output of data i.e.,  Is there any new input?  Is it necessary to produce new output?  Is it going to allow new functions to external entities?
  • 25.
  • 26.
    26  Principles forcreating new DFD  Keep the model simple  Try to use data stores to connect all the processes  Identify the functions that must be affected by the new functional requirements  Determine the boundary of the new system
  • 27.
  • 28.
    28  Explode eachfunction to depict the flow of data within the function  A list of events within the function will be helpful  Add necessary data stores
  • 29.
  • 30.