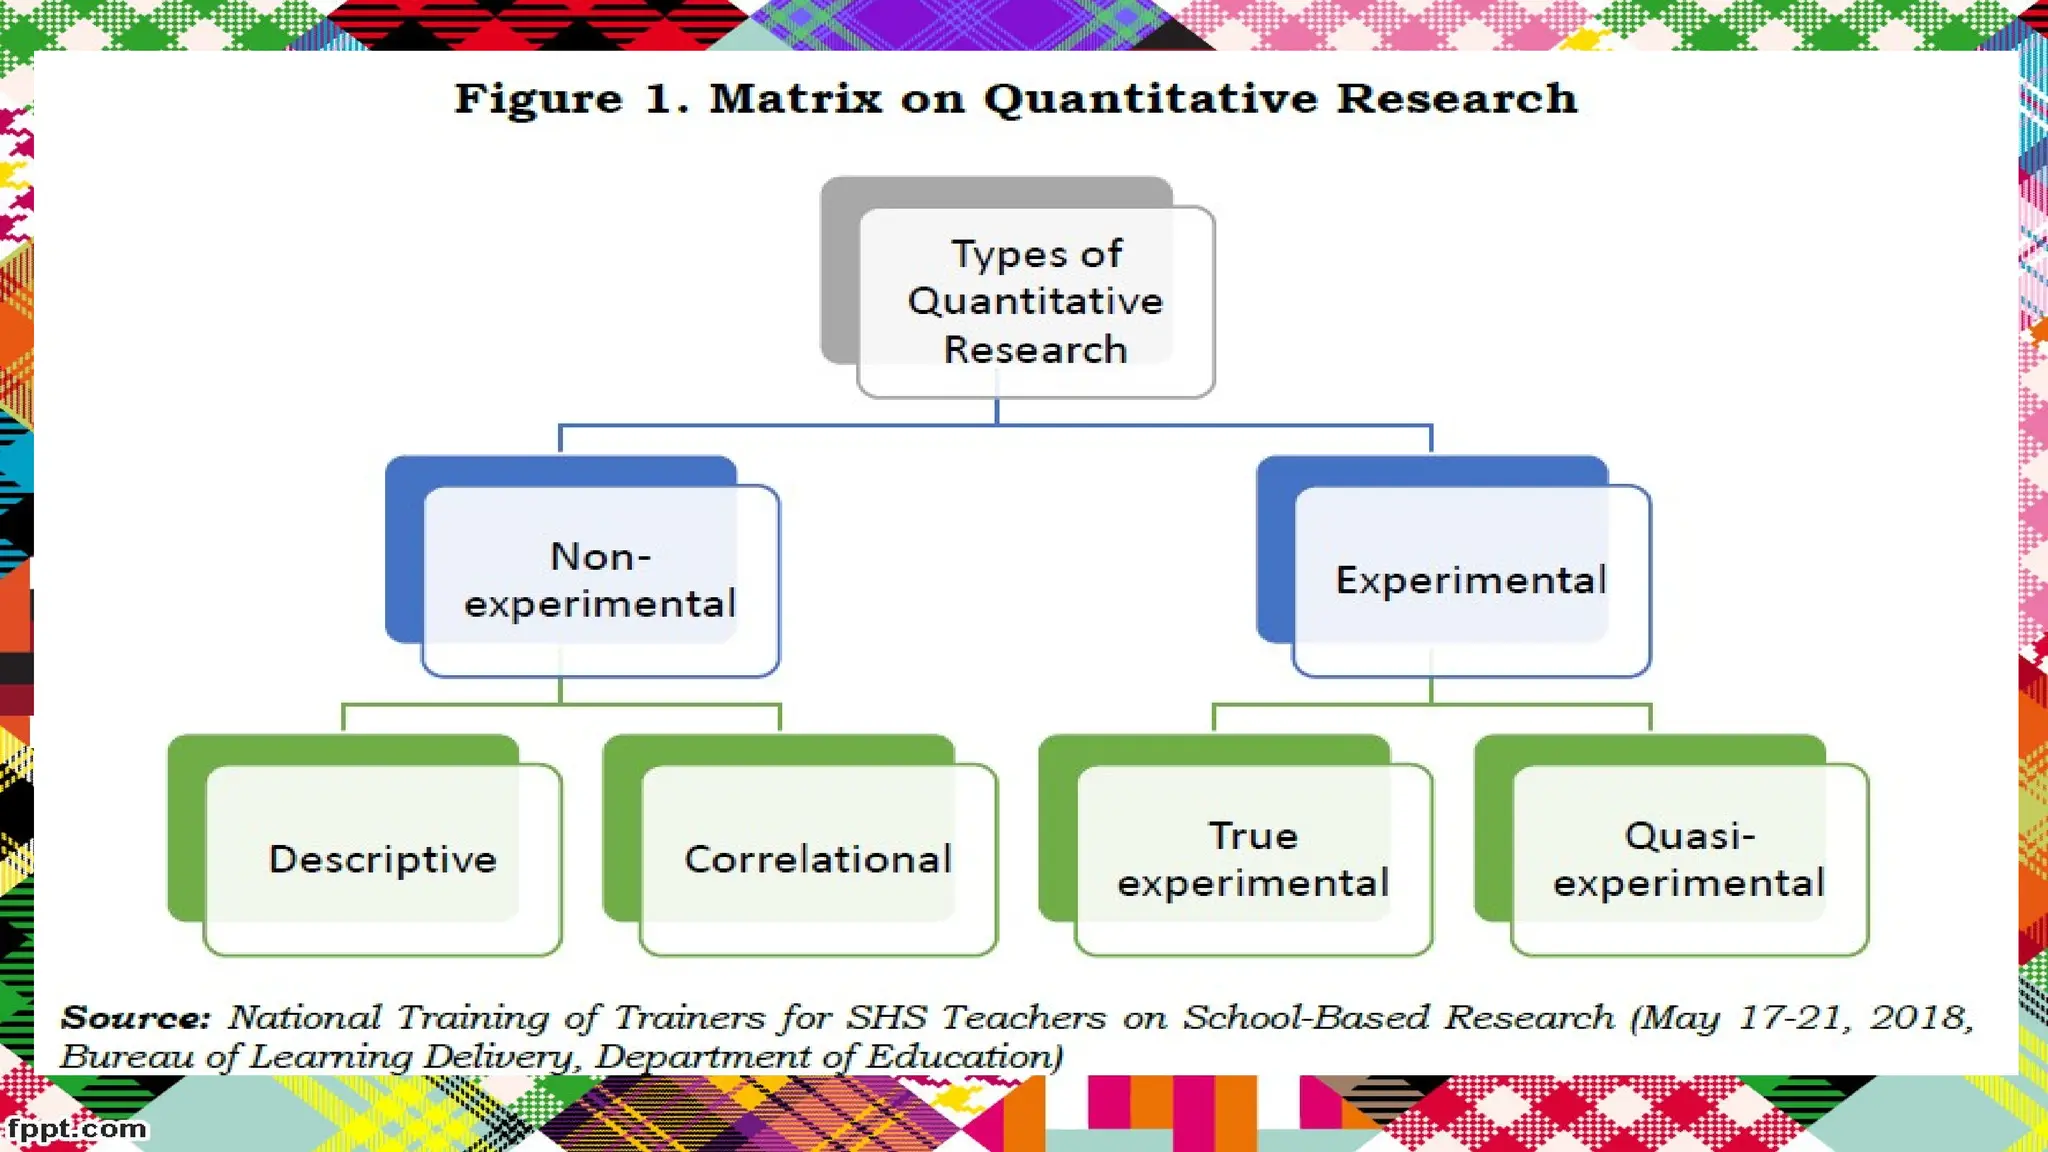
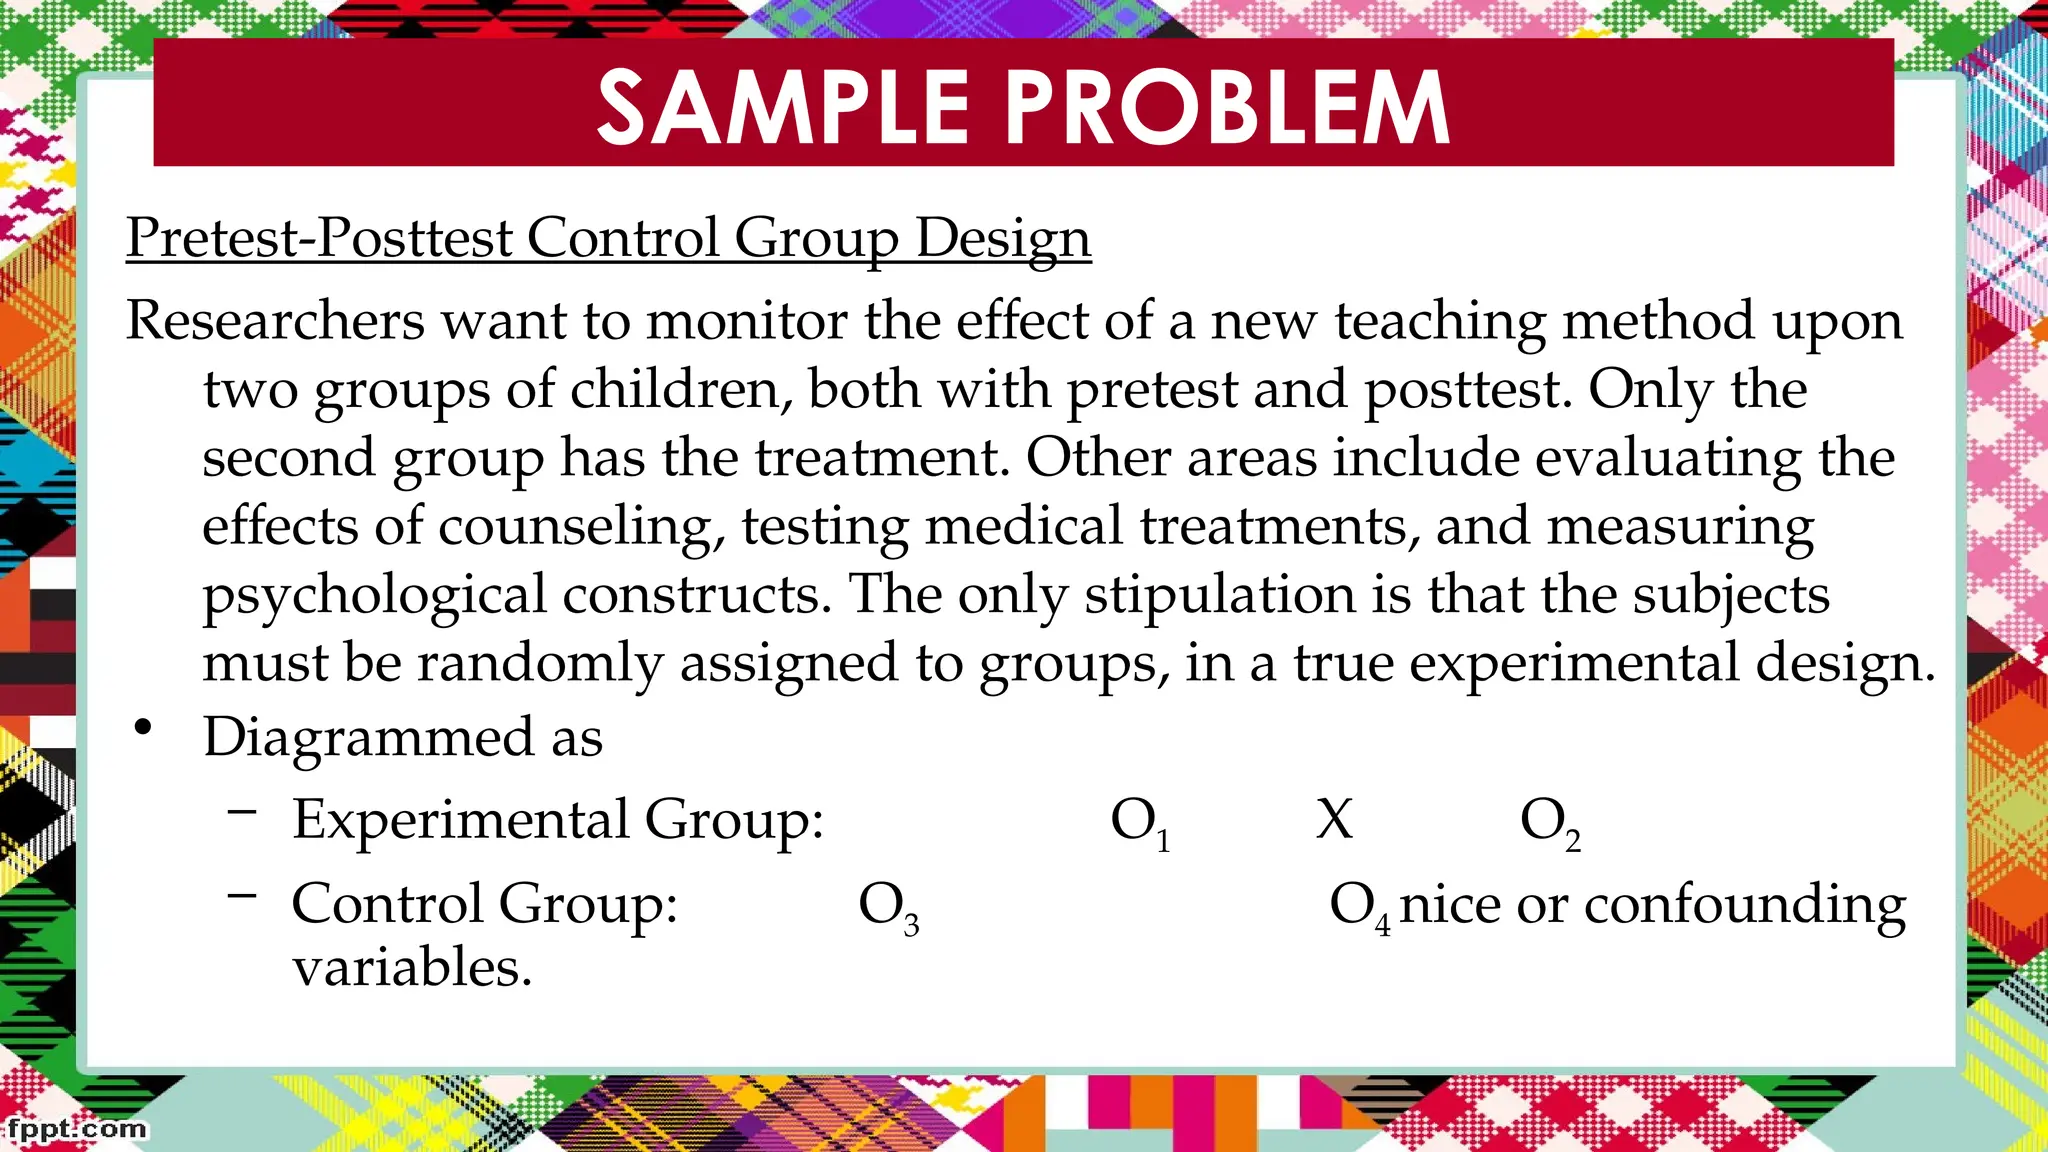
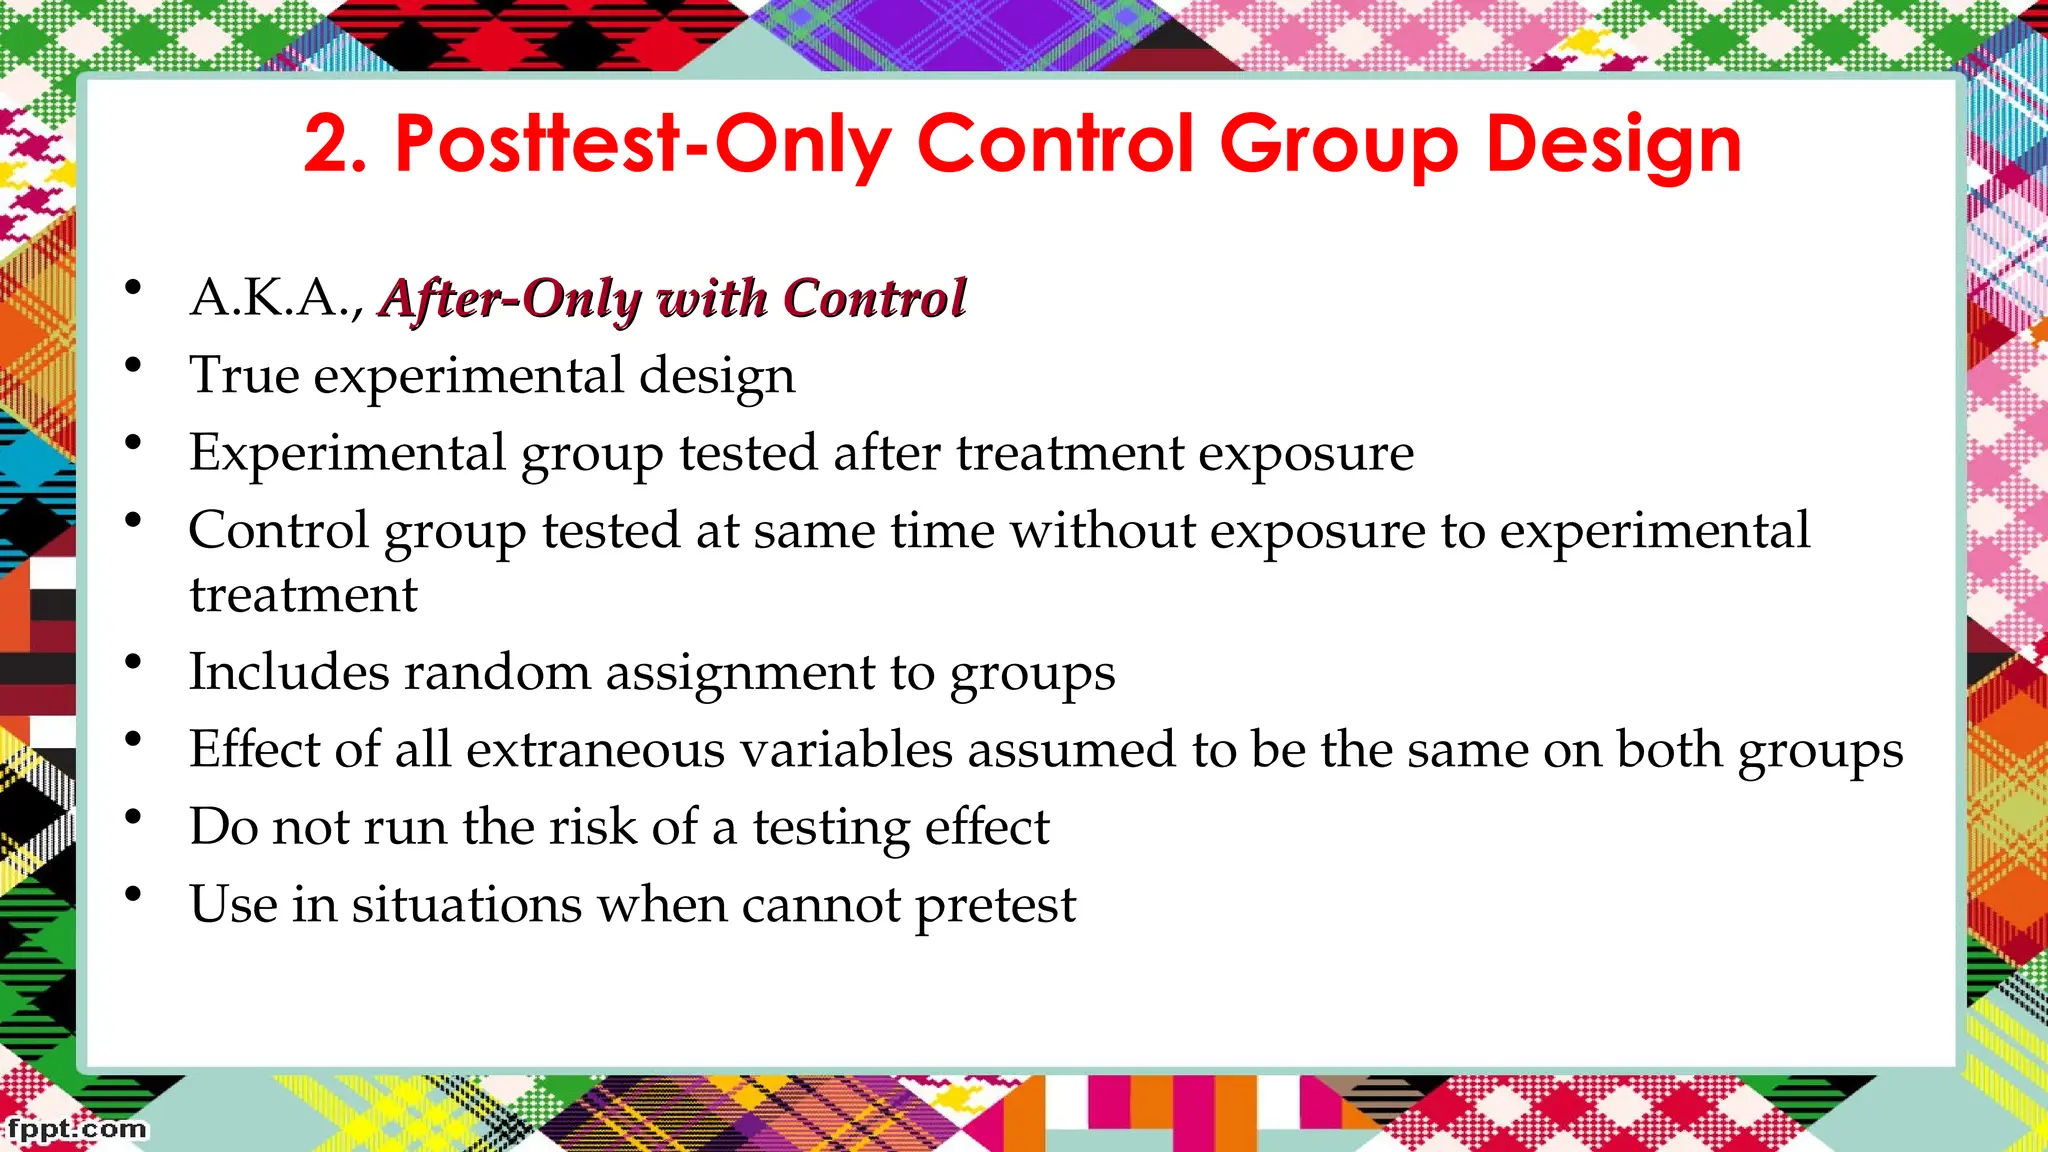
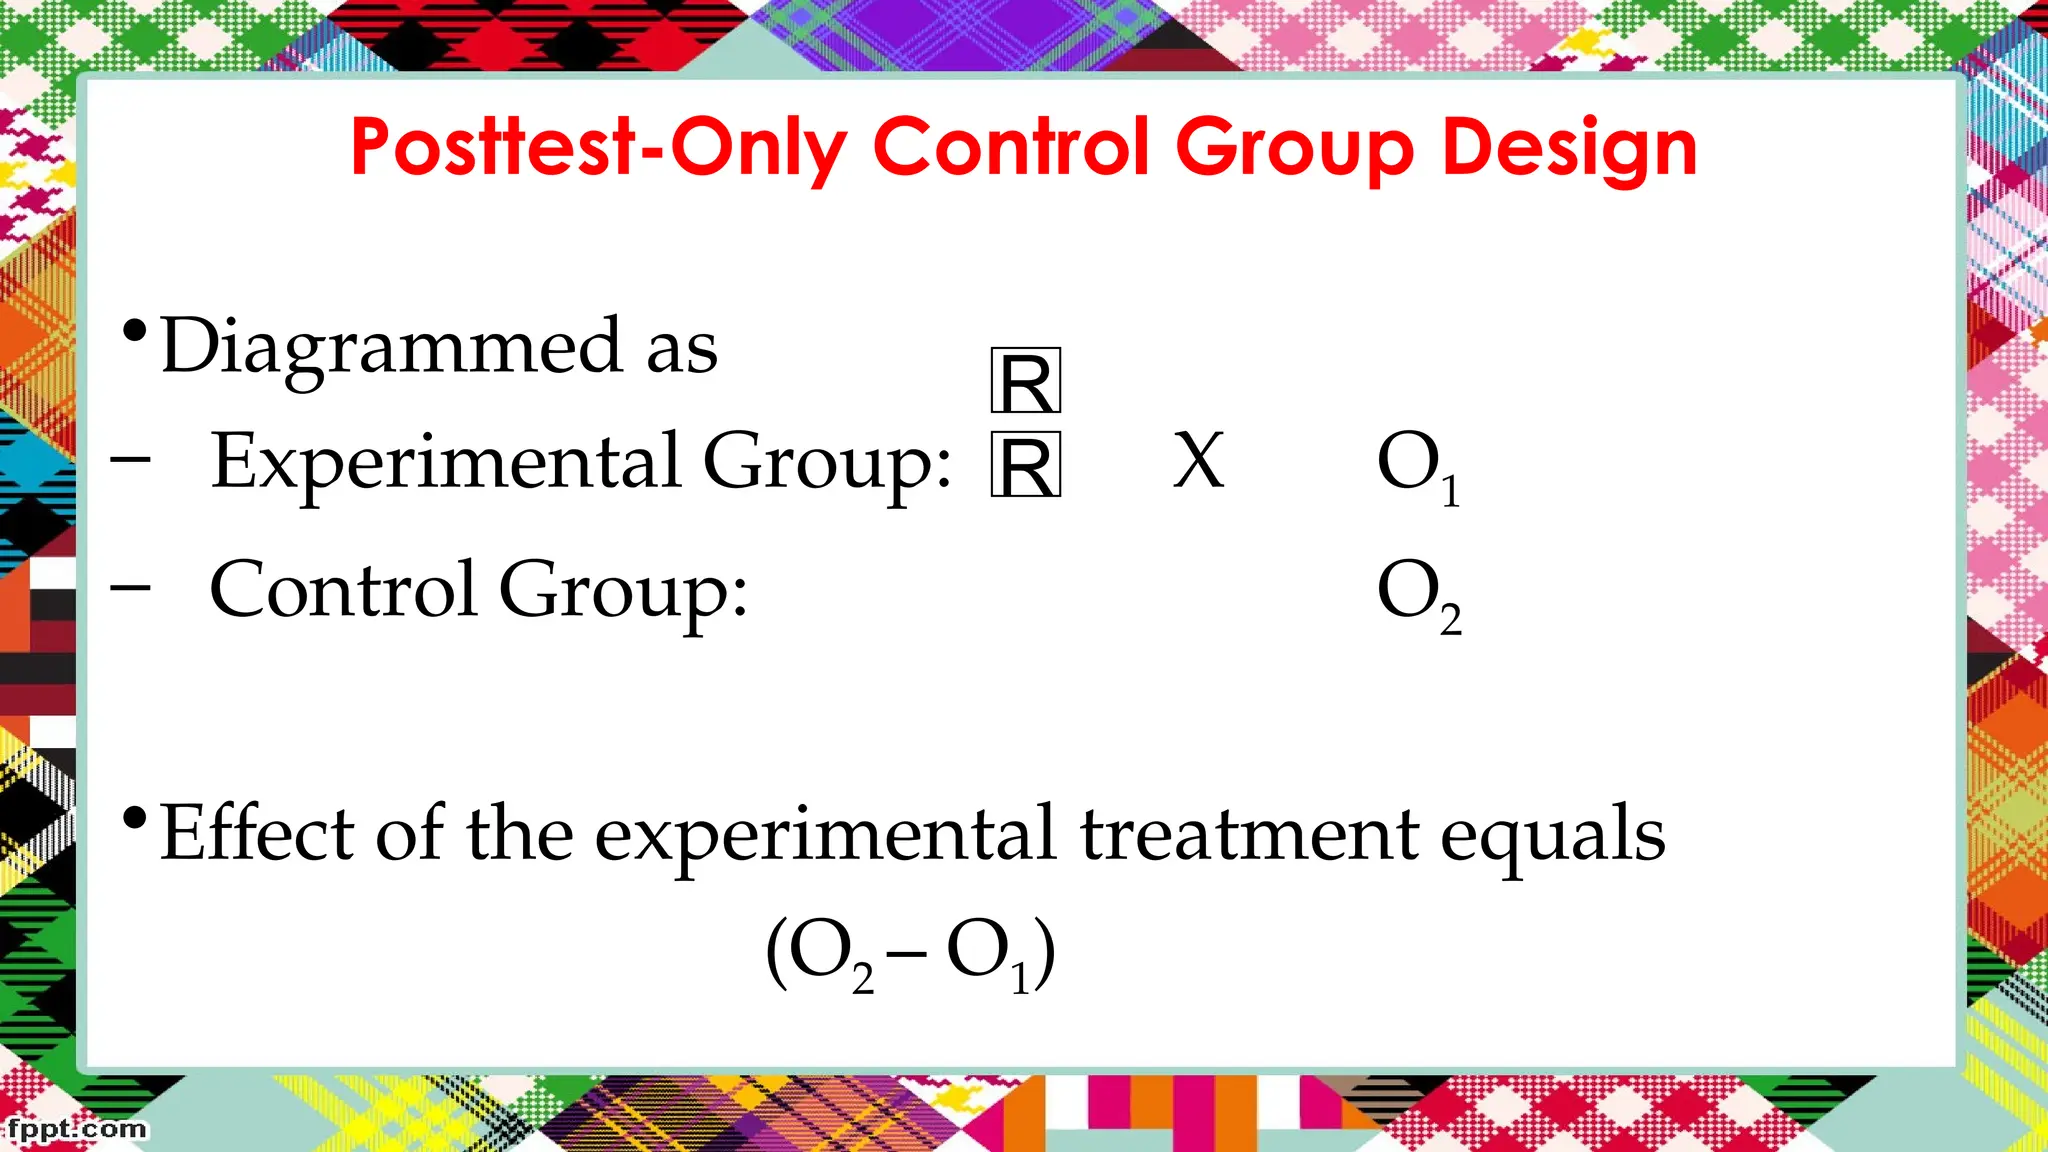
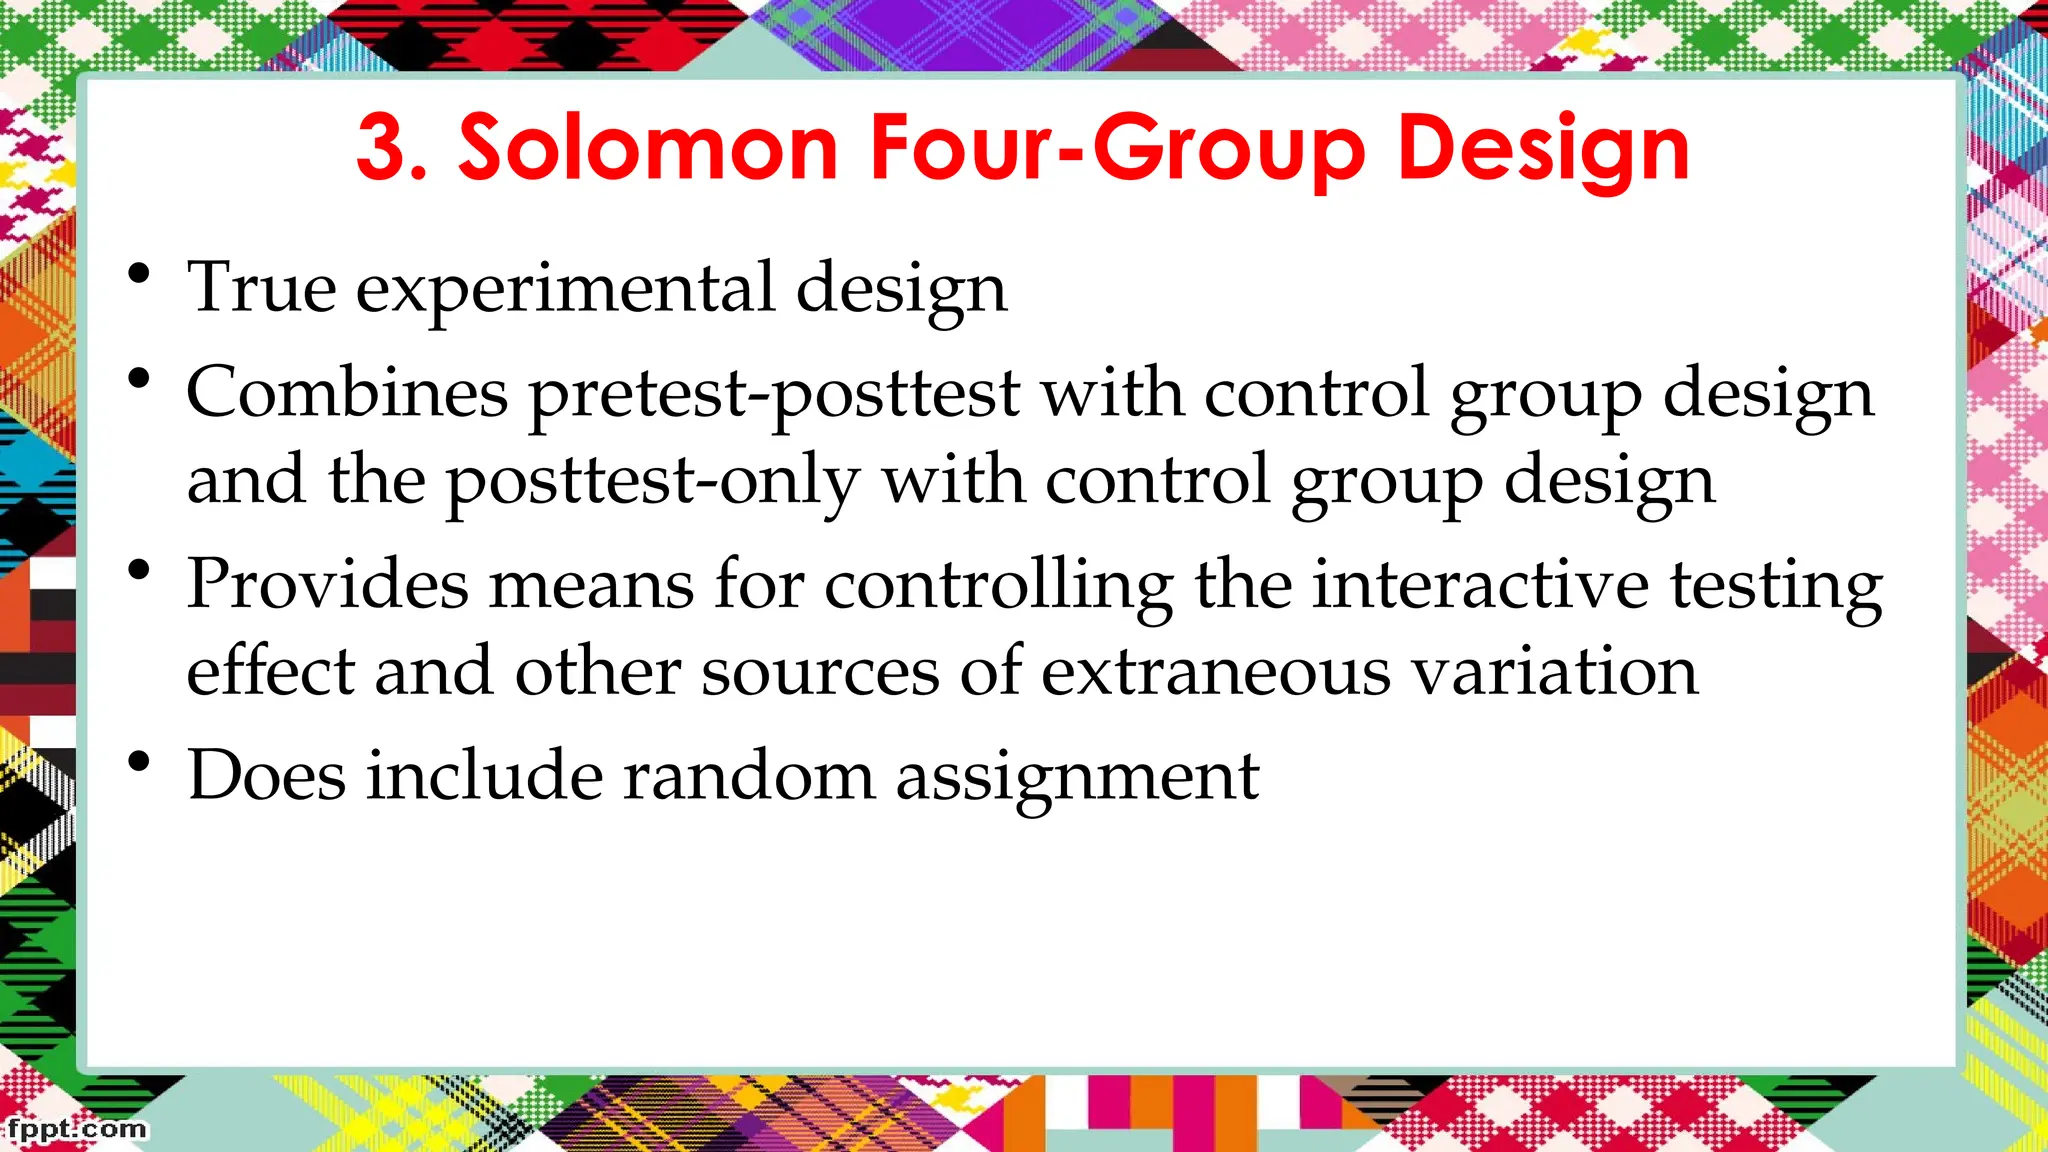
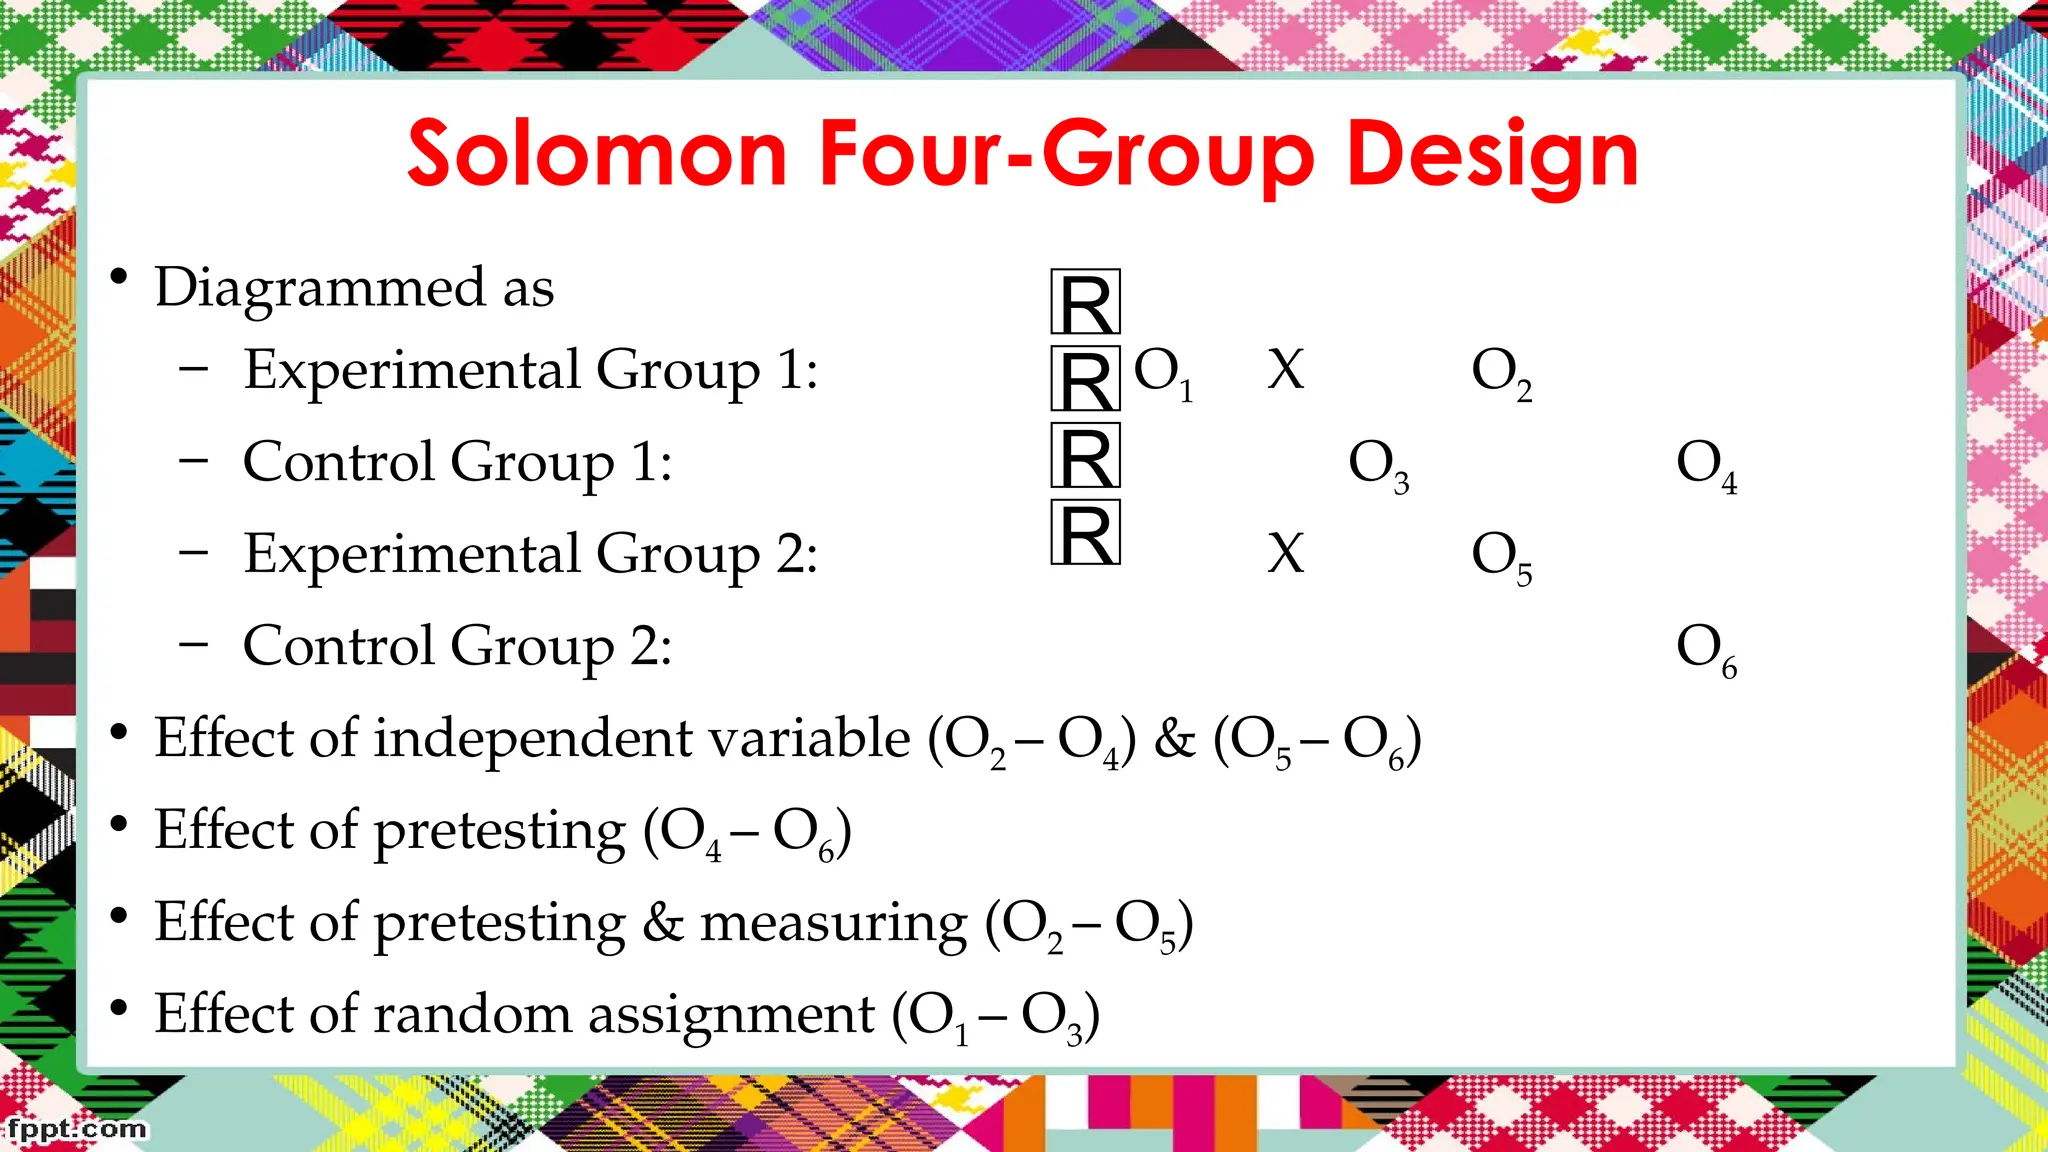
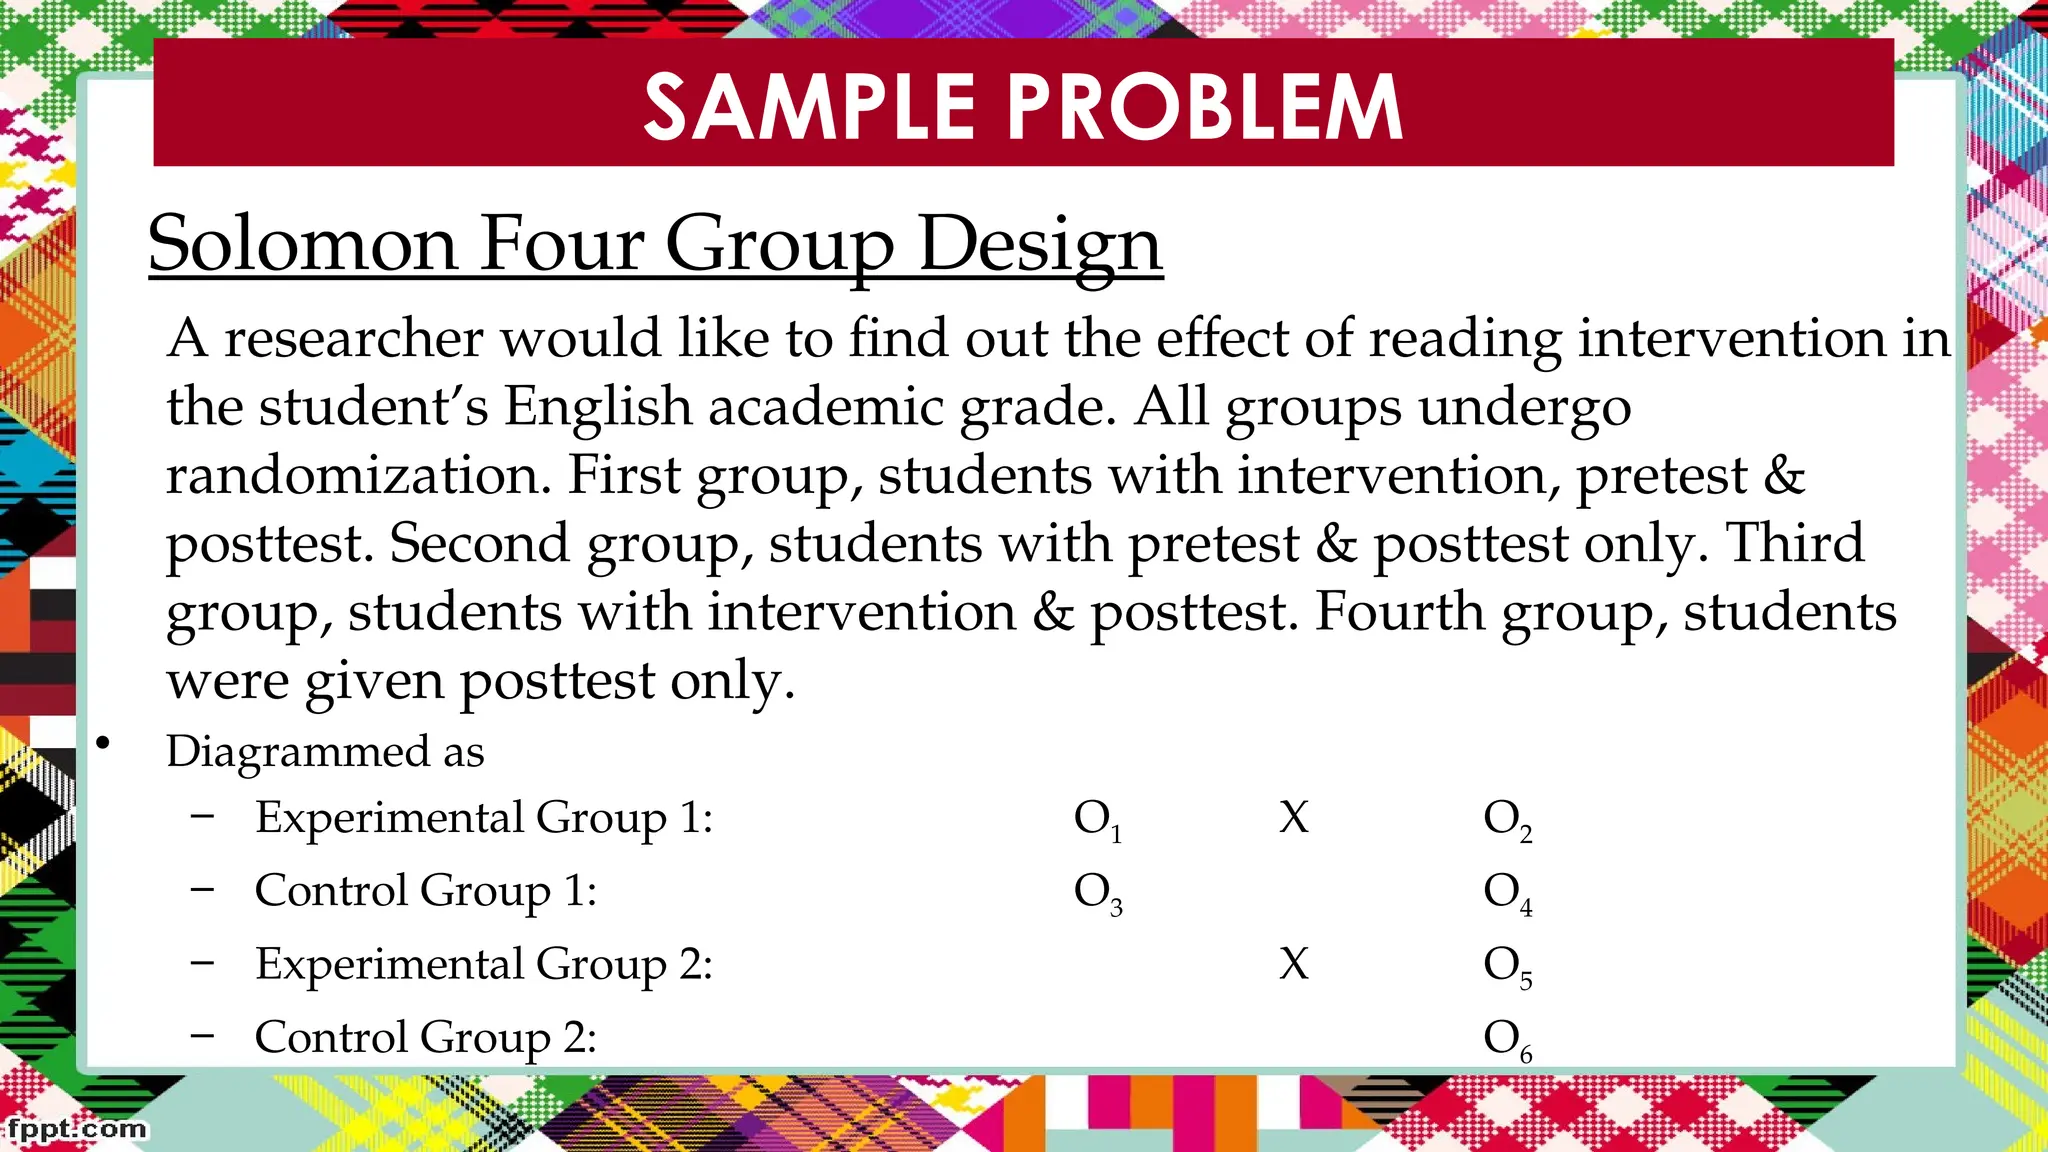
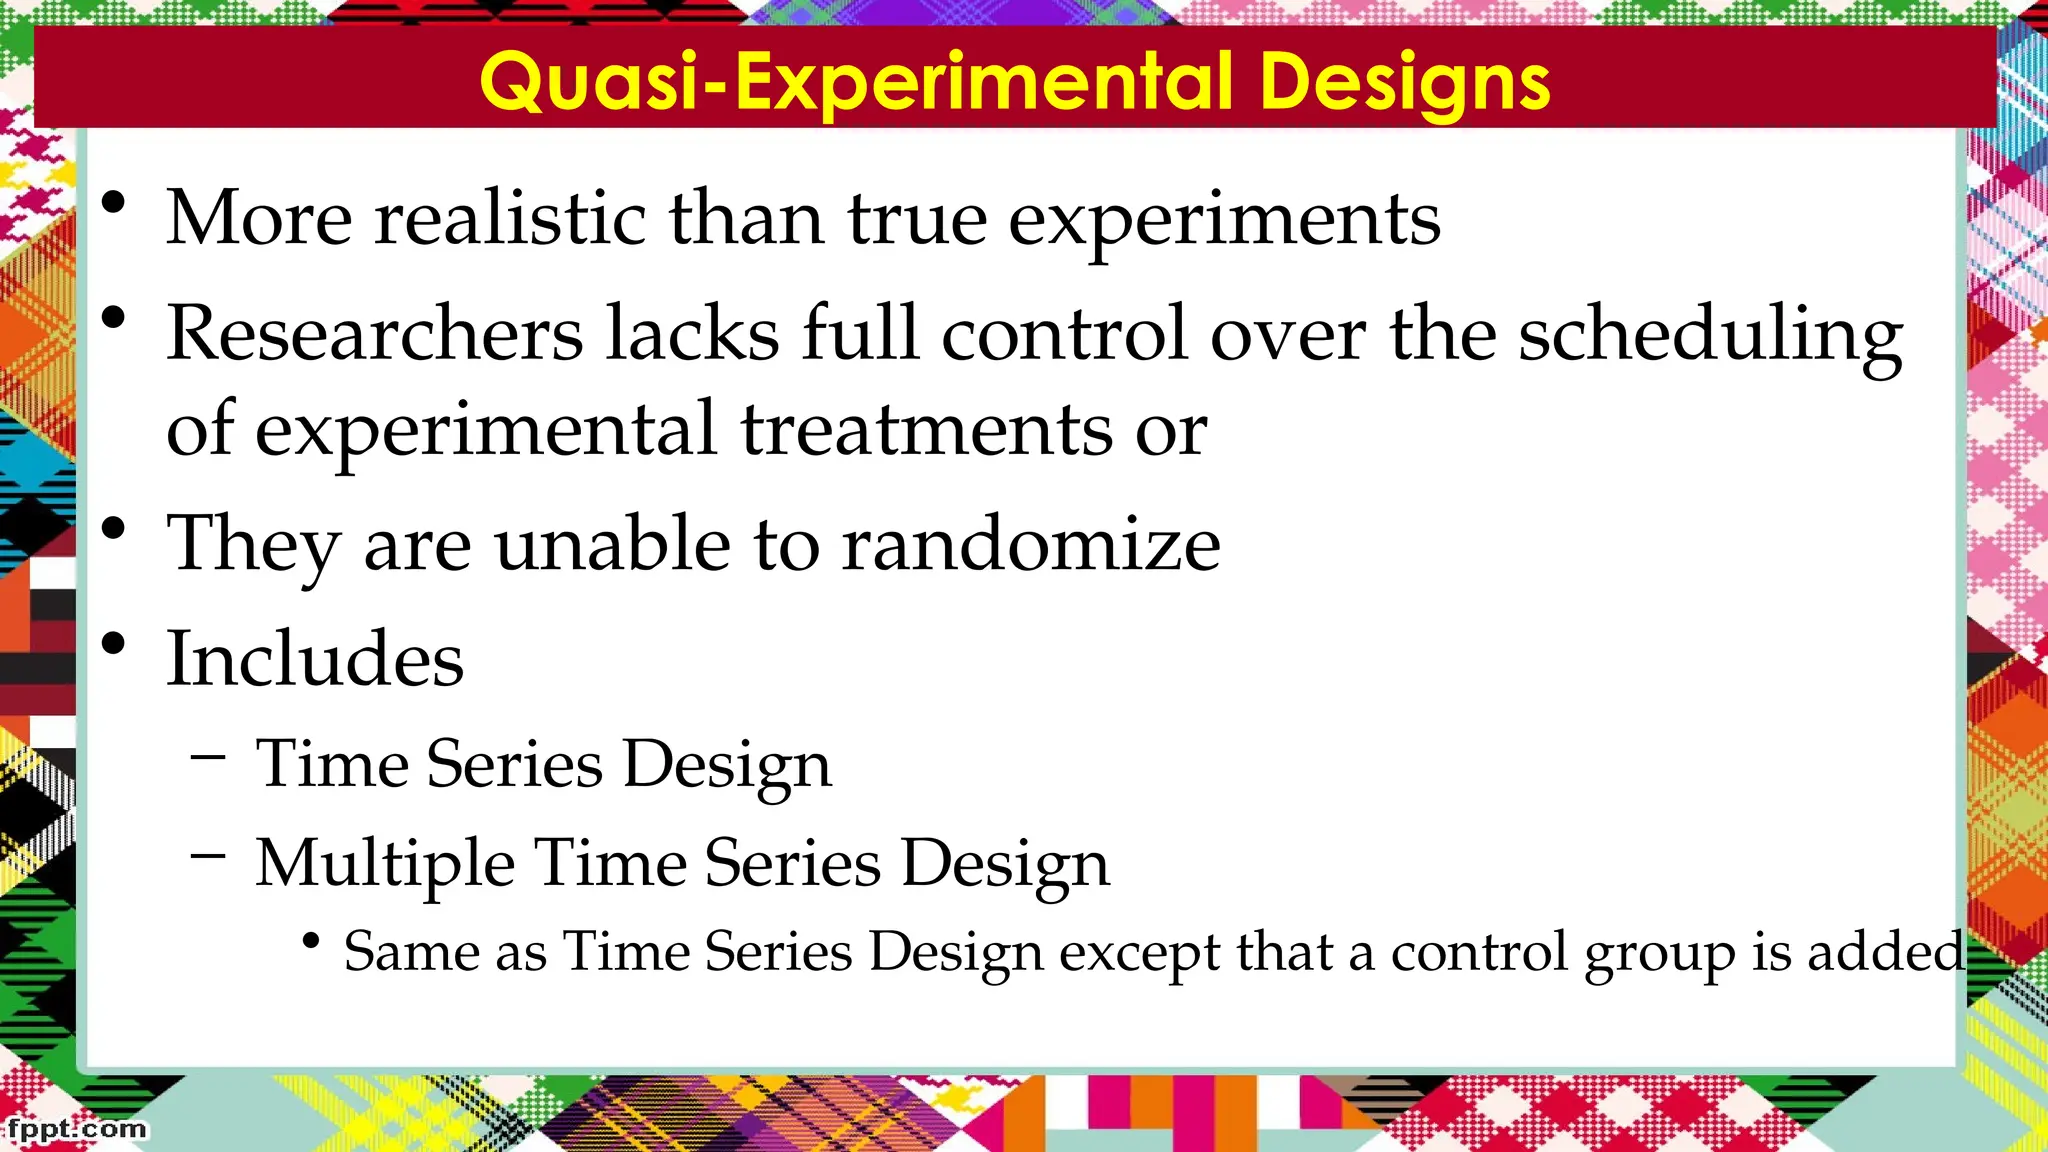
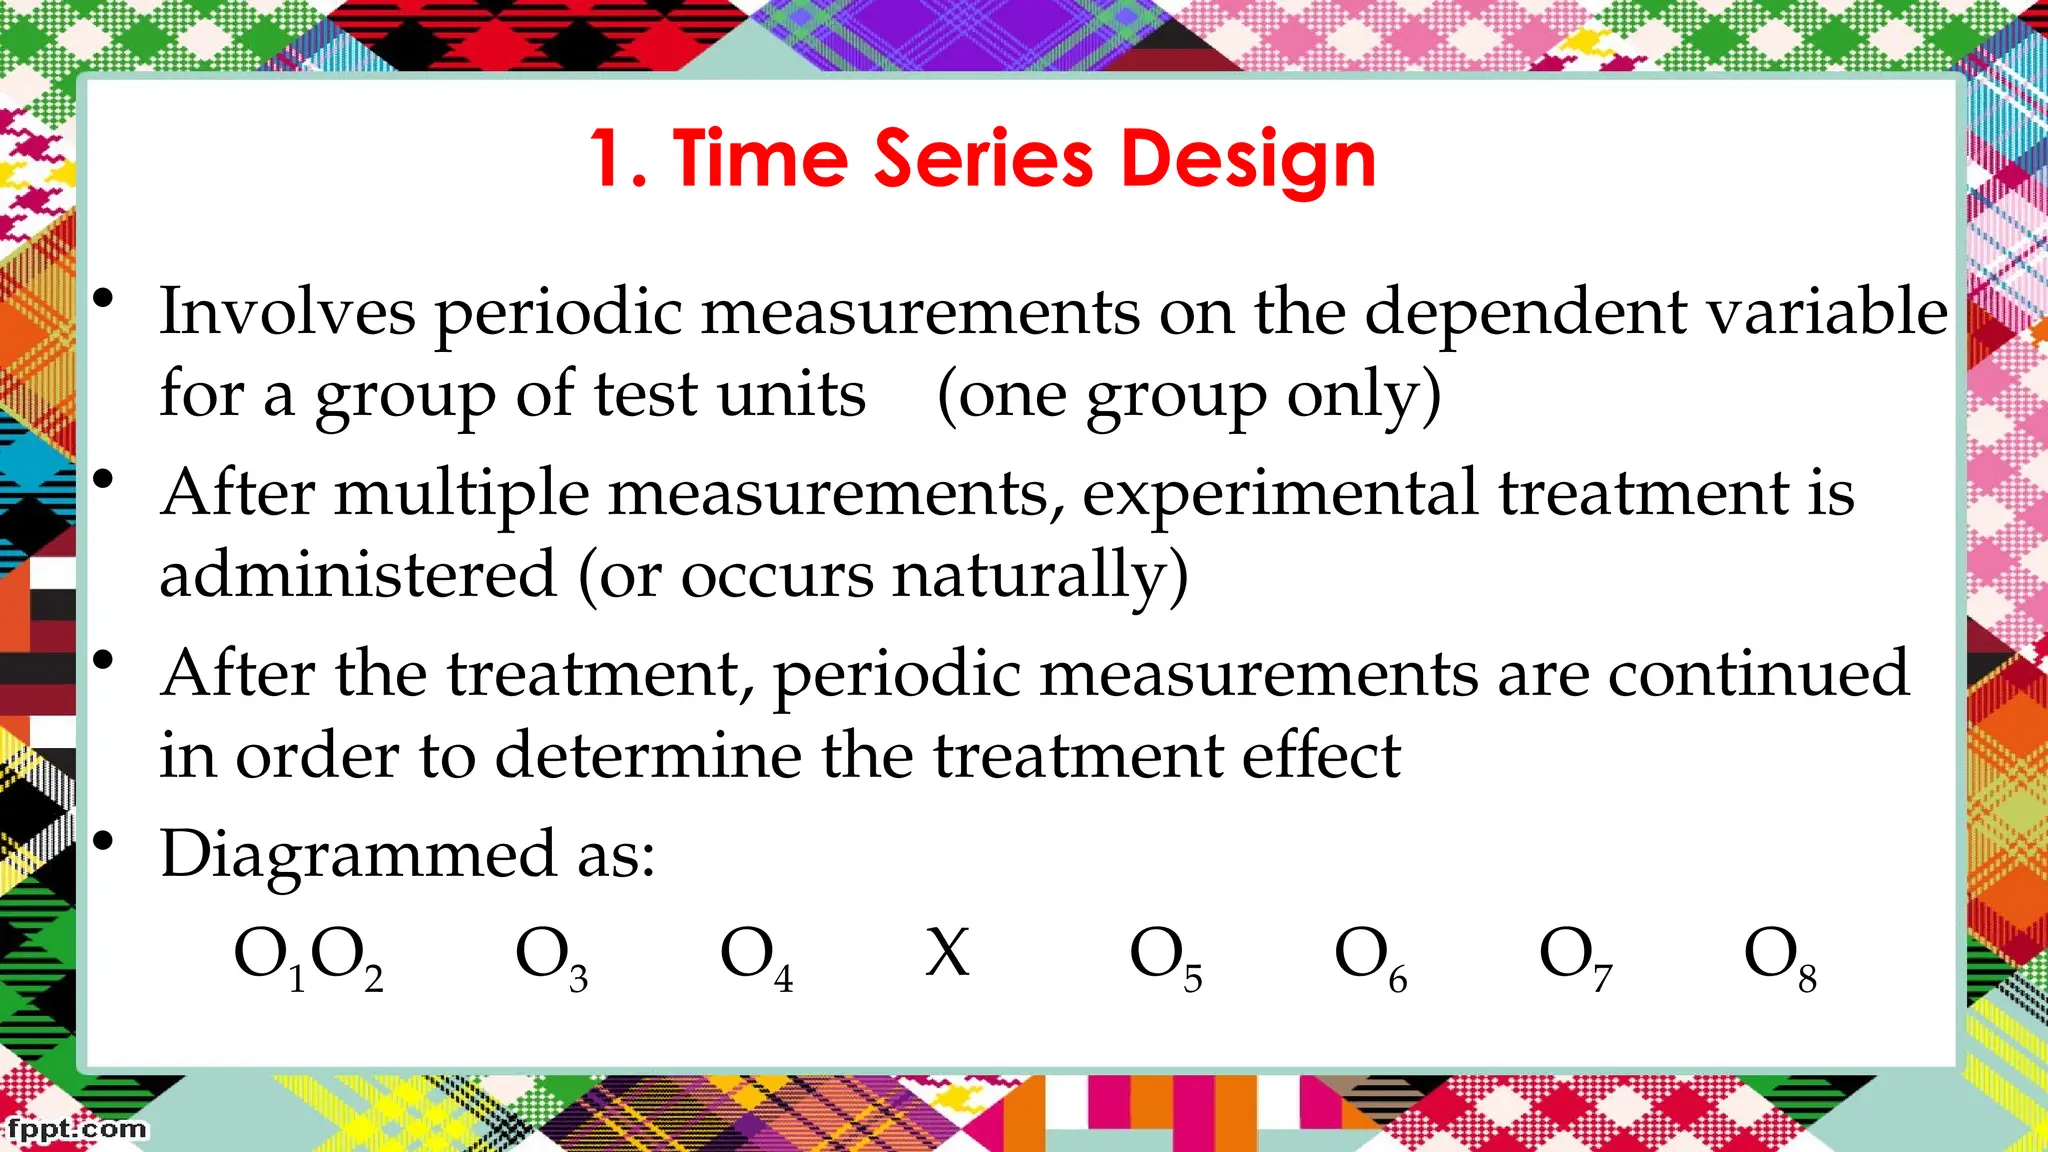
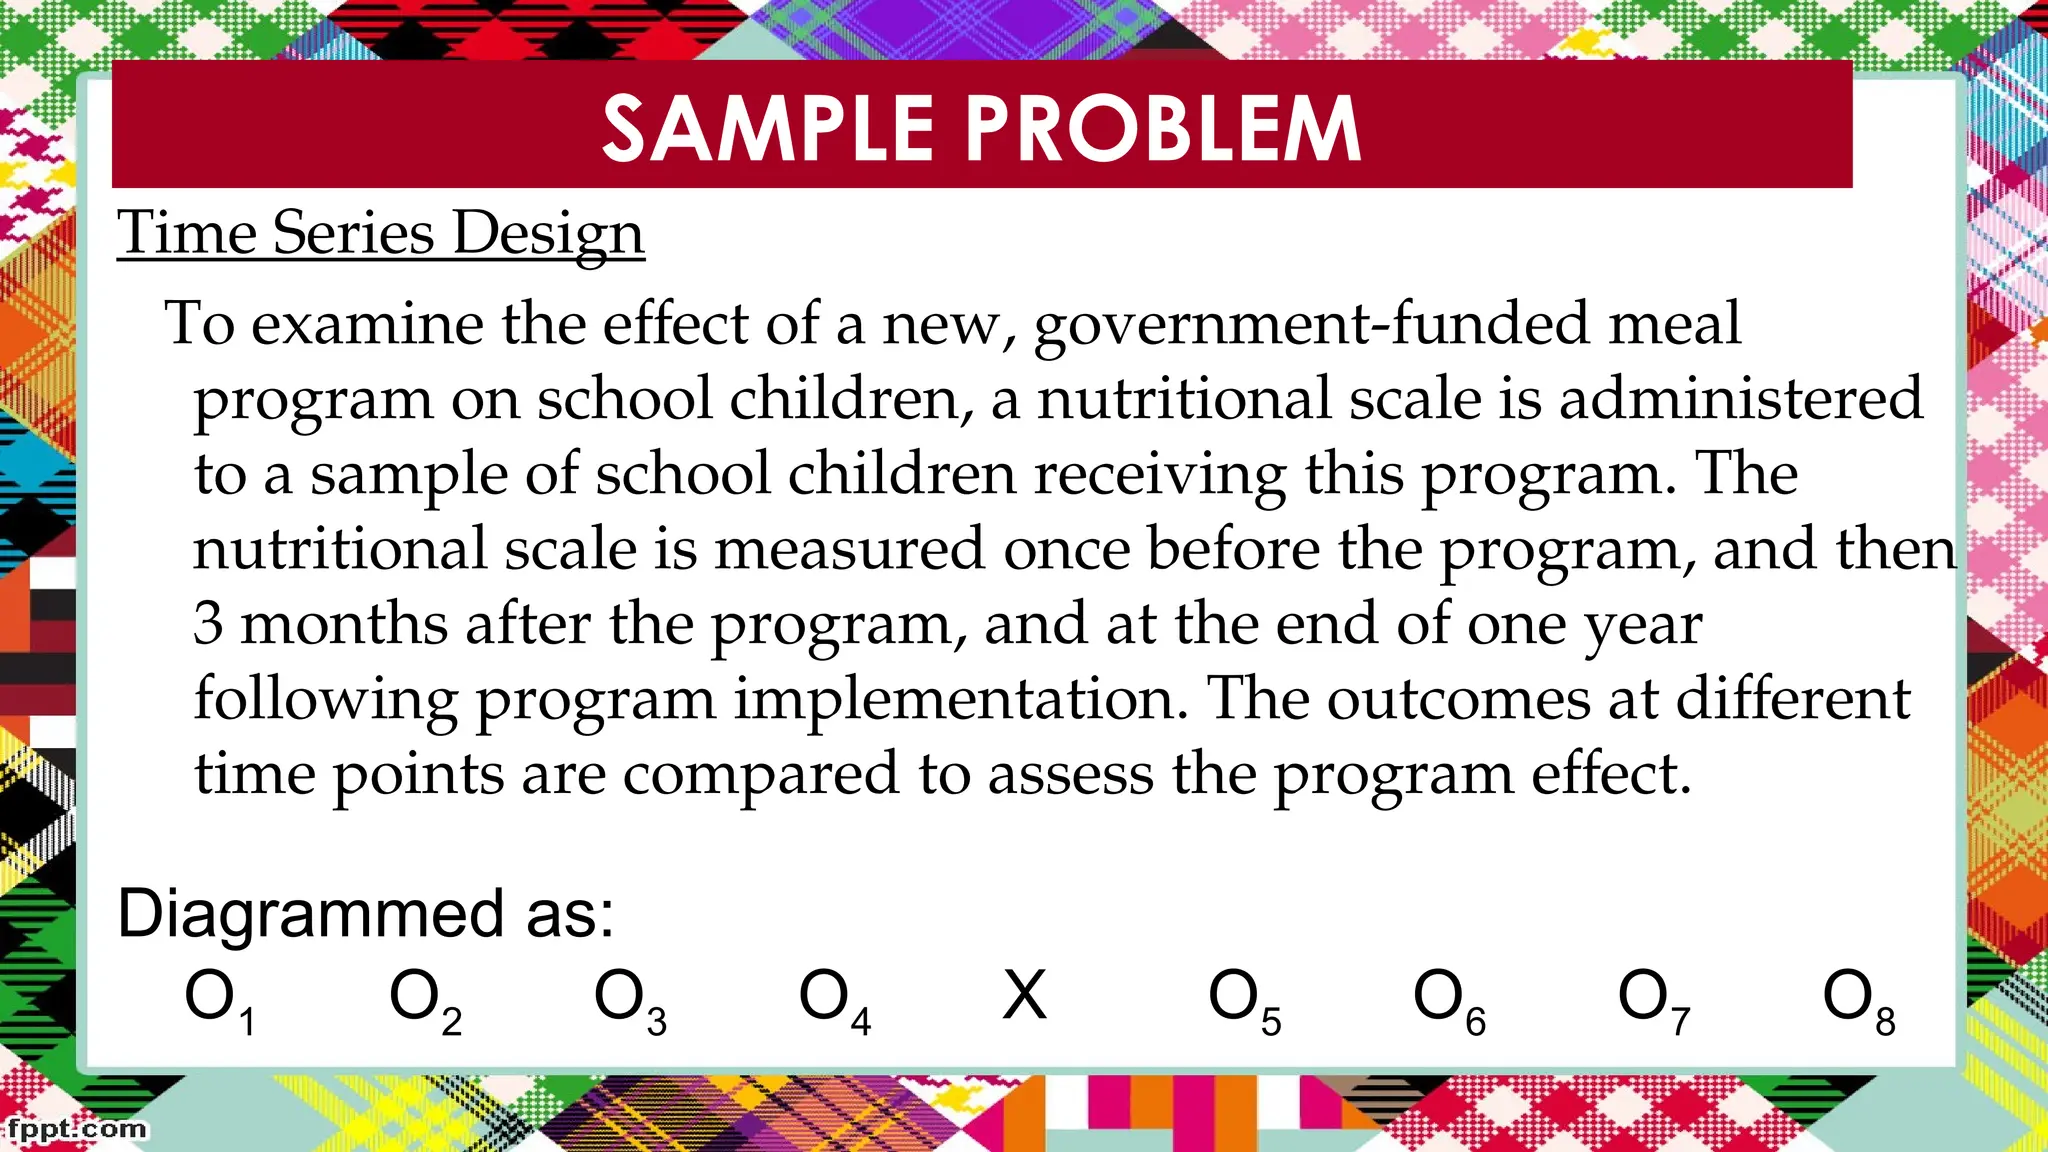
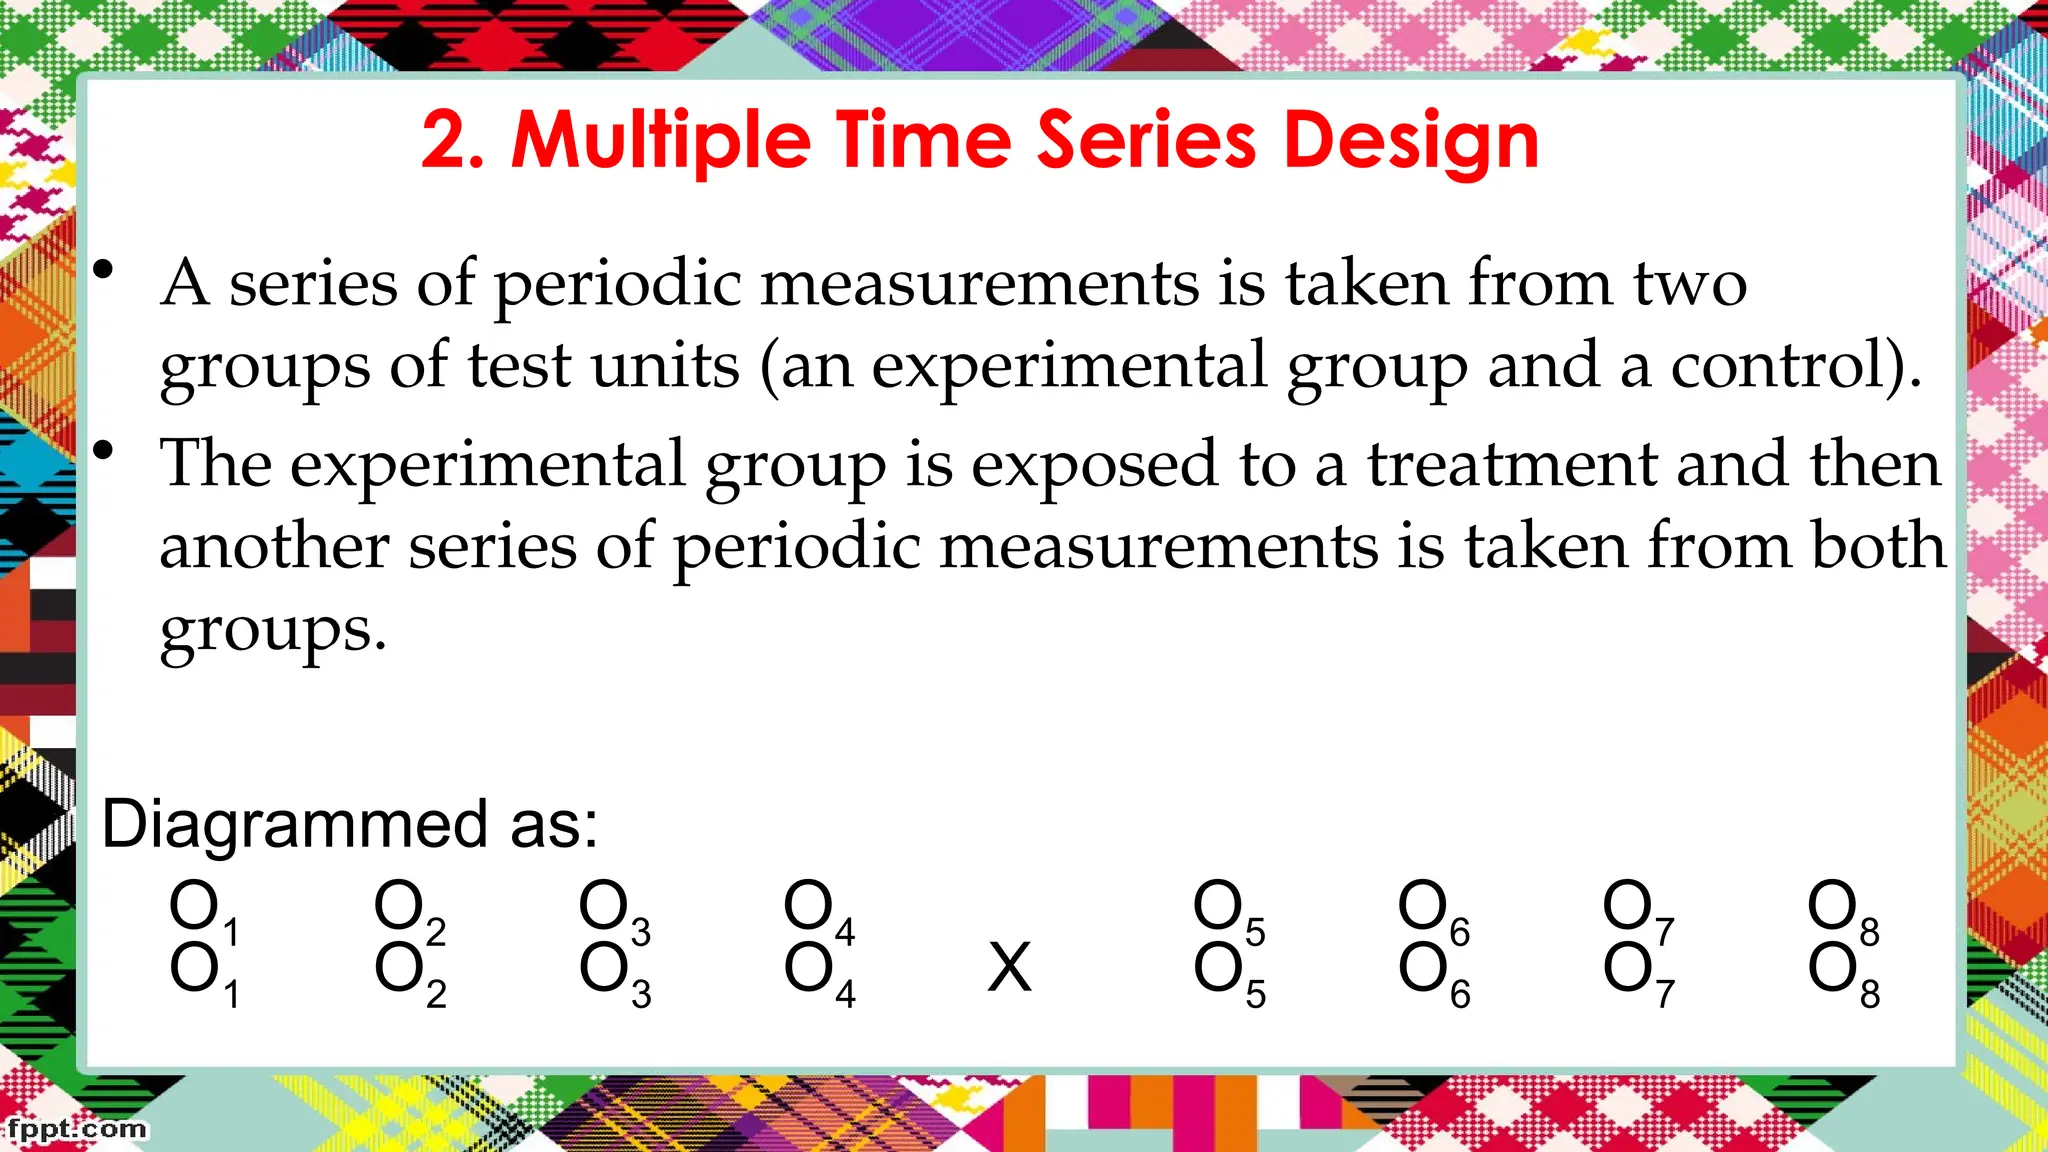
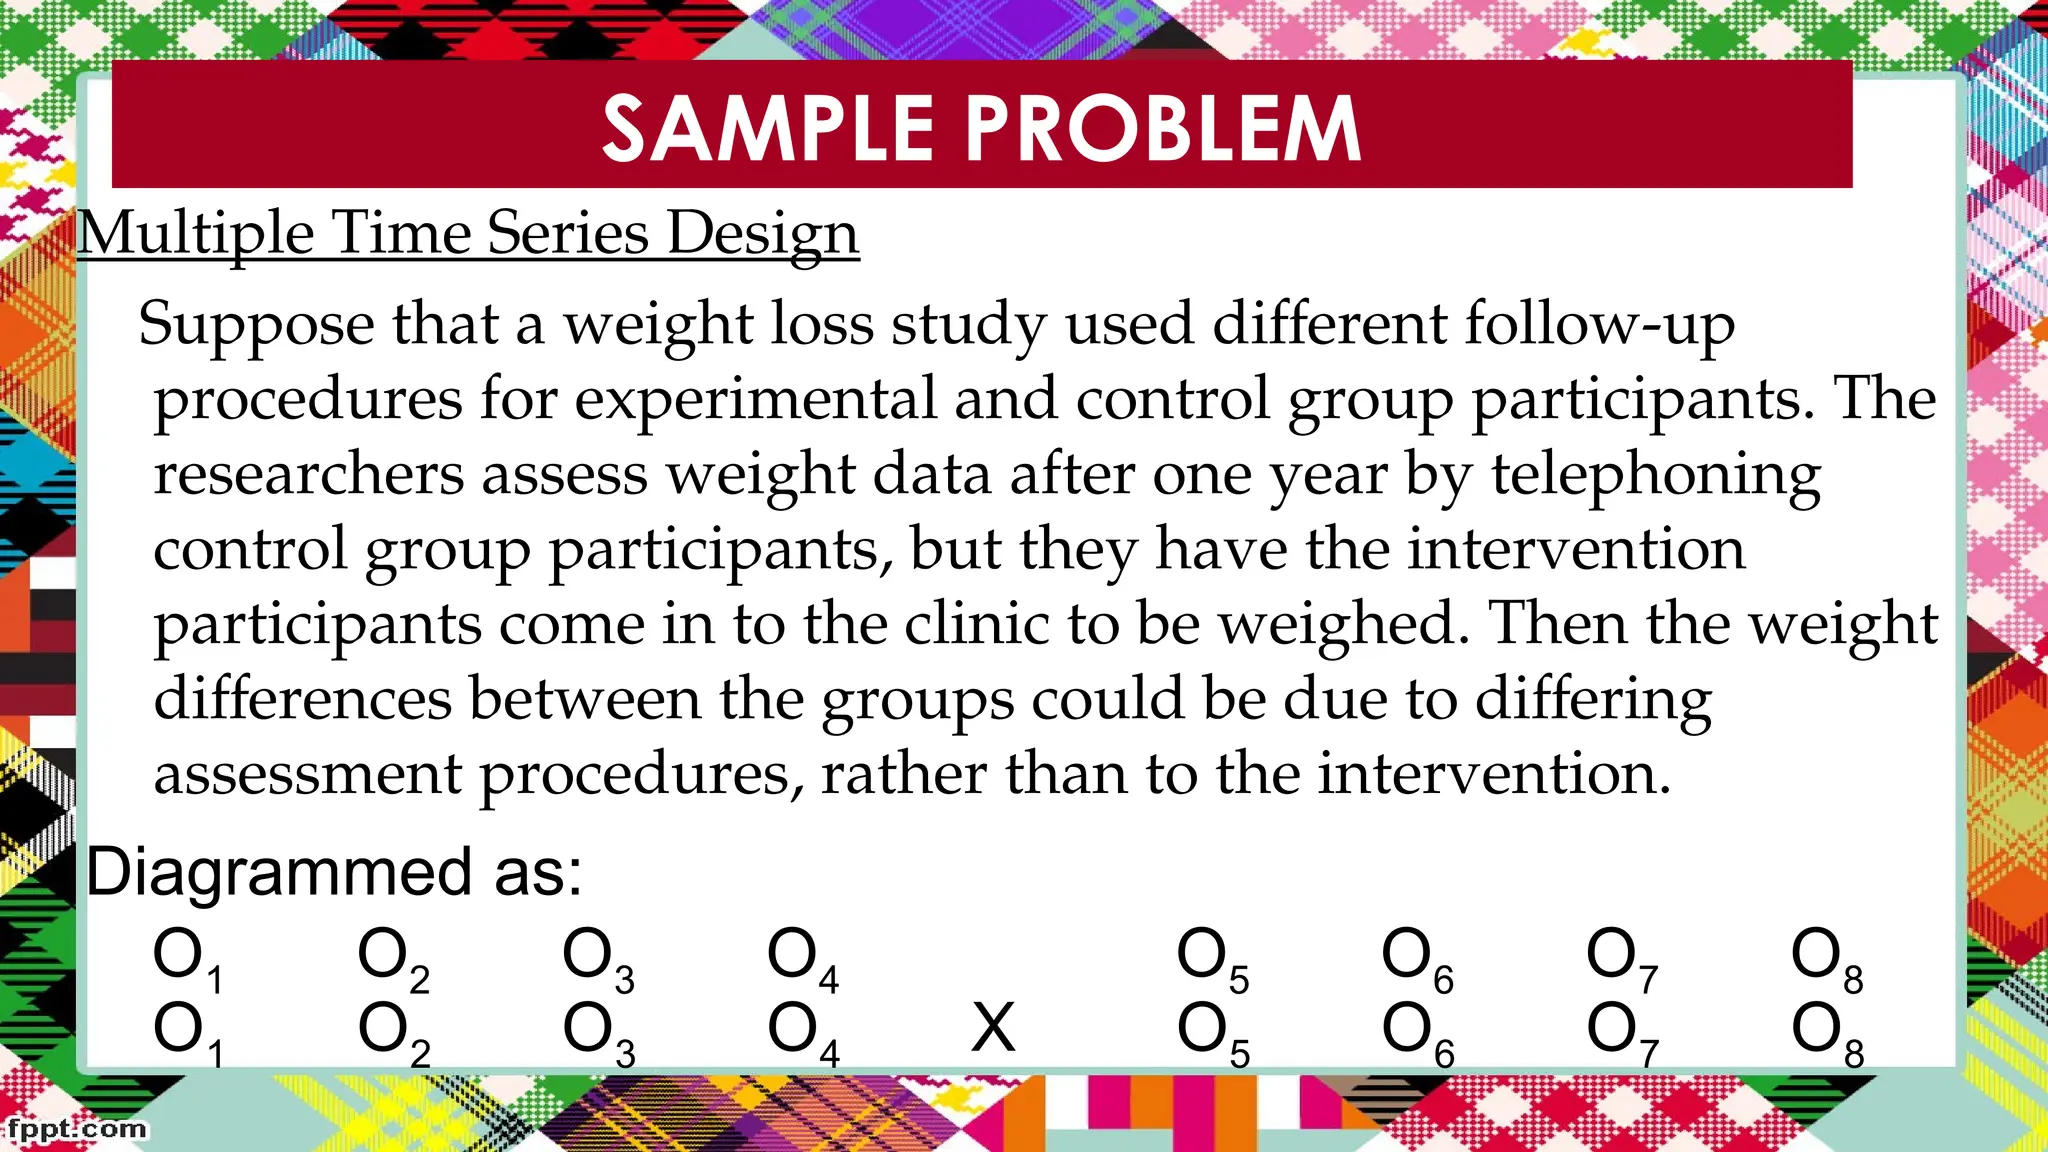
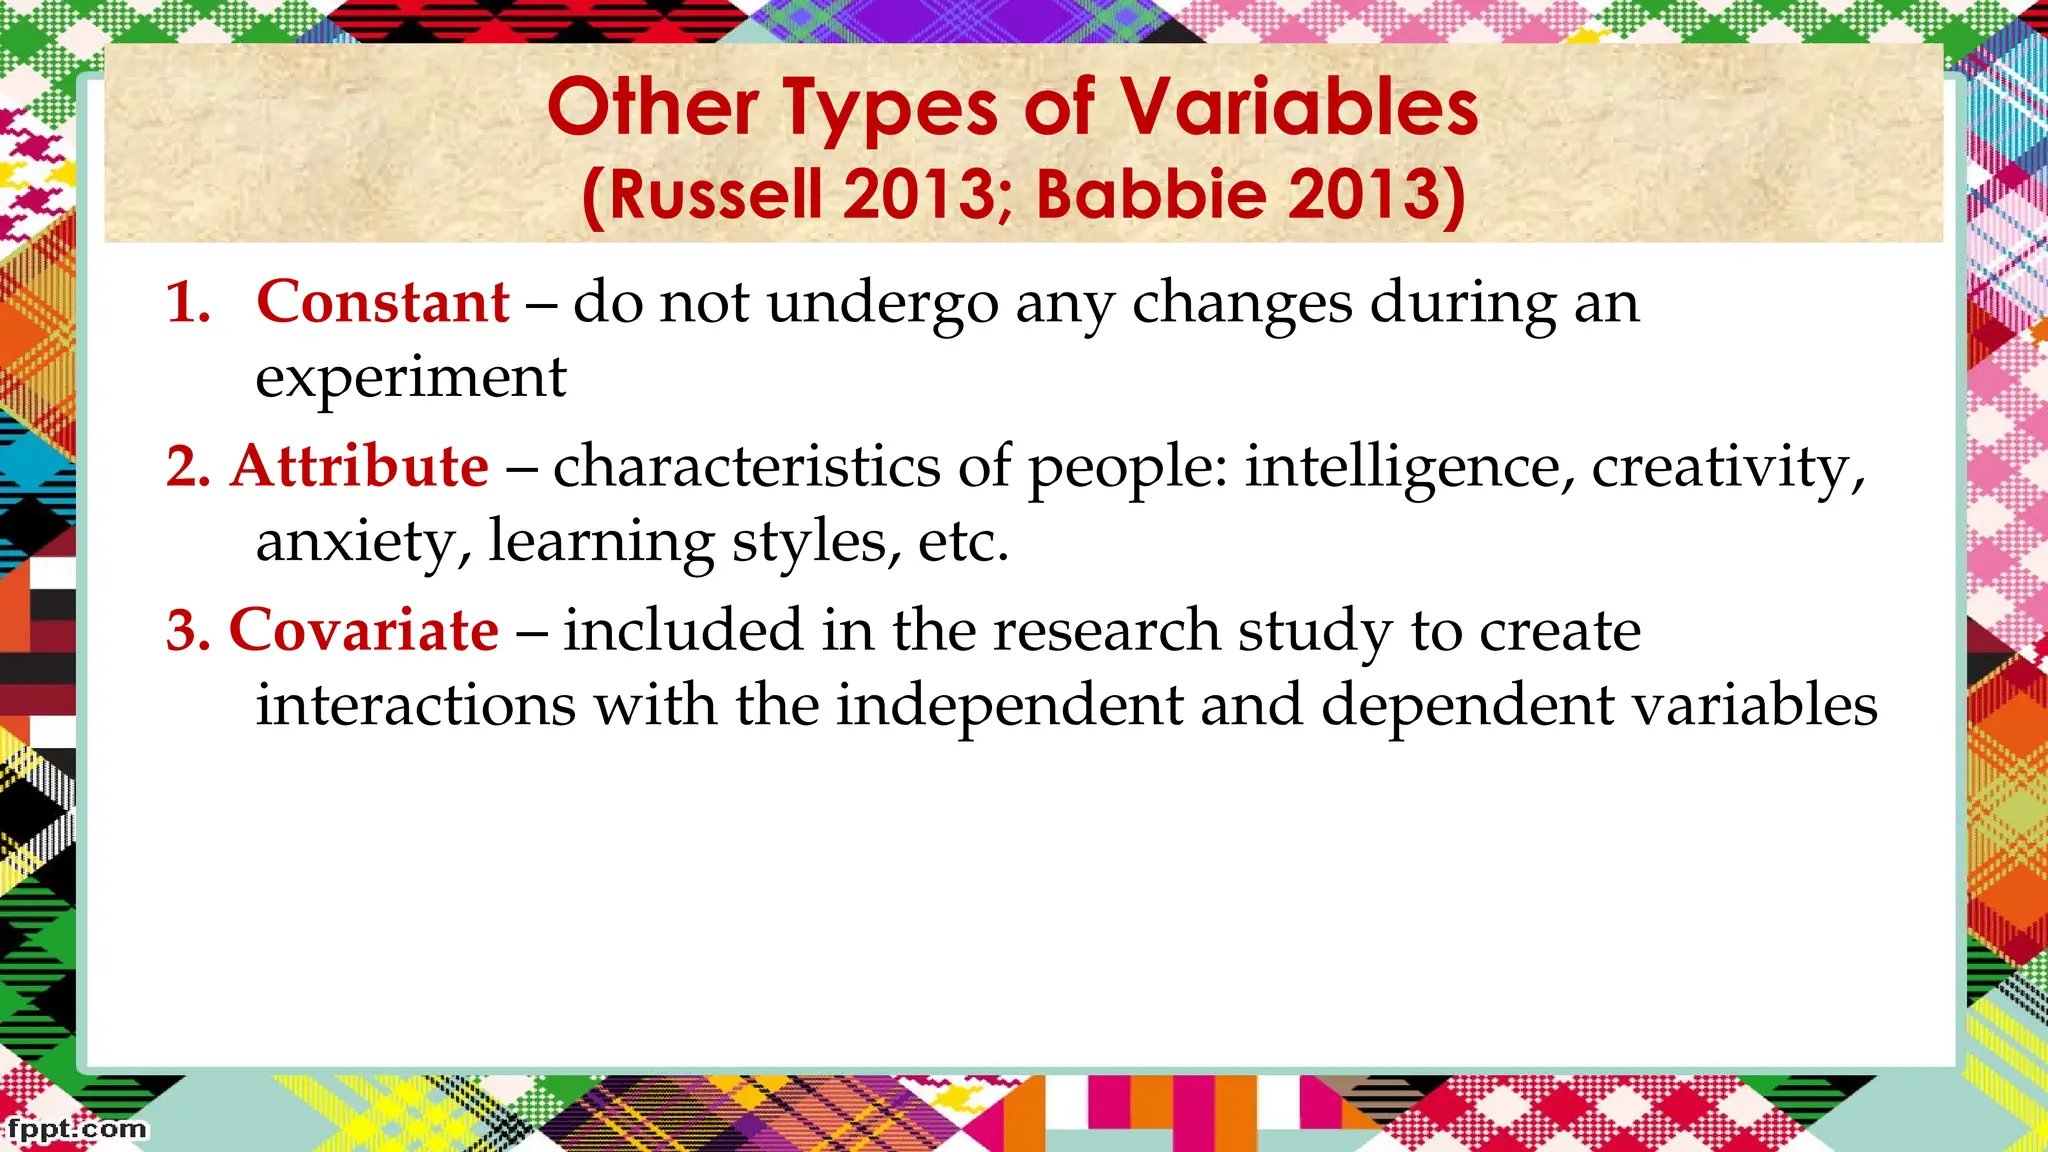
What is
Research?
The systematic search for
pertinent information on specific
topic of problem (Aquino, 1970).
Research is an attempt to gain solutions
to problems. More precisely, it is the
collection of data in rigorously
controlled situation for the purpose of
prediction or explanation
(Quinton, 2006).
(Quinton, 2006).
1. Objective
1. Objective
2. Clearly Defined Research Questions
3. Structured Research Instruments
4. Numerical Data
4. Numerical Data
5. Large Sample Size
6. Replication
6. Replication
7. Future Outcomes
7. Future Outcomes
8. Verifies Existing Facts
1.
1. It is objective.
It is objective.
2.
2. The use of statistical techniques facilitates
The use of statistical techniques facilitates sophisticated
sophisticated
analyses
analyses and allow you to comprehend a huge amount
and allow you to comprehend a huge amount
of vital characteristics of data.
3.
3. The numerical data can be
The numerical data can be analyzed in a quick and easy
analyzed in a quick and easy
way
way. By employing statistically valid random models,
. By employing statistically valid random models,
findings can be
findings can be generalized
generalized to the population about
to the population about
which information is necessary.
4. Quantitative studies are replicable.
Standardized approaches allow the study to be
replicated in different areas or over time with the
formulation of comparative findings.
1.
1. It requires a large number of respondents.
It requires a large number of respondents.
2.
2. It is costly.
It is costly.
3.
3. The information contextual factors to help interpret the
The information contextual factors to help interpret the
results or to explain variations are usually ignored.
4.
4. Many information are difficult to gather.
Many information are difficult to gather.
5.
5. Data from questionnaires may be incomplete and
Data from questionnaires may be incomplete and
inaccurate.
inaccurate.
6.
6. Respondents’ answer may be unreliable.
Respondents’ answer may be unreliable.
7.
7. Instruments preparation may take time
Instruments preparation may take time
• It is incapable of establishing cause-effect relationships;
by itself, it is able, if it takes place in conjunction with
other experimental and quasi-experimental research
methods.
• It uses research method that is applicable to both
quantitative and qualitative data.
• It collects data through survey, observation, historical
studies, case studies, documentary analysis, and so on.
(Suter, 2012; Sarantakos, 2013)
How many hours senior high school students spend in social
media
The number of malnourished students who failed in the
achievement test
How healthy is the food served during recess in the public school
• Describing the nature, characteristics and components of
the population or a phenomenon
• NO manipulation of variables or search for cause and
effect related to the phenomenon.
• This design attempts to find general attributes of the
presently existing situation and determine the frequency
with which it occurs.
If pre-board examination results can be used to predict performance
in LET
Are sex and mathematical ability related?
Marriage and cancer recovery
• It is systematic investigation of the nature of
relationships, or associations between and among
variables without necessarily investigating into casual
reasons underlying them.
• It is concerned with he extent of relationship that exists
between or among the variables.
If Assessing the implementation of nursing care in a hospital
Determining the impact of a new treatment procedure for patients
• It aims to assess the effects, impacts or
outcomes of practices, policies, or programs.
• used to gather information from groups of people by
selecting and studying samples from a population.
• Cross-sectional if the information is collected from a
sample in just a single point in time (Child-rearing
practices of single parents)
• Longitudinal if the research collects information on
the same subjects over a period of time (TO
determine the growth of rice field in the country; rate
of promotion of doctorate degree holders five years
after earning a degree)
EXPERIMENTAL RESEARCH
Experiment
CONTROL
GROUP
EXPERIMENTAL
GROUP
What is an Experiment?
• Research method in which
– conditions are controlled
– so that 1 or more independent variables
independent variables
– can be manipulated to test a hypothesis
– about a dependent variable
dependent variable.
• Allows
– evaluation of causal relationships among variables
– while all other variables are eliminated or controlled.
VARIABLES
• Dependent Variable
Dependent Variable
– Criterion by which the results of the experiment are
judged.
– Variable that is expected to be dependent on the
manipulation of the independent variable
• Independent Variable
Independent Variable
– Any variable that can be manipulated, or altered,
independently of any other variable
Sample Problem:
Example of Variables in Scientific Experiments
If a scientist conducts an experiment to test the theory that
a vitamin could extend a person’s life-expectancy, then:
What is the independent variable?
What is the dependent variable?
Sample Problem:
If a scientist conducts an experiment to test the theory that
a vitamin could extend a person’s life-expectancy, then:
Independent variable:
amount of vitamin that is given to the subjects within the
experiment.
Dependent variable:
the life span
Sample Problem:
• amount of vitamin that is given
to the subjects within the
experiment.
• life span
• Extraneous Variables
Extraneous Variables
– Variables other than the manipulated
variables that affect the results of the
experiment
– Can potentially invalidate the results
Are there significant differences observed
among the chick performance such as the
weight, vitality and mortality of the chicks among
different groups?
What is the independent variable?
What is the dependent variable?
What are the extraneous variables?
MORE DEFINITIONS
• Experimental Treatments
Experimental Treatments
– Alternative manipulations/intervention of the
independent variable being investigated
• Experimental Group
Experimental Group
– Group of subjects exposed to the experimental
treatment
• Control Group
Control Group
– Group of subjects exposed to the control condition
– Not exposed to the experimental treatment
MORE DEFINITIONS
• Test Unit
Test Unit
– Entity whose responses to experimental treatments are being
observed or measured.
• Randomization
Randomization
– Assignment of subjects and treatments to groups is based on
chance
– Provides “control by chance”
– Random assignment allows the assumption that the groups are
identical with respect to all variables except the experimental
treatment
• Utilizes scientific method to test cause –and-effect
relationships under conditioned controlled by the
researcher.
• Effort is made to determine ad impose control over all
other variables except one.
• An independent variable is manipulated to determine
the effects on the dependent variables.
• A teacher would like to know if the new teaching
strategy is effective or not so he teaches one section
using new strategy and teaches another comparable
section without the new strategy, then the
achievement test was given to the two sections
EXAMPLE:
A teacher would like to know if the new teaching
strategy is effective or not so he teaches one section
using new strategy and teaches another comparable
section without the new strategy, then the
achievement test was given to the two sections
EXPERIMENTAL RESEARCH
(GROUP DESIGN)
1. Pre-experimental design (Weak Designs)
2. True-experimental design
3. Quasi-experimental design
Symbolism for Diagramming
Experimental Designs
X
X = exposure of a group to an experimental treatment
O
O = observation or measurement of the dependent variable
If multiple observations or measurements are taken, subscripts
indicate temporal order –
I.e., O1, O2, etc.
= random assignment of test units;
individuals selected as subjects for the experiment are
randomly assigned to the experimental groups
R
R
Pre-Experimental Designs
• Do not adequately control for the problems associated
with loss of external or internal validity
• Cannot be classified as true experiments
• Often used in exploratory research
• Three Examples of Pre-Experimental Designs
– One-Shot Design
– One-Group Pretest-Posttest Design
– Static Group Design
1. One-Shot Design
• A.K.A. – after-only design
after-only design
• A single measure is recorded after the treatment is
administered
• Study lacks any comparison or control of extraneous influences
• No measure of test units not exposed to the experimental
treatment
• May be the only viable choice in taste tests
• Diagrammed as: X O1
SAMPLE PROBLEM
One-Shot Design
A group of cyclist riders were given a brochure
to read about safe biking and aptitude test was
administered after giving the brochure.
Diagrammed as: X O1
2. One-Group Pretest-Posttest Design
• Subjects in the experimental group are measured before
and after the treatment is administered.
• No control group
• Offers comparison of the same individuals before and after
the treatment (e.g., training)
• If time between 1st
& 2nd
measurements is extended, may
suffer maturation
• Can also suffer from history, mortality, and testing effects
• Diagrammed as O1 X O2
SAMPLE PROBLEM
One-Group Pretest-Posttest Design
Students in a homogenous section were given a
diagnostic test in Mathematics. Then, they
designed a software to improve learning outcomes
in this subject. Afterwards, they were given an
achievement test to show how technology can be
successfully implemented in schools.
• Diagrammed as O1 X O2
3. Static Group Design
•A.K.A., after-only design with control group
after-only design with control group
•Experimental group is measured after being exposed to the
experimental treatment
•Control group is measured without having been exposed to the
experimental treatment
•No pre-measure is taken
•Major weakness is lack of assurance that the groups were equal
on variables of interest prior to the treatment
•Diagrammed as: Experimental Group X O1
Control Group O2
SAMPLE PROBLEM
Static Group Design
First group of psychologist students received a pamphlet
and then administered the attitude survey. A second
group of psychologist students was given the attitude
survey but not the pamphlet.
• Diagrammed as:
• Experimental Group X O1
Control Group O2
True-Experimental Designs
• It can establish cause and effect relationships
• Supports or refutes a hypothesis using statistical analysis
• There are three criteria that must be met in a true experiment
Control group and experimental group
Researcher-manipulated variable
Random assignment
• Three Examples of True-Experimental Designs
– Pretest-Posttest Control Group Design
– Posttest-Only Control Group Design
– Solomon Four-Group Design
1. Pretest-Posttest Control Group Design
• A.K.A., Before-After with Control
Before-After with Control
• True experimental design
• Experimental group tested before and after treatment exposure
• Control group tested at same two times without exposure to
experimental treatment
• Includes random assignment to groups
• Effect of all extraneous variables assumed to be the same on
both groups
• Do run the risk of a testing effect
Pretest-Posttest Control Group Design
• Diagrammed as
– Experimental Group: O1 X O2
– Control Group: O3 O4
• Effect of the experimental treatment equals
(O2 – O1) -- (O4 – O3)
R
R
SAMPLE PROBLEM
Pretest-Posttest Control Group Design
Researchers want to monitor the effect of a new teaching method upon
two groups of children, both with pretest and posttest. Only the
second group has the treatment. Other areas include evaluating the
effects of counseling, testing medical treatments, and measuring
psychological constructs. The only stipulation is that the subjects
must be randomly assigned to groups, in a true experimental design.
• Diagrammed as
– Experimental Group: O1 X O2
– Control Group: O3 O4 nice or confounding
variables.
2. Posttest-Only Control Group Design
• A.K.A., After-Only with Control
After-Only with Control
• True experimental design
• Experimental group tested after treatment exposure
• Control group tested at same time without exposure to experimental
treatment
• Includes random assignment to groups
• Effect of all extraneous variables assumed to be the same on both groups
• Do not run the risk of a testing effect
• Use in situations when cannot pretest
Posttest-Only Control Group Design
•Diagrammed as
– Experimental Group: X O1
– Control Group: O2
•Effect of the experimental treatment equals
(O2 – O1)
R
R
SAMPLE PROBLEM
Posttest-Only Control Design
One group is given a medicine, whereas the control group is given
none, and this allows the researchers to determine if the drug really
works by administering a laboratory tests on both groups. This type
of design, while commonly using two groups, can be slightly more
complex.
• Diagrammed as
– Experimental Group: X O1
– Control Group: O2
3. Solomon Four-Group Design
• True experimental design
• Combines pretest-posttest with control group design
and the posttest-only with control group design
• Provides means for controlling the interactive testing
effect and other sources of extraneous variation
• Does include random assignment
Solomon Four-Group Design
• Diagrammed as
– Experimental Group 1: O1 X O2
– Control Group 1: O3 O4
– Experimental Group 2: X O5
– Control Group 2: O6
• Effect of independent variable (O2 – O4) & (O5 – O6)
• Effect of pretesting (O4 – O6)
• Effect of pretesting & measuring (O2 – O5)
• Effect of random assignment (O1 – O3)
R
R
R
R
SAMPLE PROBLEM
Solomon Four Group Design
A researcher would like to find out the effect of reading intervention in
the student’s English academic grade. All groups undergo
randomization. First group, students with intervention, pretest &
posttest. Second group, students with pretest & posttest only. Third
group, students with intervention & posttest. Fourth group, students
were given posttest only.
• Diagrammed as
– Experimental Group 1: O1 X O2
– Control Group 1: O3 O4
– Experimental Group 2: X O5
– Control Group 2: O6
Quasi-Experimental Designs
• More realistic than true experiments
• Researchers lacks full control over the scheduling
of experimental treatments or
• They are unable to randomize
• Includes
– Time Series Design
– Multiple Time Series Design
• Same as Time Series Design except that a control group is added
1. Time Series Design
• Involves periodic measurements on the dependent variable
for a group of test units (one group only)
• After multiple measurements, experimental treatment is
administered (or occurs naturally)
• After the treatment, periodic measurements are continued
in order to determine the treatment effect
• Diagrammed as:
O1O2 O3 O4 X O5 O6 O7 O8
Time Series Design
To examine the effect of a new, government-funded meal
program on school children, a nutritional scale is administered
to a sample of school children receiving this program. The
nutritional scale is measured once before the program, and then
3 months after the program, and at the end of one year
following program implementation. The outcomes at different
time points are compared to assess the program effect.
SAMPLE PROBLEM
Diagrammed as:
O1 O2 O3 O4 X O5 O6 O7 O8
2. Multiple Time Series Design
• A series of periodic measurements is taken from two
groups of test units (an experimental group and a control).
• The experimental group is exposed to a treatment and then
another series of periodic measurements is taken from both
groups.
Diagrammed as:
O1 O2 O3 O4 O5 O6 O7 O8
O1 O2 O3 O4 X O5 O6 O7 O8
Multiple Time Series Design
Suppose that a weight loss study used different follow-up
procedures for experimental and control group participants. The
researchers assess weight data after one year by telephoning
control group participants, but they have the intervention
participants come in to the clinic to be weighed. Then the weight
differences between the groups could be due to differing
assessment procedures, rather than to the intervention.
SAMPLE PROBLEM
Diagrammed as:
O1 O2 O3 O4 O5 O6 O7 O8
O1 O2 O3 O4 X O5 O6 O7 O8
1. Constant – do not undergo any changes during an
experiment
2. Attribute – characteristics of people: intelligence, creativity,
anxiety, learning styles, etc.
3. Covariate – included in the research study to create
interactions with the independent and dependent variables
Other Types of Variables
(Russell 2013; Babbie 2013)
4. Continuous – quantitative in nature and is used in interval or
ratio scale of measurement
5. Dichotomous – has only two possible results: one or zero
6. Latent – cannot be directly observed like personality traits
Other Types of Variables
(Russell 2013; Babbie 2013)
7. Manifest – can be directly observed to give proofs to
latent variables
8. Exogenous – found outside an identified model
9. Endogenous – found inside; as a part of identified model
Other Types of Variables
(Russell 2013; Babbie 2013)
-is a variable with no quantitative
value. It has two or more categories but
does not imply ordering of classes.
Ex. sex, nationality, religion
-is a variable that has two or more
categories which can be ranked.
Ex. company Position, class
organization, educational attainment
Provides number that reflect
differences among items. With interval
scales the measurement units are equal.
They have NO true zero value
Ex. Temperature
It has an absolute zero value.
Ex. measures of length, width, weight,
capacity and loudness and others
THANK YOU
For Listening!

WEEK 2-Nature of Inquiry and Research.ppt

  • 2.
  • 3.
    The systematic searchfor The systematic search for pertinent information on specific pertinent information on specific topic of problem (Aquino, 1970). topic of problem (Aquino, 1970).
  • 4.
    Research is anattempt to gain solutions Research is an attempt to gain solutions to problems. More precisely, it is the to problems. More precisely, it is the collection of data in rigorously collection of data in rigorously controlled situation for the purpose of controlled situation for the purpose of prediction or explanation prediction or explanation (Quinton, 2006). (Quinton, 2006).
  • 7.
    1. Objective 1. Objective 2.Clearly Defined Research Questions 2. Clearly Defined Research Questions 3. Structured Research Instruments 3. Structured Research Instruments 4. Numerical Data 4. Numerical Data 5. Large Sample Size 5. Large Sample Size 6. Replication 6. Replication 7. Future Outcomes 7. Future Outcomes 8. Verifies Existing Facts 8. Verifies Existing Facts
  • 8.
    1. 1. It isobjective. It is objective. 2. 2. The use of statistical techniques facilitates The use of statistical techniques facilitates sophisticated sophisticated analyses analyses and allow you to comprehend a huge amount and allow you to comprehend a huge amount of vital characteristics of data. of vital characteristics of data. 3. 3. The numerical data can be The numerical data can be analyzed in a quick and easy analyzed in a quick and easy way way. By employing statistically valid random models, . By employing statistically valid random models, findings can be findings can be generalized generalized to the population about to the population about which information is necessary. which information is necessary.
  • 9.
    4. Quantitative studiesare replicable. 4. Quantitative studies are replicable. Standardized approaches allow the study to be Standardized approaches allow the study to be replicated in different areas or over time with the replicated in different areas or over time with the formulation of comparative findings. formulation of comparative findings.
  • 10.
    1. 1. It requiresa large number of respondents. It requires a large number of respondents. 2. 2. It is costly. It is costly. 3. 3. The information contextual factors to help interpret the The information contextual factors to help interpret the results or to explain variations are usually ignored. results or to explain variations are usually ignored. 4. 4. Many information are difficult to gather. Many information are difficult to gather. 5. 5. Data from questionnaires may be incomplete and Data from questionnaires may be incomplete and inaccurate. inaccurate. 6. 6. Respondents’ answer may be unreliable. Respondents’ answer may be unreliable. 7. 7. Instruments preparation may take time Instruments preparation may take time
  • 14.
    • It isincapable of establishing cause-effect relationships; by itself, it is able, if it takes place in conjunction with other experimental and quasi-experimental research methods. • It uses research method that is applicable to both quantitative and qualitative data. • It collects data through survey, observation, historical studies, case studies, documentary analysis, and so on. (Suter, 2012; Sarantakos, 2013)
  • 15.
    How many hourssenior high school students spend in social media The number of malnourished students who failed in the achievement test How healthy is the food served during recess in the public school • Describing the nature, characteristics and components of the population or a phenomenon • NO manipulation of variables or search for cause and effect related to the phenomenon. • This design attempts to find general attributes of the presently existing situation and determine the frequency with which it occurs.
  • 16.
    If pre-board examinationresults can be used to predict performance in LET Are sex and mathematical ability related? Marriage and cancer recovery • It is systematic investigation of the nature of relationships, or associations between and among variables without necessarily investigating into casual reasons underlying them. • It is concerned with he extent of relationship that exists between or among the variables.
  • 17.
    If Assessing theimplementation of nursing care in a hospital Determining the impact of a new treatment procedure for patients • It aims to assess the effects, impacts or outcomes of practices, policies, or programs.
  • 18.
    • used togather information from groups of people by selecting and studying samples from a population. • Cross-sectional if the information is collected from a sample in just a single point in time (Child-rearing practices of single parents) • Longitudinal if the research collects information on the same subjects over a period of time (TO determine the growth of rice field in the country; rate of promotion of doctorate degree holders five years after earning a degree)
  • 20.
  • 21.
    What is anExperiment? • Research method in which – conditions are controlled – so that 1 or more independent variables independent variables – can be manipulated to test a hypothesis – about a dependent variable dependent variable. • Allows – evaluation of causal relationships among variables – while all other variables are eliminated or controlled.
  • 22.
    VARIABLES • Dependent Variable DependentVariable – Criterion by which the results of the experiment are judged. – Variable that is expected to be dependent on the manipulation of the independent variable • Independent Variable Independent Variable – Any variable that can be manipulated, or altered, independently of any other variable
  • 23.
    Sample Problem: Example ofVariables in Scientific Experiments If a scientist conducts an experiment to test the theory that a vitamin could extend a person’s life-expectancy, then: What is the independent variable? What is the dependent variable?
  • 24.
    Sample Problem: If ascientist conducts an experiment to test the theory that a vitamin could extend a person’s life-expectancy, then: Independent variable: amount of vitamin that is given to the subjects within the experiment. Dependent variable: the life span
  • 25.
    Sample Problem: • amountof vitamin that is given to the subjects within the experiment. • life span
  • 26.
    • Extraneous Variables ExtraneousVariables – Variables other than the manipulated variables that affect the results of the experiment – Can potentially invalidate the results
  • 27.
    Are there significantdifferences observed among the chick performance such as the weight, vitality and mortality of the chicks among different groups? What is the independent variable? What is the dependent variable? What are the extraneous variables?
  • 28.
    MORE DEFINITIONS • ExperimentalTreatments Experimental Treatments – Alternative manipulations/intervention of the independent variable being investigated • Experimental Group Experimental Group – Group of subjects exposed to the experimental treatment • Control Group Control Group – Group of subjects exposed to the control condition – Not exposed to the experimental treatment
  • 29.
    MORE DEFINITIONS • TestUnit Test Unit – Entity whose responses to experimental treatments are being observed or measured. • Randomization Randomization – Assignment of subjects and treatments to groups is based on chance – Provides “control by chance” – Random assignment allows the assumption that the groups are identical with respect to all variables except the experimental treatment
  • 30.
    • Utilizes scientificmethod to test cause –and-effect relationships under conditioned controlled by the researcher. • Effort is made to determine ad impose control over all other variables except one. • An independent variable is manipulated to determine the effects on the dependent variables. • A teacher would like to know if the new teaching strategy is effective or not so he teaches one section using new strategy and teaches another comparable section without the new strategy, then the achievement test was given to the two sections
  • 31.
    EXAMPLE: A teacher wouldlike to know if the new teaching strategy is effective or not so he teaches one section using new strategy and teaches another comparable section without the new strategy, then the achievement test was given to the two sections
  • 32.
    EXPERIMENTAL RESEARCH (GROUP DESIGN) 1.Pre-experimental design (Weak Designs) 2. True-experimental design 3. Quasi-experimental design
  • 33.
    Symbolism for Diagramming ExperimentalDesigns X X = exposure of a group to an experimental treatment O O = observation or measurement of the dependent variable If multiple observations or measurements are taken, subscripts indicate temporal order – I.e., O1, O2, etc. = random assignment of test units; individuals selected as subjects for the experiment are randomly assigned to the experimental groups R R
  • 34.
    Pre-Experimental Designs • Donot adequately control for the problems associated with loss of external or internal validity • Cannot be classified as true experiments • Often used in exploratory research • Three Examples of Pre-Experimental Designs – One-Shot Design – One-Group Pretest-Posttest Design – Static Group Design
  • 35.
    1. One-Shot Design •A.K.A. – after-only design after-only design • A single measure is recorded after the treatment is administered • Study lacks any comparison or control of extraneous influences • No measure of test units not exposed to the experimental treatment • May be the only viable choice in taste tests • Diagrammed as: X O1
  • 36.
    SAMPLE PROBLEM One-Shot Design Agroup of cyclist riders were given a brochure to read about safe biking and aptitude test was administered after giving the brochure. Diagrammed as: X O1
  • 37.
    2. One-Group Pretest-PosttestDesign • Subjects in the experimental group are measured before and after the treatment is administered. • No control group • Offers comparison of the same individuals before and after the treatment (e.g., training) • If time between 1st & 2nd measurements is extended, may suffer maturation • Can also suffer from history, mortality, and testing effects • Diagrammed as O1 X O2
  • 38.
    SAMPLE PROBLEM One-Group Pretest-PosttestDesign Students in a homogenous section were given a diagnostic test in Mathematics. Then, they designed a software to improve learning outcomes in this subject. Afterwards, they were given an achievement test to show how technology can be successfully implemented in schools. • Diagrammed as O1 X O2
  • 39.
    3. Static GroupDesign •A.K.A., after-only design with control group after-only design with control group •Experimental group is measured after being exposed to the experimental treatment •Control group is measured without having been exposed to the experimental treatment •No pre-measure is taken •Major weakness is lack of assurance that the groups were equal on variables of interest prior to the treatment •Diagrammed as: Experimental Group X O1 Control Group O2
  • 40.
    SAMPLE PROBLEM Static GroupDesign First group of psychologist students received a pamphlet and then administered the attitude survey. A second group of psychologist students was given the attitude survey but not the pamphlet. • Diagrammed as: • Experimental Group X O1 Control Group O2
  • 41.
    True-Experimental Designs • Itcan establish cause and effect relationships • Supports or refutes a hypothesis using statistical analysis • There are three criteria that must be met in a true experiment Control group and experimental group Researcher-manipulated variable Random assignment • Three Examples of True-Experimental Designs – Pretest-Posttest Control Group Design – Posttest-Only Control Group Design – Solomon Four-Group Design
  • 42.
    1. Pretest-Posttest ControlGroup Design • A.K.A., Before-After with Control Before-After with Control • True experimental design • Experimental group tested before and after treatment exposure • Control group tested at same two times without exposure to experimental treatment • Includes random assignment to groups • Effect of all extraneous variables assumed to be the same on both groups • Do run the risk of a testing effect
  • 43.
    Pretest-Posttest Control GroupDesign • Diagrammed as – Experimental Group: O1 X O2 – Control Group: O3 O4 • Effect of the experimental treatment equals (O2 – O1) -- (O4 – O3) R R
  • 44.
    SAMPLE PROBLEM Pretest-Posttest ControlGroup Design Researchers want to monitor the effect of a new teaching method upon two groups of children, both with pretest and posttest. Only the second group has the treatment. Other areas include evaluating the effects of counseling, testing medical treatments, and measuring psychological constructs. The only stipulation is that the subjects must be randomly assigned to groups, in a true experimental design. • Diagrammed as – Experimental Group: O1 X O2 – Control Group: O3 O4 nice or confounding variables.
  • 45.
    2. Posttest-Only ControlGroup Design • A.K.A., After-Only with Control After-Only with Control • True experimental design • Experimental group tested after treatment exposure • Control group tested at same time without exposure to experimental treatment • Includes random assignment to groups • Effect of all extraneous variables assumed to be the same on both groups • Do not run the risk of a testing effect • Use in situations when cannot pretest
  • 46.
    Posttest-Only Control GroupDesign •Diagrammed as – Experimental Group: X O1 – Control Group: O2 •Effect of the experimental treatment equals (O2 – O1) R R
  • 47.
    SAMPLE PROBLEM Posttest-Only ControlDesign One group is given a medicine, whereas the control group is given none, and this allows the researchers to determine if the drug really works by administering a laboratory tests on both groups. This type of design, while commonly using two groups, can be slightly more complex. • Diagrammed as – Experimental Group: X O1 – Control Group: O2
  • 48.
    3. Solomon Four-GroupDesign • True experimental design • Combines pretest-posttest with control group design and the posttest-only with control group design • Provides means for controlling the interactive testing effect and other sources of extraneous variation • Does include random assignment
  • 49.
    Solomon Four-Group Design •Diagrammed as – Experimental Group 1: O1 X O2 – Control Group 1: O3 O4 – Experimental Group 2: X O5 – Control Group 2: O6 • Effect of independent variable (O2 – O4) & (O5 – O6) • Effect of pretesting (O4 – O6) • Effect of pretesting & measuring (O2 – O5) • Effect of random assignment (O1 – O3) R R R R
  • 50.
    SAMPLE PROBLEM Solomon FourGroup Design A researcher would like to find out the effect of reading intervention in the student’s English academic grade. All groups undergo randomization. First group, students with intervention, pretest & posttest. Second group, students with pretest & posttest only. Third group, students with intervention & posttest. Fourth group, students were given posttest only. • Diagrammed as – Experimental Group 1: O1 X O2 – Control Group 1: O3 O4 – Experimental Group 2: X O5 – Control Group 2: O6
  • 51.
    Quasi-Experimental Designs • Morerealistic than true experiments • Researchers lacks full control over the scheduling of experimental treatments or • They are unable to randomize • Includes – Time Series Design – Multiple Time Series Design • Same as Time Series Design except that a control group is added
  • 52.
    1. Time SeriesDesign • Involves periodic measurements on the dependent variable for a group of test units (one group only) • After multiple measurements, experimental treatment is administered (or occurs naturally) • After the treatment, periodic measurements are continued in order to determine the treatment effect • Diagrammed as: O1O2 O3 O4 X O5 O6 O7 O8
  • 53.
    Time Series Design Toexamine the effect of a new, government-funded meal program on school children, a nutritional scale is administered to a sample of school children receiving this program. The nutritional scale is measured once before the program, and then 3 months after the program, and at the end of one year following program implementation. The outcomes at different time points are compared to assess the program effect. SAMPLE PROBLEM Diagrammed as: O1 O2 O3 O4 X O5 O6 O7 O8
  • 54.
    2. Multiple TimeSeries Design • A series of periodic measurements is taken from two groups of test units (an experimental group and a control). • The experimental group is exposed to a treatment and then another series of periodic measurements is taken from both groups. Diagrammed as: O1 O2 O3 O4 O5 O6 O7 O8 O1 O2 O3 O4 X O5 O6 O7 O8
  • 55.
    Multiple Time SeriesDesign Suppose that a weight loss study used different follow-up procedures for experimental and control group participants. The researchers assess weight data after one year by telephoning control group participants, but they have the intervention participants come in to the clinic to be weighed. Then the weight differences between the groups could be due to differing assessment procedures, rather than to the intervention. SAMPLE PROBLEM Diagrammed as: O1 O2 O3 O4 O5 O6 O7 O8 O1 O2 O3 O4 X O5 O6 O7 O8
  • 56.
    1. Constant –do not undergo any changes during an experiment 2. Attribute – characteristics of people: intelligence, creativity, anxiety, learning styles, etc. 3. Covariate – included in the research study to create interactions with the independent and dependent variables Other Types of Variables (Russell 2013; Babbie 2013)
  • 57.
    4. Continuous –quantitative in nature and is used in interval or ratio scale of measurement 5. Dichotomous – has only two possible results: one or zero 6. Latent – cannot be directly observed like personality traits Other Types of Variables (Russell 2013; Babbie 2013)
  • 58.
    7. Manifest –can be directly observed to give proofs to latent variables 8. Exogenous – found outside an identified model 9. Endogenous – found inside; as a part of identified model Other Types of Variables (Russell 2013; Babbie 2013)
  • 60.
    -is a variablewith no quantitative value. It has two or more categories but does not imply ordering of classes. Ex. sex, nationality, religion
  • 61.
    -is a variablethat has two or more categories which can be ranked. Ex. company Position, class organization, educational attainment
  • 62.
    Provides number thatreflect differences among items. With interval scales the measurement units are equal. They have NO true zero value Ex. Temperature
  • 63.
    It has anabsolute zero value. Ex. measures of length, width, weight, capacity and loudness and others
  • 64.

Editor's Notes

  • #2 The systematic investigation into and study of materials and sources in order to establish facts and reach new conclusions. A detailed study of a subject in order to discover information or achieve a new understanding of it.
  • #20 Most powerful design Used to establish cause and effect by manipulating (influencing) an IV (independent variable) to see its effect on a DV (dependent variable) Goes beyond description and prediction. Comparison of groups (at least two groups of subjects, called treatment and control groups)