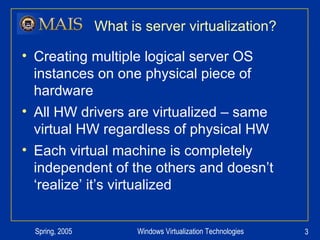
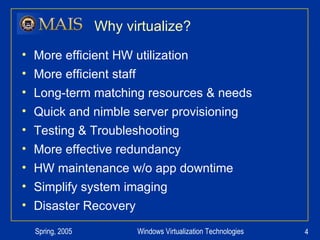
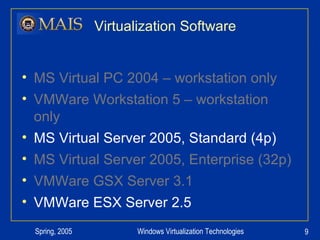
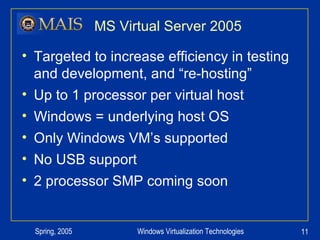
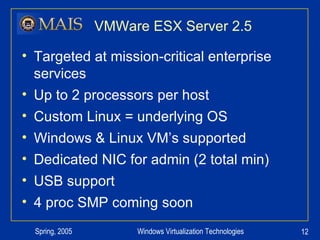
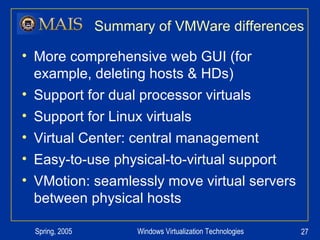
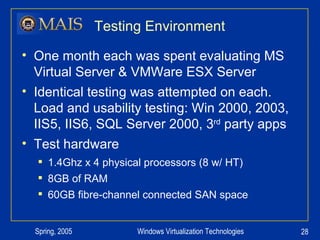
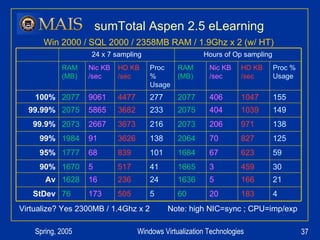
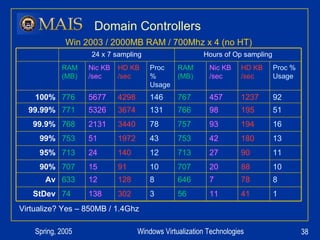
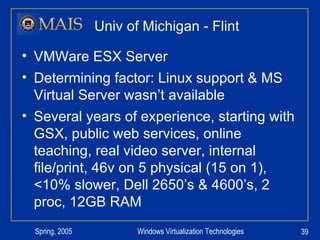
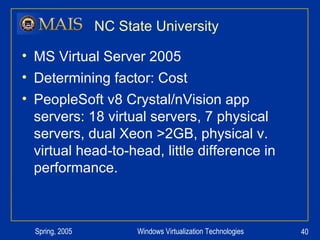
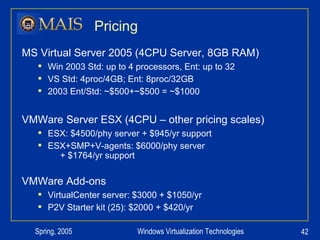
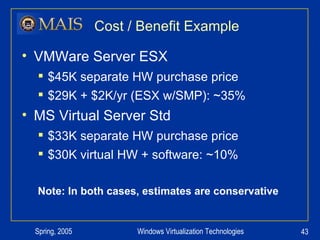
Server Virtualization Technologies: Uses, Comparisons, and Implications David Sweetman  Windows Enterprise Systems Admin Administrative Information Services University of Michigan [email_address] University of Michigan Administrative Information Services
Presentation Overview The What and Why of virtualization Comparing Product Features Comparing Product Performance Evaluating Physical Servers for virtualization Costs Questions
What is server virtualization? Creating multiple logical server OS instances on one physical piece of hardware All HW drivers are virtualized – same virtual HW regardless of physical HW Each virtual machine is completely independent of the others and doesn’t ‘realize’ it’s virtualized
Why virtualize? More efficient HW utilization More efficient staff Long-term matching resources & needs Quick and nimble server provisioning  Testing & Troubleshooting More effective redundancy HW maintenance w/o app downtime Simplify system imaging Disaster Recovery
HW Utilization Facts Individual ebb and flow of resources Cumulative usage of 28 servers in the MAIS data center evaluated for virtualization: 44GB RAM, 138.15Ghz CPU, and 1323GB HD 45% of RAM not used 99.9% of time. 25% of RAM never used concurrently. 85% of CPU not used 99.9% of time. 81% of CPU never used concurrently. 68% of hard disk space unused
Hard Disk Utilization More Efficient Hard Disk Utilization Total: 1323 GB Used: 418 GB Free: 905 GB (68% unused) SAN in 30GB chunks 1 fibre channel >1 server Virtual HDs more granular Share free space – allocate as needed Free (GB) Used (GB) Total (GB) Server Local Disk 34 170 68 34 68 68 68 17 34 136 17 68 34 34 68 68 48 7 88 6 13 10 11 16 6 6 56 9 31 24 7 13 9 8 27 Domain Controller 82 IIS document server 62 Machine Room environ 21 IIS: eLearning Prod 58 SQL: eLearning Prod IIS: eLearning dev SQL: eLearning dev Stat Version Control Stat Version Control File Servers Small use Citrix IIS / SQL:Research app PeopelSoft 8 FIN PeopleSoft 8 HE TNG Scheduling IIS app test SAN Manager 57 52 11 28 80 8 37 10 27 55 59 40
Virtualization vs. Consolidation Virtualized servers = separate OSes Consolidation = same OS Virtualized servers must each be administered, patched, etc. Consolidated applications can introduce conflicts and support issues
Virtual Host Licensing Windows and other Microsoft per-server apps are licensed per virtual server.  (1 physical server w/ 6 virtual Windows servers = 6-7 licenses needed) As of 4/1/2005, Microsoft per-processor licenses are per physical processor (1 physical server w/ 3 virtual SQL Servers sharing 1 CPU = 1 per-processor license) Virtualization savings are not in licenses. Check with other vendors.
Virtualization Software MS Virtual PC 2004 – workstation only VMWare Workstation 5 – workstation only MS Virtual Server 2005, Standard (4p) MS Virtual Server 2005, Enterprise (32p) VMWare GSX Server 3.1 VMWare ESX Server 2.5
Common Features Up to 3.6GB RAM per virtual host Web-based console for administration Host OS sees HT CPU, virtual do not VMs consist of 1 config file & 1 file / HD VMs can mount physical CDs or ISOs VMs can be multi-homed Up to 64 VMs per host server Highly scriptable – extensive API Granular permissions for individual VMs Detailed logging
MS Virtual Server 2005 Targeted to increase efficiency in testing and development, and “re-hosting” Up to 1 processor per virtual host Windows = underlying host OS Only Windows VM’s supported No USB support 2 processor SMP coming soon
VMWare ESX Server 2.5 Targeted at mission-critical enterprise services Up to 2 processors per host Custom Linux = underlying OS Windows & Linux VM’s supported Dedicated NIC for admin (2 total min) USB support 4 proc SMP coming soon
Do I need to know Linux? VMWare ESX Server is based on Linux All administration is possible through web Don’t need any Linux experience for installation or ongoing admin SSH and SFTP access to server Used?  Installed backup software sFTP’ed ISO’s to server
Managing Virtual Servers Web site is primary interface Attach to VM console Virtual Server = ActiveX control VMWare = separate application Reboot, power on, power off Create and manage VM’s Allocate hardware resources Mount CDs and floppies View recent performance data
VS Screenshot
VMWare Screenshot
Hyper-threading One physical CPU seen as 2 logical Both products see HT, non-HT VMs Slows virtualization performance 1 HT CPU < 2 Phy CPU 0-20% performance increase over no HT http://www.intel.com/technology/hyperthread/
RAM Allocation Virtual Server:    Max <= total physical memory VMWare:    Max <> total physical RAM Ballooning RAM pooled across multiple VMs Enables more efficient RAM utilization If max out, goes to paging file
VS Screenshot
VMWare Screenshot
Monitoring MOM (or other host monitoring): Monitors VMs like physical Virtual Server: MOM Management Pack Integrates into MOM framework Monitor overall host and VM servers VMWare: vmkusage VMWare: VirtualCenter Database back-end across all servers
Virtual Center Central monitoring and management in VMWare environment Manage all VMs from one interface Additional software / license Management application Set thresholds and actions – like MOM SQL or Oracle DB backend Assign privileges via NTFS
Virtual Center Screenshot
Converting Physical Server Both MS & VMWare offer tools to create virtual systems from physical Physical HW drivers replaced by VM Ideal for the truly unique server (highly customized) Both vendors recommend loading virtual servers from scratch Slow for both vendors – 6h / 4GB image VSMT (Virtual Server Migration Tool) many prereqs (DHCP, ADS, SQL) Not in one month eval P2V (Physical 2 Virtual) Simple boot CD and ‘server’ piece Licensed per use
VMotion Enables seamless transition of live virtual host between physical servers Dynamic Resource Allocation across servers – respond to load changes HW maintenance
Best Practices Plan out server allocations Create “gold image” – base OS kept up-to-date patches – duplicate for new VMs Use ISO’s for CD access Use standard backup and restore Take system images as needed
Summary of VMWare differences More comprehensive web GUI (for example, deleting hosts & HDs) Support for dual processor virtuals Support for Linux virtuals Virtual Center: central management Easy-to-use physical-to-virtual support VMotion: seamlessly move virtual servers between physical hosts
Testing Environment One month each was spent evaluating MS Virtual Server & VMWare ESX Server Identical testing was attempted on each.  Load and usability testing: Win 2000, 2003, IIS5, IIS6, SQL Server 2000, 3 rd  party apps Test hardware 1.4Ghz x 4 physical processors (8 w/ HT) 8GB of RAM 60GB fibre-channel connected SAN space
Performance Comparisons Automated load test of Aspen 2.5 dev environment (Win 2000/IIS5 & Win 2000/SQL 2000) Citrix / TS load test w/ Helpdesk IIS6-based memory, CPU, disk, and network I/O testing SQL Server add, update, and delete testing Load testing both as isolated server and with other virtual server processing ‘ Normal usage’ w/o issue in all cases
Performance Comparisons Windows 2003 IIS6 and SQL 2000 perf compare VMWare CPU : hyper-threaded related, ~93% w/o VS SQL : VS 2005 SP1 has performance enhancements 87% 57% 100% SQL 101% 101% 100% Disk&NIC I/O 91% 91% 100% Memory 80% 94% 100% CPU VMWare MSVS Physical
Performance Comparisons Previous stats were isolated tests VMs won’t be alone on physical host How does system perform w/ other VMs running assorted, intensive tasks? -  <5% -  <5% Disk -  <5% Same Same VMWare ESX Server -  <5% -/+ <10% -/+ <10% Virtual Server 2005 Network CPU RAM
IIS/SQL Load Test Results Mercury LoadRunner scripted test Overall performance 100@30/min:  VM = 60% 1000@12/min: VM = 99% What made it slow? CPU queuing Memory, HD, NetIO – nearly identical
Terminal Services / Citrix  Load Test Results Currently 14 servers, 4procs (8HT), 4GB RAM –load balancing ~700 concurrent CPU and RAM intensive apps ~60 users max per physical server CPU = bottleneck (logon & BusObj) 1CPU = 7 users max ; 2 CPU = 12 max 100 v 1CPU or 58 v 2CPU to match 14 physicals Recommendation: 2 CPU & only for small use
Business Objects WebI dev Virtualize? Yes. 900 / 1.4Ghz Win 2000 / IIS5 / 2400MB RAM / 1.4Ghz x 2 (no HT) Hours of Op sampling 24 x 7 sampling 1 136 4 44 3 86 4 47 StDev 1 52 2 759 2 55 2 755 Av 5 63 2 812 2 64 2 809 90% 6 65 11 814 3 65 4 813 95% 7 67 17 816 3 76 17 816 99% 22 85 32 821 52 487 19 823 99.9% 24 97 47 839 55 1548 45 839 99.99% 34 4324 61 847 112 4324 61 847 100% Proc % Usage HD KB /sec Nic KB /sec RAM (MB) Proc % Usage HD KB /sec Nic KB /sec RAM (MB)
PSoft 8 Fin Crystal/nVision: Dev Virtualize? Yes. 900 / 1.4Ghz Win 2000 / 2300MB RAM / 1.1Ghz x 2 (no HT) Hours of Op sampling 24 x 7 sampling 3 181 87 106 8 834 51 91 StDev 2 49 3 662 4 205 2 644 Av 2 32 3 799 2 61 3 786 90% 3 100 3 809 10 910 3 798 95% 13 1015 5 819 67 4802 4 814 99% 75 1494 72 822 82 4912 31 821 99.9% 92 1555 4542 829 89 5005 2973 822 99.99% 106 2529 5284 835 106 5038 5284 835 100% Proc % Usage HD KB /sec Nic KB /sec RAM (MB) Proc % Usage HD KB /sec Nic KB /sec RAM (MB)
PSoft8 HE Crystal/nVision - Prod Virtualize?  NOT at this time  – CPU needs too high Win 2000 / 1500MB RAM / 2.8Ghz x 1 (w/ HT) Hours of Op sampling 24 x 7 sampling 6 159 109 63 7 356 162 67 StDev 21 49 7 363 23 105 10 378 Av 22 51 1 437 23 50 1 447 90% 32 74 11 440 34 183 8 483 95% 220 351 119 460 192 2304 119 534 99% 267 779 674 691 244 2440 1422 620 99.9% 333 3379 3493 713 329 3379 9803 710 99.99% 348 3421 9437 716 350 3421 11499 716 100% Proc % Usage HD KB /sec Nic KB /sec RAM (MB) Proc % Usage HD KB /sec Nic KB /sec RAM (MB)
sumTotal Aspen 2.5 eLearning Virtualize? Yes 2300MB / 1.4Ghz x 2  Note: high NIC=sync ; CPU=imp/exp Win 2000 / SQL 2000 / 2358MB RAM / 1.9Ghz x 2 (w/ HT) Hours of Op sampling 24 x 7 sampling 4 183 20 60 5 505 173 76 StDev 21 166 5 1636 24 236 16 1628 Av 30 459 3 1665 41 517 5 1670 90% 59 623 67 1684 101 839 68 1777 95% 125 827 70 2064 138 3626 91 1984 99% 138 971 206 2073 216 3673 2667 2073 99.9% 149 1039 404 2075 233 3682 5865 2075 99.99% 155 1047 406 2077 277 4477 9061 2077 100% Proc % Usage HD KB /sec Nic KB /sec RAM (MB) Proc % Usage HD KB /sec Nic KB /sec RAM (MB)
Domain Controllers Virtualize? Yes – 850MB / 1.4Ghz Win 2003 / 2000MB RAM / 700Mhz x 4 (no HT) Hours of Op sampling 24 x 7 sampling 1 41 11 56 3 302 138 74 StDev 8 78 7 646 8 128 12 633 Av 10 88 20 707 10 91 15 707 90% 11 90 27 713 12 140 24 713 95% 13 180 42 753 43 1972 51 753 99% 16 194 93 757 78 3440 2131 768 99.9% 51 195 98 766 131 3674 5326 771 99.99% 92 1237 457 767 146 4298 5677 776 100% Proc % Usage HD KB /sec Nic KB /sec RAM (MB) Proc % Usage HD KB /sec Nic KB /sec RAM (MB)
Univ of Michigan - Flint VMWare ESX Server Determining factor: Linux support & MS Virtual Server wasn’t available Several years of experience, starting with GSX, public web services, online teaching, real video server, internal file/print, 46v on 5 physical (15 on 1), <10% slower, Dell 2650’s & 4600’s, 2 proc, 12GB RAM
NC State University MS Virtual Server 2005 Determining factor: Cost PeopleSoft v8 Crystal/nVision app servers: 18 virtual servers, 7 physical servers, dual Xeon >2GB, physical v. virtual head-to-head, little difference in performance.
Potential Uses from Previous Presentations NAP - Remediation Servers – “Big Red Button” for critical fix – assign additional resources Keynote - Reliability – one of pillars of Trustworthy Computing Boston U – Matt - NetReg peak usage first couple weeks of semester WSUS 3Ghz, 1GB RAM recommended – sitting idle most of time? Decrease dev system allocation in busy times
Pricing MS Virtual Server 2005 (4CPU Server, 8GB RAM) Win 2003 Std: up to 4 processors, Ent: up to 32 VS Std: 4proc/4GB; Ent: 8proc/32GB 2003 Ent/Std: ~$500+~$500 = ~$1000 VMWare Server ESX (4CPU – other pricing scales) ESX: $4500/phy server + $945/yr support ESX+SMP+V-agents: $6000/phy server   + $1764/yr support VMWare Add-ons VirtualCenter server: $3000 + $1050/yr P2V Starter kit (25): $2000 + $420/yr
Cost / Benefit Example VMWare Server ESX $45K separate HW purchase price $29K + $2K/yr (ESX w/SMP): ~35% MS Virtual Server Std $33K separate HW purchase price $30K virtual HW + software: ~10% Note: In both cases, estimates are conservative
Summary / take-aways More effective resource utilization and response to changing needs (5-15% to 60-70%) Virtual Server & VMWare = comparable performance, VMWare more isolated VMWare more feature-rich: SMP, VMotion, manage multiple servers VMWare costs more, but you can do more, virtualize more costly servers Both platforms have limits, active improvement
Other Resources VMWare:  www.vmware.com Virtual Server:  www.microsoft.com/virtualserver/ Rapid App:  www.rapidapp.com
David Sweetman University of Michigan [email_address] Questions?

prezentációt

  • 1.
    Server Virtualization Technologies:Uses, Comparisons, and Implications David Sweetman Windows Enterprise Systems Admin Administrative Information Services University of Michigan [email_address] University of Michigan Administrative Information Services
  • 2.
    Presentation Overview TheWhat and Why of virtualization Comparing Product Features Comparing Product Performance Evaluating Physical Servers for virtualization Costs Questions
  • 3.
    What is servervirtualization? Creating multiple logical server OS instances on one physical piece of hardware All HW drivers are virtualized – same virtual HW regardless of physical HW Each virtual machine is completely independent of the others and doesn’t ‘realize’ it’s virtualized
  • 4.
    Why virtualize? Moreefficient HW utilization More efficient staff Long-term matching resources & needs Quick and nimble server provisioning Testing & Troubleshooting More effective redundancy HW maintenance w/o app downtime Simplify system imaging Disaster Recovery
  • 5.
    HW Utilization FactsIndividual ebb and flow of resources Cumulative usage of 28 servers in the MAIS data center evaluated for virtualization: 44GB RAM, 138.15Ghz CPU, and 1323GB HD 45% of RAM not used 99.9% of time. 25% of RAM never used concurrently. 85% of CPU not used 99.9% of time. 81% of CPU never used concurrently. 68% of hard disk space unused
  • 6.
    Hard Disk UtilizationMore Efficient Hard Disk Utilization Total: 1323 GB Used: 418 GB Free: 905 GB (68% unused) SAN in 30GB chunks 1 fibre channel >1 server Virtual HDs more granular Share free space – allocate as needed Free (GB) Used (GB) Total (GB) Server Local Disk 34 170 68 34 68 68 68 17 34 136 17 68 34 34 68 68 48 7 88 6 13 10 11 16 6 6 56 9 31 24 7 13 9 8 27 Domain Controller 82 IIS document server 62 Machine Room environ 21 IIS: eLearning Prod 58 SQL: eLearning Prod IIS: eLearning dev SQL: eLearning dev Stat Version Control Stat Version Control File Servers Small use Citrix IIS / SQL:Research app PeopelSoft 8 FIN PeopleSoft 8 HE TNG Scheduling IIS app test SAN Manager 57 52 11 28 80 8 37 10 27 55 59 40
  • 7.
    Virtualization vs. ConsolidationVirtualized servers = separate OSes Consolidation = same OS Virtualized servers must each be administered, patched, etc. Consolidated applications can introduce conflicts and support issues
  • 8.
    Virtual Host LicensingWindows and other Microsoft per-server apps are licensed per virtual server. (1 physical server w/ 6 virtual Windows servers = 6-7 licenses needed) As of 4/1/2005, Microsoft per-processor licenses are per physical processor (1 physical server w/ 3 virtual SQL Servers sharing 1 CPU = 1 per-processor license) Virtualization savings are not in licenses. Check with other vendors.
  • 9.
    Virtualization Software MSVirtual PC 2004 – workstation only VMWare Workstation 5 – workstation only MS Virtual Server 2005, Standard (4p) MS Virtual Server 2005, Enterprise (32p) VMWare GSX Server 3.1 VMWare ESX Server 2.5
  • 10.
    Common Features Upto 3.6GB RAM per virtual host Web-based console for administration Host OS sees HT CPU, virtual do not VMs consist of 1 config file & 1 file / HD VMs can mount physical CDs or ISOs VMs can be multi-homed Up to 64 VMs per host server Highly scriptable – extensive API Granular permissions for individual VMs Detailed logging
  • 11.
    MS Virtual Server2005 Targeted to increase efficiency in testing and development, and “re-hosting” Up to 1 processor per virtual host Windows = underlying host OS Only Windows VM’s supported No USB support 2 processor SMP coming soon
  • 12.
    VMWare ESX Server2.5 Targeted at mission-critical enterprise services Up to 2 processors per host Custom Linux = underlying OS Windows & Linux VM’s supported Dedicated NIC for admin (2 total min) USB support 4 proc SMP coming soon
  • 13.
    Do I needto know Linux? VMWare ESX Server is based on Linux All administration is possible through web Don’t need any Linux experience for installation or ongoing admin SSH and SFTP access to server Used? Installed backup software sFTP’ed ISO’s to server
  • 14.
    Managing Virtual ServersWeb site is primary interface Attach to VM console Virtual Server = ActiveX control VMWare = separate application Reboot, power on, power off Create and manage VM’s Allocate hardware resources Mount CDs and floppies View recent performance data
  • 15.
  • 16.
  • 17.
    Hyper-threading One physicalCPU seen as 2 logical Both products see HT, non-HT VMs Slows virtualization performance 1 HT CPU < 2 Phy CPU 0-20% performance increase over no HT http://www.intel.com/technology/hyperthread/
  • 18.
    RAM Allocation VirtualServer: Max <= total physical memory VMWare: Max <> total physical RAM Ballooning RAM pooled across multiple VMs Enables more efficient RAM utilization If max out, goes to paging file
  • 19.
  • 20.
  • 21.
    Monitoring MOM (orother host monitoring): Monitors VMs like physical Virtual Server: MOM Management Pack Integrates into MOM framework Monitor overall host and VM servers VMWare: vmkusage VMWare: VirtualCenter Database back-end across all servers
  • 22.
    Virtual Center Centralmonitoring and management in VMWare environment Manage all VMs from one interface Additional software / license Management application Set thresholds and actions – like MOM SQL or Oracle DB backend Assign privileges via NTFS
  • 23.
  • 24.
    Converting Physical ServerBoth MS & VMWare offer tools to create virtual systems from physical Physical HW drivers replaced by VM Ideal for the truly unique server (highly customized) Both vendors recommend loading virtual servers from scratch Slow for both vendors – 6h / 4GB image VSMT (Virtual Server Migration Tool) many prereqs (DHCP, ADS, SQL) Not in one month eval P2V (Physical 2 Virtual) Simple boot CD and ‘server’ piece Licensed per use
  • 25.
    VMotion Enables seamlesstransition of live virtual host between physical servers Dynamic Resource Allocation across servers – respond to load changes HW maintenance
  • 26.
    Best Practices Planout server allocations Create “gold image” – base OS kept up-to-date patches – duplicate for new VMs Use ISO’s for CD access Use standard backup and restore Take system images as needed
  • 27.
    Summary of VMWaredifferences More comprehensive web GUI (for example, deleting hosts & HDs) Support for dual processor virtuals Support for Linux virtuals Virtual Center: central management Easy-to-use physical-to-virtual support VMotion: seamlessly move virtual servers between physical hosts
  • 28.
    Testing Environment Onemonth each was spent evaluating MS Virtual Server & VMWare ESX Server Identical testing was attempted on each. Load and usability testing: Win 2000, 2003, IIS5, IIS6, SQL Server 2000, 3 rd party apps Test hardware 1.4Ghz x 4 physical processors (8 w/ HT) 8GB of RAM 60GB fibre-channel connected SAN space
  • 29.
    Performance Comparisons Automatedload test of Aspen 2.5 dev environment (Win 2000/IIS5 & Win 2000/SQL 2000) Citrix / TS load test w/ Helpdesk IIS6-based memory, CPU, disk, and network I/O testing SQL Server add, update, and delete testing Load testing both as isolated server and with other virtual server processing ‘ Normal usage’ w/o issue in all cases
  • 30.
    Performance Comparisons Windows2003 IIS6 and SQL 2000 perf compare VMWare CPU : hyper-threaded related, ~93% w/o VS SQL : VS 2005 SP1 has performance enhancements 87% 57% 100% SQL 101% 101% 100% Disk&NIC I/O 91% 91% 100% Memory 80% 94% 100% CPU VMWare MSVS Physical
  • 31.
    Performance Comparisons Previousstats were isolated tests VMs won’t be alone on physical host How does system perform w/ other VMs running assorted, intensive tasks? - <5% - <5% Disk - <5% Same Same VMWare ESX Server - <5% -/+ <10% -/+ <10% Virtual Server 2005 Network CPU RAM
  • 32.
    IIS/SQL Load TestResults Mercury LoadRunner scripted test Overall performance 100@30/min: VM = 60% 1000@12/min: VM = 99% What made it slow? CPU queuing Memory, HD, NetIO – nearly identical
  • 33.
    Terminal Services /Citrix Load Test Results Currently 14 servers, 4procs (8HT), 4GB RAM –load balancing ~700 concurrent CPU and RAM intensive apps ~60 users max per physical server CPU = bottleneck (logon & BusObj) 1CPU = 7 users max ; 2 CPU = 12 max 100 v 1CPU or 58 v 2CPU to match 14 physicals Recommendation: 2 CPU & only for small use
  • 34.
    Business Objects WebIdev Virtualize? Yes. 900 / 1.4Ghz Win 2000 / IIS5 / 2400MB RAM / 1.4Ghz x 2 (no HT) Hours of Op sampling 24 x 7 sampling 1 136 4 44 3 86 4 47 StDev 1 52 2 759 2 55 2 755 Av 5 63 2 812 2 64 2 809 90% 6 65 11 814 3 65 4 813 95% 7 67 17 816 3 76 17 816 99% 22 85 32 821 52 487 19 823 99.9% 24 97 47 839 55 1548 45 839 99.99% 34 4324 61 847 112 4324 61 847 100% Proc % Usage HD KB /sec Nic KB /sec RAM (MB) Proc % Usage HD KB /sec Nic KB /sec RAM (MB)
  • 35.
    PSoft 8 FinCrystal/nVision: Dev Virtualize? Yes. 900 / 1.4Ghz Win 2000 / 2300MB RAM / 1.1Ghz x 2 (no HT) Hours of Op sampling 24 x 7 sampling 3 181 87 106 8 834 51 91 StDev 2 49 3 662 4 205 2 644 Av 2 32 3 799 2 61 3 786 90% 3 100 3 809 10 910 3 798 95% 13 1015 5 819 67 4802 4 814 99% 75 1494 72 822 82 4912 31 821 99.9% 92 1555 4542 829 89 5005 2973 822 99.99% 106 2529 5284 835 106 5038 5284 835 100% Proc % Usage HD KB /sec Nic KB /sec RAM (MB) Proc % Usage HD KB /sec Nic KB /sec RAM (MB)
  • 36.
    PSoft8 HE Crystal/nVision- Prod Virtualize? NOT at this time – CPU needs too high Win 2000 / 1500MB RAM / 2.8Ghz x 1 (w/ HT) Hours of Op sampling 24 x 7 sampling 6 159 109 63 7 356 162 67 StDev 21 49 7 363 23 105 10 378 Av 22 51 1 437 23 50 1 447 90% 32 74 11 440 34 183 8 483 95% 220 351 119 460 192 2304 119 534 99% 267 779 674 691 244 2440 1422 620 99.9% 333 3379 3493 713 329 3379 9803 710 99.99% 348 3421 9437 716 350 3421 11499 716 100% Proc % Usage HD KB /sec Nic KB /sec RAM (MB) Proc % Usage HD KB /sec Nic KB /sec RAM (MB)
  • 37.
    sumTotal Aspen 2.5eLearning Virtualize? Yes 2300MB / 1.4Ghz x 2 Note: high NIC=sync ; CPU=imp/exp Win 2000 / SQL 2000 / 2358MB RAM / 1.9Ghz x 2 (w/ HT) Hours of Op sampling 24 x 7 sampling 4 183 20 60 5 505 173 76 StDev 21 166 5 1636 24 236 16 1628 Av 30 459 3 1665 41 517 5 1670 90% 59 623 67 1684 101 839 68 1777 95% 125 827 70 2064 138 3626 91 1984 99% 138 971 206 2073 216 3673 2667 2073 99.9% 149 1039 404 2075 233 3682 5865 2075 99.99% 155 1047 406 2077 277 4477 9061 2077 100% Proc % Usage HD KB /sec Nic KB /sec RAM (MB) Proc % Usage HD KB /sec Nic KB /sec RAM (MB)
  • 38.
    Domain Controllers Virtualize?Yes – 850MB / 1.4Ghz Win 2003 / 2000MB RAM / 700Mhz x 4 (no HT) Hours of Op sampling 24 x 7 sampling 1 41 11 56 3 302 138 74 StDev 8 78 7 646 8 128 12 633 Av 10 88 20 707 10 91 15 707 90% 11 90 27 713 12 140 24 713 95% 13 180 42 753 43 1972 51 753 99% 16 194 93 757 78 3440 2131 768 99.9% 51 195 98 766 131 3674 5326 771 99.99% 92 1237 457 767 146 4298 5677 776 100% Proc % Usage HD KB /sec Nic KB /sec RAM (MB) Proc % Usage HD KB /sec Nic KB /sec RAM (MB)
  • 39.
    Univ of Michigan- Flint VMWare ESX Server Determining factor: Linux support & MS Virtual Server wasn’t available Several years of experience, starting with GSX, public web services, online teaching, real video server, internal file/print, 46v on 5 physical (15 on 1), <10% slower, Dell 2650’s & 4600’s, 2 proc, 12GB RAM
  • 40.
    NC State UniversityMS Virtual Server 2005 Determining factor: Cost PeopleSoft v8 Crystal/nVision app servers: 18 virtual servers, 7 physical servers, dual Xeon >2GB, physical v. virtual head-to-head, little difference in performance.
  • 41.
    Potential Uses fromPrevious Presentations NAP - Remediation Servers – “Big Red Button” for critical fix – assign additional resources Keynote - Reliability – one of pillars of Trustworthy Computing Boston U – Matt - NetReg peak usage first couple weeks of semester WSUS 3Ghz, 1GB RAM recommended – sitting idle most of time? Decrease dev system allocation in busy times
  • 42.
    Pricing MS VirtualServer 2005 (4CPU Server, 8GB RAM) Win 2003 Std: up to 4 processors, Ent: up to 32 VS Std: 4proc/4GB; Ent: 8proc/32GB 2003 Ent/Std: ~$500+~$500 = ~$1000 VMWare Server ESX (4CPU – other pricing scales) ESX: $4500/phy server + $945/yr support ESX+SMP+V-agents: $6000/phy server + $1764/yr support VMWare Add-ons VirtualCenter server: $3000 + $1050/yr P2V Starter kit (25): $2000 + $420/yr
  • 43.
    Cost / BenefitExample VMWare Server ESX $45K separate HW purchase price $29K + $2K/yr (ESX w/SMP): ~35% MS Virtual Server Std $33K separate HW purchase price $30K virtual HW + software: ~10% Note: In both cases, estimates are conservative
  • 44.
    Summary / take-awaysMore effective resource utilization and response to changing needs (5-15% to 60-70%) Virtual Server & VMWare = comparable performance, VMWare more isolated VMWare more feature-rich: SMP, VMotion, manage multiple servers VMWare costs more, but you can do more, virtualize more costly servers Both platforms have limits, active improvement
  • 45.
    Other Resources VMWare: www.vmware.com Virtual Server: www.microsoft.com/virtualserver/ Rapid App: www.rapidapp.com
  • 46.
    David Sweetman Universityof Michigan [email_address] Questions?