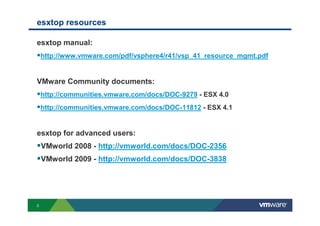
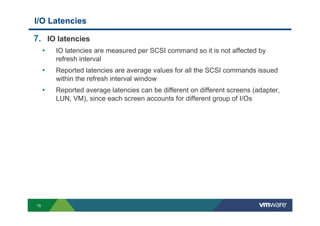
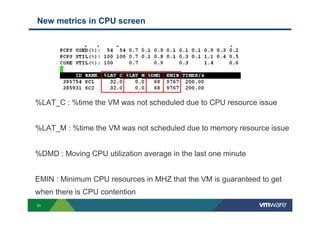
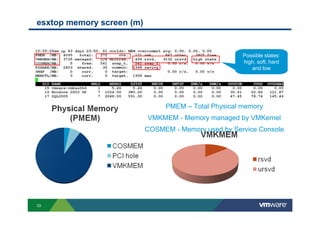
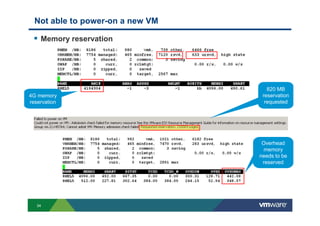
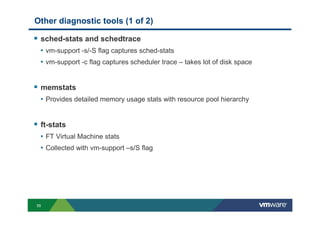
This document discusses using esxtop and resxtop tools to troubleshoot performance issues on VMware ESXi hosts. It provides 10 key things to know about esxtop counters and how they work. It then gives examples of using esxtop to troubleshoot common problems like CPU contention, memory issues, network throughput problems, and disk I/O latency. It also lists some other diagnostic tools that can be used along with esxtop.
Updated lifecycle management, improved analytics and support, and the option of Kubernetes — VMware vSphere® 7 is the biggest re-platform of vSphere in years. Learn more about the most significant vSphere evolution in a decade.
Learn more: http://ms.spr.ly/6005TmX9B
VMware ESXi - Intel and Qlogic NIC throughput difference v0.6David Pasek
We are observing different network throughputs on Intel X710 NICs and QLogic FastLinQ QL41xxx NIC. ESXi hardware supports NIC hardware offloading and queueing on 10Gb, 25Gb, 40Gb and 100Gb NIC adapters. Multiple hardware queues per NIC interface (vmnic) and multiple software threads on ESXi VMkernel is depicted and documented in this paper which may or may not be the root cause of the observed problem. The key objective of this document is to clearly document and collect NIC information on two specific Network Adapters and do a comparison to find the difference or at least root cause hypothesis for further troubleshooting.
E’ un’estensione di VMware vCenter che fornisce ai professionisti IT la possibilità di disaster recovery, migrazione di siti e funzionalità di test non distruttive.
VMworld 2013: Performance and Capacity Management of DRS Clusters VMworld
VMworld 2013
Anne Holler, VMware
Ganesha Shanmuganathan, VMware
Learn more about VMworld and register at http://www.vmworld.com/index.jspa?src=socmed-vmworld-slideshare
VMworld 2015: Extreme Performance Series - vSphere Compute & MemoryVMworld
In this session we'll dive deep into how the vSphere compute and memory schedulers work to provide the same level of performance as bare metal. Hosted by two outstanding performance engineers, they will review concepts like how and when vSphere schedules vCPUs, how virtual machines are idles, understand virtual machine memory overhead and how large memory pages help or hurt performance. If you want to understand what vSphere does at an atomic level you don't want to miss this advanced session.
Amazon EC2 provides a broad selection of instance types to accommodate a diverse mix of workloads. In this session, we provide an overview of the Amazon EC2 instance platform, key platform features, and the concept of instance generations. We dive into the current generation design choices of the different instance families, including General Purpose, Compute Optimized, Storage Optimized, Memory Optimized, and GPU instance. We also detail best practices and share performance tips for getting the most out of your Amazon EC2 instances.
Achieving the Ultimate Performance with KVMDevOps.com
Building and managing a cloud is not an easy task. It needs solid knowledge, proper planning and extensive experience in selecting the proper components and putting them together.
Many companies build new-age KVM clouds, only to find out that their applications & workloads do not perform well. Join this webinar to learn how to get the most out of your KVM cloud and how to optimize it for performance.
Join this webinar and learn:
Why performance matters and how to measure it properly?
What are the main components of an efficient new-age cloud?
How to select the right hardware?
How to optimize CPU and memory for ultimate performance?
Which network components work best?
How to tune the storage layer for performance?
VMworld 2013
Peter Boone, VMware
Seongbeom Kim, VMware
Learn more about VMworld and register at http://www.vmworld.com/index.jspa?src=socmed-vmworld-slideshare
Many companies build new-age KVM clouds, only to find out that their applications & workloads do not perform well. In this talk we’ll show you how to get the most out of your KVM cloud and how to optimize it for performance: You’ll understand why performance matters and how to measure it properly. We’ll teach you how to optimize CPU and memory for ultimate performance and how to tune the storage layer for performance. You’ll find out what are the main components of an efficient new-age cloud and which network components work best. In addition, you’ll learn how to select the right hardware to achieve unmatched performance for your new-age cloud and applications.
Venko Moyankov is an experienced system administrator and solutions architect at StorPool storage. He has experience with managing large virtualizations, working in telcos, designing and supporting the infrastructure of large enterprises. In the last year, his focus has been in helping companies globally to build the best storage solution according to their needs and projects.
Your Linux AMI: Optimization and Performance (CPN302) | AWS re:Invent 2013Amazon Web Services
Your AMI is one of the core foundations for running applications and services effectively on Amazon EC2. In this session, you'll learn how to optimize your AMI, including how you can measure and diagnose system performance and tune parameters for improved CPU and network performance. We'll cover application-specific examples from Netflix on how optimized AMIs can lead to improved performance.
VMworld 2013: Silent Killer: How Latency Destroys Performance...And What to D...VMworld
VMworld 2013
Bhavesh Davda, VMware
Josh Simons, VMware
Learn more about VMworld and register at http://www.vmworld.com/index.jspa?src=socmed-vmworld-slideshare
Goodbye Windows 11: Make Way for Nitrux Linux 3.5.0!SOFTTECHHUB
As the digital landscape continually evolves, operating systems play a critical role in shaping user experiences and productivity. The launch of Nitrux Linux 3.5.0 marks a significant milestone, offering a robust alternative to traditional systems such as Windows 11. This article delves into the essence of Nitrux Linux 3.5.0, exploring its unique features, advantages, and how it stands as a compelling choice for both casual users and tech enthusiasts.
Generative AI Deep Dive: Advancing from Proof of Concept to ProductionAggregage
Join Maher Hanafi, VP of Engineering at Betterworks, in this new session where he'll share a practical framework to transform Gen AI prototypes into impactful products! He'll delve into the complexities of data collection and management, model selection and optimization, and ensuring security, scalability, and responsible use.
Observability Concepts EVERY Developer Should Know -- DeveloperWeek Europe.pdfPaige Cruz
Monitoring and observability aren’t traditionally found in software curriculums and many of us cobble this knowledge together from whatever vendor or ecosystem we were first introduced to and whatever is a part of your current company’s observability stack.
While the dev and ops silo continues to crumble….many organizations still relegate monitoring & observability as the purview of ops, infra and SRE teams. This is a mistake - achieving a highly observable system requires collaboration up and down the stack.
I, a former op, would like to extend an invitation to all application developers to join the observability party will share these foundational concepts to build on:
Climate Impact of Software Testing at Nordic Testing DaysKari Kakkonen
My slides at Nordic Testing Days 6.6.2024
Climate impact / sustainability of software testing discussed on the talk. ICT and testing must carry their part of global responsibility to help with the climat warming. We can minimize the carbon footprint but we can also have a carbon handprint, a positive impact on the climate. Quality characteristics can be added with sustainability, and then measured continuously. Test environments can be used less, and in smaller scale and on demand. Test techniques can be used in optimizing or minimizing number of tests. Test automation can be used to speed up testing.
Pushing the limits of ePRTC: 100ns holdover for 100 daysAdtran
At WSTS 2024, Alon Stern explored the topic of parametric holdover and explained how recent research findings can be implemented in real-world PNT networks to achieve 100 nanoseconds of accuracy for up to 100 days.
In the rapidly evolving landscape of technologies, XML continues to play a vital role in structuring, storing, and transporting data across diverse systems. The recent advancements in artificial intelligence (AI) present new methodologies for enhancing XML development workflows, introducing efficiency, automation, and intelligent capabilities. This presentation will outline the scope and perspective of utilizing AI in XML development. The potential benefits and the possible pitfalls will be highlighted, providing a balanced view of the subject.
We will explore the capabilities of AI in understanding XML markup languages and autonomously creating structured XML content. Additionally, we will examine the capacity of AI to enrich plain text with appropriate XML markup. Practical examples and methodological guidelines will be provided to elucidate how AI can be effectively prompted to interpret and generate accurate XML markup.
Further emphasis will be placed on the role of AI in developing XSLT, or schemas such as XSD and Schematron. We will address the techniques and strategies adopted to create prompts for generating code, explaining code, or refactoring the code, and the results achieved.
The discussion will extend to how AI can be used to transform XML content. In particular, the focus will be on the use of AI XPath extension functions in XSLT, Schematron, Schematron Quick Fixes, or for XML content refactoring.
The presentation aims to deliver a comprehensive overview of AI usage in XML development, providing attendees with the necessary knowledge to make informed decisions. Whether you’re at the early stages of adopting AI or considering integrating it in advanced XML development, this presentation will cover all levels of expertise.
By highlighting the potential advantages and challenges of integrating AI with XML development tools and languages, the presentation seeks to inspire thoughtful conversation around the future of XML development. We’ll not only delve into the technical aspects of AI-powered XML development but also discuss practical implications and possible future directions.
Dr. Sean Tan, Head of Data Science, Changi Airport Group
Discover how Changi Airport Group (CAG) leverages graph technologies and generative AI to revolutionize their search capabilities. This session delves into the unique search needs of CAG’s diverse passengers and customers, showcasing how graph data structures enhance the accuracy and relevance of AI-generated search results, mitigating the risk of “hallucinations” and improving the overall customer journey.
Threats to mobile devices are more prevalent and increasing in scope and complexity. Users of mobile devices desire to take full advantage of the features
available on those devices, but many of the features provide convenience and capability but sacrifice security. This best practices guide outlines steps the users can take to better protect personal devices and information.
Unlocking Productivity: Leveraging the Potential of Copilot in Microsoft 365, a presentation by Christoforos Vlachos, Senior Solutions Manager – Modern Workplace, Uni Systems
Essentials of Automations: The Art of Triggers and Actions in FMESafe Software
In this second installment of our Essentials of Automations webinar series, we’ll explore the landscape of triggers and actions, guiding you through the nuances of authoring and adapting workspaces for seamless automations. Gain an understanding of the full spectrum of triggers and actions available in FME, empowering you to enhance your workspaces for efficient automation.
We’ll kick things off by showcasing the most commonly used event-based triggers, introducing you to various automation workflows like manual triggers, schedules, directory watchers, and more. Plus, see how these elements play out in real scenarios.
Whether you’re tweaking your current setup or building from the ground up, this session will arm you with the tools and insights needed to transform your FME usage into a powerhouse of productivity. Join us to discover effective strategies that simplify complex processes, enhancing your productivity and transforming your data management practices with FME. Let’s turn complexity into clarity and make your workspaces work wonders!
Why You Should Replace Windows 11 with Nitrux Linux 3.5.0 for enhanced perfor...SOFTTECHHUB
The choice of an operating system plays a pivotal role in shaping our computing experience. For decades, Microsoft's Windows has dominated the market, offering a familiar and widely adopted platform for personal and professional use. However, as technological advancements continue to push the boundaries of innovation, alternative operating systems have emerged, challenging the status quo and offering users a fresh perspective on computing.
One such alternative that has garnered significant attention and acclaim is Nitrux Linux 3.5.0, a sleek, powerful, and user-friendly Linux distribution that promises to redefine the way we interact with our devices. With its focus on performance, security, and customization, Nitrux Linux presents a compelling case for those seeking to break free from the constraints of proprietary software and embrace the freedom and flexibility of open-source computing.
UiPath Test Automation using UiPath Test Suite series, part 6DianaGray10
Welcome to UiPath Test Automation using UiPath Test Suite series part 6. In this session, we will cover Test Automation with generative AI and Open AI.
UiPath Test Automation with generative AI and Open AI webinar offers an in-depth exploration of leveraging cutting-edge technologies for test automation within the UiPath platform. Attendees will delve into the integration of generative AI, a test automation solution, with Open AI advanced natural language processing capabilities.
Throughout the session, participants will discover how this synergy empowers testers to automate repetitive tasks, enhance testing accuracy, and expedite the software testing life cycle. Topics covered include the seamless integration process, practical use cases, and the benefits of harnessing AI-driven automation for UiPath testing initiatives. By attending this webinar, testers, and automation professionals can gain valuable insights into harnessing the power of AI to optimize their test automation workflows within the UiPath ecosystem, ultimately driving efficiency and quality in software development processes.
What will you get from this session?
1. Insights into integrating generative AI.
2. Understanding how this integration enhances test automation within the UiPath platform
3. Practical demonstrations
4. Exploration of real-world use cases illustrating the benefits of AI-driven test automation for UiPath
Topics covered:
What is generative AI
Test Automation with generative AI and Open AI.
UiPath integration with generative AI
Speaker:
Deepak Rai, Automation Practice Lead, Boundaryless Group and UiPath MVP
Communications Mining Series - Zero to Hero - Session 1DianaGray10
This session provides introduction to UiPath Communication Mining, importance and platform overview. You will acquire a good understand of the phases in Communication Mining as we go over the platform with you. Topics covered:
• Communication Mining Overview
• Why is it important?
• How can it help today’s business and the benefits
• Phases in Communication Mining
• Demo on Platform overview
• Q/A
In his public lecture, Christian Timmerer provides insights into the fascinating history of video streaming, starting from its humble beginnings before YouTube to the groundbreaking technologies that now dominate platforms like Netflix and ORF ON. Timmerer also presents provocative contributions of his own that have significantly influenced the industry. He concludes by looking at future challenges and invites the audience to join in a discussion.
LF Energy Webinar: Electrical Grid Modelling and Simulation Through PowSyBl -...DanBrown980551
Do you want to learn how to model and simulate an electrical network from scratch in under an hour?
Then welcome to this PowSyBl workshop, hosted by Rte, the French Transmission System Operator (TSO)!
During the webinar, you will discover the PowSyBl ecosystem as well as handle and study an electrical network through an interactive Python notebook.
PowSyBl is an open source project hosted by LF Energy, which offers a comprehensive set of features for electrical grid modelling and simulation. Among other advanced features, PowSyBl provides:
- A fully editable and extendable library for grid component modelling;
- Visualization tools to display your network;
- Grid simulation tools, such as power flows, security analyses (with or without remedial actions) and sensitivity analyses;
The framework is mostly written in Java, with a Python binding so that Python developers can access PowSyBl functionalities as well.
What you will learn during the webinar:
- For beginners: discover PowSyBl's functionalities through a quick general presentation and the notebook, without needing any expert coding skills;
- For advanced developers: master the skills to efficiently apply PowSyBl functionalities to your real-world scenarios.
2. 2
Disclaimer
This session may contain product features that are
currently under development.
This session/overview of the new technology represents
no commitment from VMware to deliver these features in
any generally available product.
Features are subject to change, and must not be included in
contracts, purchase orders, or sales agreements of any kind.
Technical feasibility and market demand will affect final delivery.
Pricing and packaging for any new technologies or features
discussed or presented have not been determined.
“THESE FEATURES ARE REPRESENTATIVE OF FEATURE AREAS UNDER
DEVELOPMENT. FEATURE COMMITMENTS ARE SUBJECT TO CHANGE, AND
MUST NOT BE INCLUDED IN CONTRACTS, PURCHASE ORDERS, OR SALES
AGREEMENTS OF ANY KIND. TECHNICAL FEASIBILITY AND MARKET
DEMAND WILL AFFECT FINAL.”
5. 5
esxtop counters
1. esxtop does not create performance metrics
• esxtop derives performance metrics from raw counters exported in the
VMkernel System Info nodes (VSI nodes)
• esxtop can show new counters on older ESX system if the raw counters
are present in VMKernel
6. 6
esxtop counters
2. Counter values
• Many raw counters have static values that do no change with time – esxtop
displays them as it is
• Many counters increment monotonically, esxtop reports the delta for these
for the given refresh interval – for instance CMDS/sec, packets
transmitted/sec etc
• %USED and %RUN - CPU occupancy delta between successive
snapshots
7. 7
Refresh interval
3. Graphs will look different depending on the refresh interval
• Many counters values are dependent on refresh interval
• Larger refresh interval smoothens spikes and troughs
2 second refresh interval 10 second refresh interval
8. 8
esxtop counters
4. Counter normalization
• By default counters are shown for the group
• In group view counters values are cumulative
• In expanded view, counters are normalized per entity
Cumulative
stats
vcpu world
consumes CPU
Pressing ‘e’ key expands a group
9. 9
esxtop counters
5. %USED can exceed 100
• Turbo boost can increase the processor clock speed
• Asynchronous work can be happening on a different core on behalf of the
VM
VM on a NFS datastore running I/O intensive workload
10. 10
esxtop batch mode
6. Batch mode (-b)
• Produces windows perfmon compatible CSV file
• CSV file compatibility requires fixed number of columns on every row -
statistics of VMs/worlds instances that appear after starting the batch mode
are not collected because of this reason
• Only counters that are specified in the configuration file are collected, (-a)
option collects all counters
• Counters are named slightly differently
15. 15
I/O Latencies
7. IO latencies
• IO latencies are measured per SCSI command so it is not affected by
refresh interval
• Reported latencies are average values for all the SCSI commands issued
within the refresh interval window
• Reported average latencies can be different on different screens (adapter,
LUN, VM), since each screen accounts for different group of I/Os
16. 16
resxtop – remote esxtop
8. You can use resxtop to connect to different ESX hosts
• Newer version of resxtop will connect to older ESX hosts
9. You don’t need root access to view esxtop counters
• resxtop can authenticate using vCenter credentials
17. 17
esxtop CPU usage
10. esxtop can consume non-trivial amount of CPU
• When you have very large inventory (VMs, LUNs, virtual disks, virtual NICs
etc)
• You can limit the amount of data collected by limiting the fields (columns)
and entities (rows), you can also reduce CPU consumption by locking
entities, (-l) option
CPU consumption on a host with 512 VMs
CPU consumption with esxtop -l
CPU usage when using resxtop
19. 19
esxtop screens
Screens
• c: cpu (default)
• m: memory
• n: network
• d: disk adapter
• u: disk device (added in ESX 3.5)
• v: disk VM (added in ESX 3.5)
• i: Interrupts (new in ESX 4.0)
• p: power management (new in ESX
4.1)
VMkernel
CPU
Scheduler
Memory
Scheduler
Virtual
Switch
vSCSI
c, i, p m d, u, vn
VM VM VMVM
24. 24
Mis-configured SMP VM
vCPU 1 not
used by the
VM
Incorrect (UP) Kernel/HAL inside the
guest or the application inside the
guest is single threaded
25. 25
Power management – CPU frequency scaling
C states: C0 – busy, C1 – halted, C2 – deep halt
P states: P0 – Highest clock frequency, P11 – Lowest clock frequency
27. 27
CPU clock frequency scaling
%USED: CPU usage with reference to base clock frequency
%UTIL: CPU utilization with reference to current clock frequency
%RUN: CPU scheduled time
VM is running all
the time but uses
only 75% of the
clock frequency
28. 28
Hyperthreading
Two VMs running
on different cores
Two VMs sharing
the same core
%LAT_C counter
shows the time de-
scheduled due to
core sharing
31. 31
New metrics in CPU screen
%LAT_C : %time the VM was not scheduled due to CPU resource issue
%LAT_M : %time the VM was not scheduled due to memory resource issue
%DMD : Moving CPU utilization average in the last one minute
EMIN : Minimum CPU resources in MHZ that the VM is guaranteed to get
when there is CPU contention
33. 33
esxtop memory screen (m)
Possible states:
high, soft, hard
and low
PMEM – Total Physical memory
VMKMEM - Memory managed by VMKernel
COSMEM - Memory used by Service Console
34. 34
Not able to power-on a new VM
Memory reservation
820 MB
reservation
requested
Overhead
memory
needs to be
reserved
4G memory
reservation
35. 35
Granted Memory
Granted Memory = Memory touched by the guest
Windows and FreeBSD Guests touches (zeroes) all its memory during boot
Linux Guests touches memory when it first uses it
36. 36
Ballooning versus Swapping
MCTL: N - Balloon
driver not active, tools
probably not installed
Memory
Hog
VMs
Swapped in
the past but
not actively
swapping
now
Swap target is
more for the VM
without the balloon
driver
VM with
Balloon
driver swaps
less
37. 37
Memory Compression Stats
COWH : Copy on Write Pages hints – amount of memory in MB that are
potentially shareable
CACHESZ: Compression Cache size
CACHEUSD: Compression Cache currently used
ZIP/s, UNZIP/s: Memory compression/decompression rate
38. 38
Wide NUMA - CPU
2 NUMA
nodes with
~6G each
NUMA home
node not assigned
6-vcpu VM –
cannot fit into
a NUMA node
size of 4
CPUs
4G, can fit into
a single node
39. 39
NUMA affinity not set
NUMA machine
with 2 nodes
CPU affinity set to
wrong NUMA node
All the memory in
remote node
NHN: NUMA Home Node
NLMEM: Memory in local node
NRMEM: Memory in remote node
40. 40
Wide NUMA - Memory
2 NUMA
nodes with
~6G each
NUMA home
node not
assigned
VM cannot be
fit into a single
NUMA node
43. 43
Dropped packets at vSwitch
Packet drops usually happens when the traffic has
no flow control (UDP/Multicast/Broadcast packets)
44. 44
Multicast/Broadcast stats
PKTTXMUL/s – Multicast packets transmitted per second
PKTRXMUL/s – Multicast packets received per second
PKTTXBRD/s – Broadcast packets transmitted per second
PKTRXBRD/s – Broadcast packets received per second
45. 45
NFS stats
DAVG and KAVG is not available for network backed storage
GAVG – gives the end to end latency
47. 47
Disk I/O latency
Host bus adapters (HBAs) -
includes SCSI, iSCSI, RAID,
and FC-HBA adapters
Latency stats from the
Device, Kernel and the
Guest
DAVG/cmd - Average latency (ms) from the Device (LUN)
KAVG/cmd - Average latency (ms) in the VMKernel
GAVG/cmd - Average latency (ms) in the Guest
48. 48
Problem with the disk subsystem
Bad
throughput
Good
throughput
Device Latency is
high - cache disabled
Low device
Latency
51. 51
vStorage API for Array Integration (VAAI) stats
CLONE_RD, CLONE_WR: Number of Clone read/write requests
CLONE_F: Number of Failed clone operations
MBC_RD/s, MBC_WR/s – Clone read/write MBs/sec
ATS – Number of ATS commands
ATSF – Number of failed ATS commands
ZERO – Number of Zero requests
ZEROF – Number of failed zero requests
MBZERO/s – Megabytes Zeroed per second
52. 52
VAAI - virtual disk creation example
vStorage API for Array Integration (VAAI)
55. 55
Other diagnostic tools (1 of 2)
sched-stats and schedtrace
• vm-support -s/-S flag captures sched-stats
• vm-support -c flag captures scheduler trace – takes lot of disk space
memstats
• Provides detailed memory usage stats with resource pool hierarchy
ft-stats
• FT Virtual Machine stats
• Collected with vm-support –s/S flag
56. 56
Other diagnostic tools (2 of 2)
swatchStats
• Stopwatch stats for VMFS, SCSI events
vscsiStats
• Virtual machine SCSI disk I/O stats
• Provides histogram information for latency, IO size, inter-arrival time and
outstanding I/Os