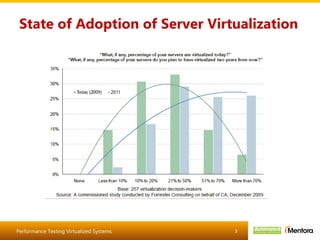
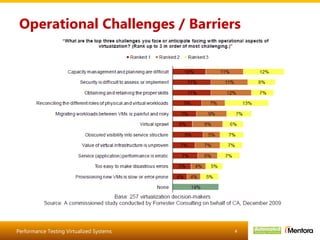
The document discusses server virtualization technologies and performance testing best practices. It provides details on:
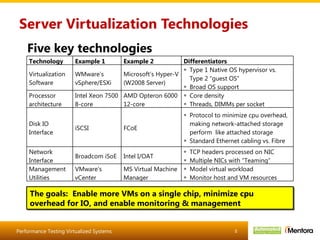
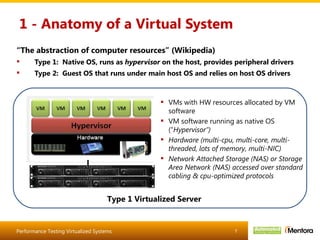
1) The anatomy of a virtual system including hardware virtualization, type 1 and type 2 hypervisors, and allocating VM resources.
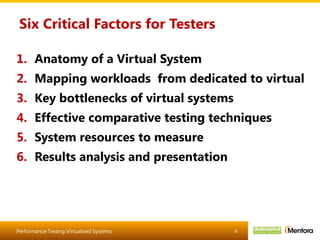
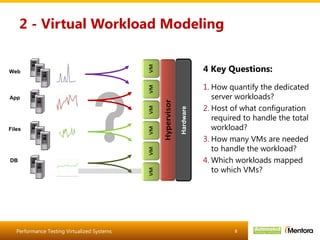
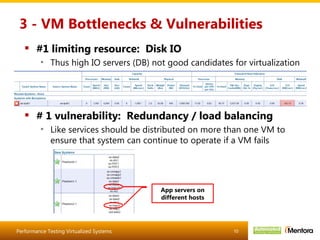
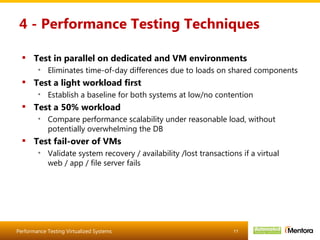
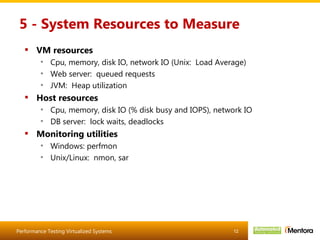
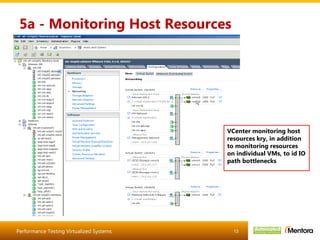
2) Key factors for performance testers including modeling virtual workloads, identifying bottlenecks, and effective testing techniques.
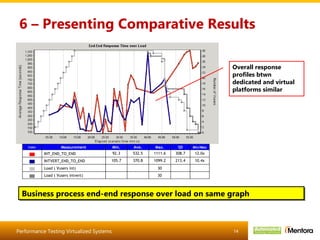
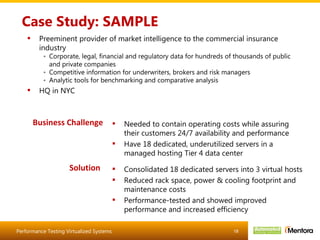
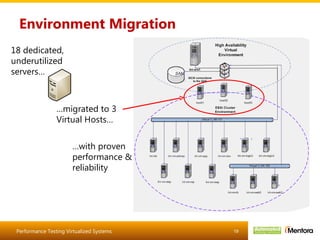
3) A case study where a company consolidated 18 servers onto 3 virtual hosts, reduced costs, and performance testing showed maintained or improved performance.


![[DSBW Spring 2009] Unit 05: Web Architectures](https://cdn.slidesharecdn.com/ss_thumbnails/unit05-architecture-090328141542-phpapp01-thumbnail.jpg?width=640&height=640&fit=bounds)


