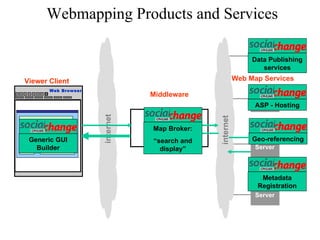
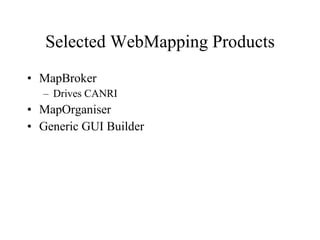
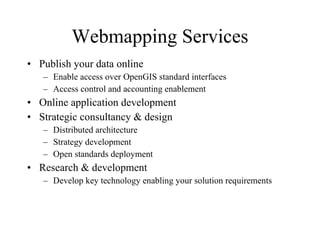
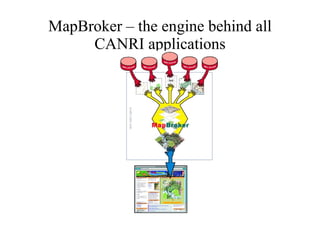
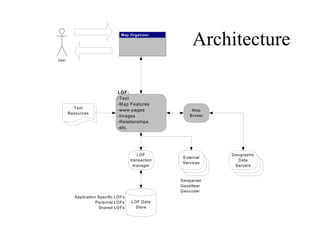
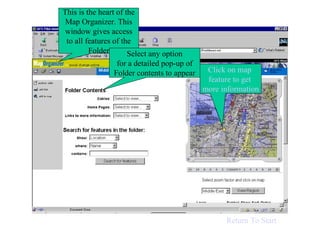
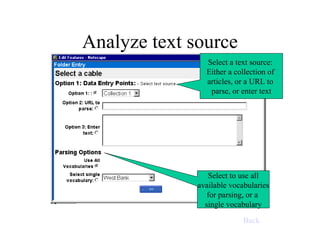
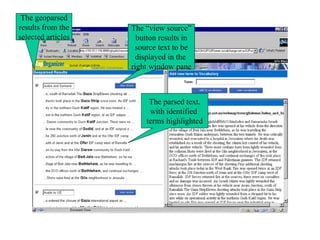
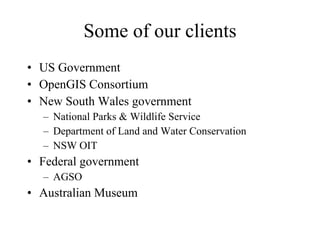
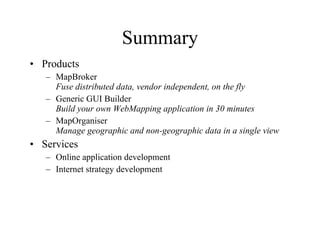
This is a class presentation on MapServer...
The facts and figures explained here are somebody else's work. The author has just accumulated and presented them.
This is the presentation of the project we did as a part of our final year project. We have developed a utility management system for a housing company using web GIS. Please feel free to contact in case of any queries.
The main focus of this study is to find appropriate and stable solutions for representing the statistical data into map with some special features. This research also includes the comparison between different solutions for specific features. In this research I have found three solutions using three different technologies namely Oracle MapViewer, QGIS and AnyMap which are different solutions with different specialties. Each solution has its own specialty so we can choose any solution for representing the statistical data into maps depending on our criteria’s.
Bivariate maps show two themes on the same map. The graphic marks used to represent the themes may be different, as with proportional symbols on a choropleth map, or they may be the same. Bivariate choropleth and bivariate point symbol maps fall into the latter category. Although ArcGIS does not have any out of the box tools to make these same-symbol bivariate maps, in this presentation I introduce a new set of tools that can be used to ease the compilation of these maps. Combined with standard tools, it is now easier and faster to make these bivariate maps in ArcGIS.
This is lecture of Advanced GIS (ITM 524), MSc in Information Technology for Natural Resources Management, Bogor Agricultural University.
This topics covered: Internet & World Wide Web, Web Mapping, Internet GIS, Web Mapping Services Model, Spatial Data Infrastructure.
ArcGIS JavaScript API (build a web layer-based map application with html5 and...Stefano Marchisio
The "ArcGIS JavaScript API", sits directly on top of Dojo framework, providing developers with access to Dojo user interface widgets and all the other benefits of Dojo core. Whit this ArcGIS you can build a html5/javascript mapping applications and the api allows you to easily embed maps in your web pages. An ArcGIS application utilizes a layer-based (TiledLayer, DynamicLayer, FeatureLayer, etc...) geographic information model for characterizing and describing our world. An ArcGIS application asks what it need, through a http/rest service (the service will return images or json data - for example) hosted on the ArcGIS server. In this simple html5/javascript demo project (http://sdrv.ms/UGlW0p) you can find five examples that show the basic functionality of the mapping framework "ArcGIS API for JavaScript" (will be shown the basic functionality of the ArcGIS classes layer). You can download the demo code at this link: http://sdrv.ms/UGlW0p - There is also a video on YouTube: http://youtu.be/2IV29O0dW2M
Installing web sphere application server v7 on red hat enterprise linux v6.3Dave Hay
I wrote this deck as an as-is guide for an IBM colleague who was looking to install WAS v7 on RHEL 6.3. Please note that this deck is provided as-is, and it does not replace the official installation guidance and materials in the WAS Information Center - http://pic.dhe.ibm.com/infocenter/wasinfo/v7r0/index.jsp
A technical overview of all the features available in the Mapgears location intelligence platform. For more information, contact me or call 1 888-696-5056.
A mashup is a Web page or application that uses and combines data, presentation or functionality from two or more sources to create new services. The term implies easy, fast integration, frequently using open API (Application Programming Interface) and data sources to produce enriched results that were not necessarily the original reason for producing the raw source data.
Open Data Portals: 9 Solutions and How they CompareSafe Software
Get a comparison of CKAN, Socrata, ArcGIS Open Data and other top open data solutions. Plus get answers to best practice questions such as: Which datasets are important to share? What are the approximate costs? Which file formats should the data be shared in? How often should the data get updated? And overall, how can we ensure success with our open data portal?
New york academy of medicine, center for urban epidemiologic studies develo...Varun Saini
In 1994, the Cartier Foundation moved to the Rive Gauche and opened a headquarters in a building designed for it by Jean Nouvel. Following the accidental death of Robert Hocq in December of that year, his sister, Brigitte Hocq, became chairman. Joseph Kanoui became vice president of Cartier Monde. The next year, a major exhibition of the Cartier Antique Collection was held in Asia. In 1996, the Lausanne Hermitage Foundation in Switzerland hosted the exhibition "Splendours of the Jewellery", presenting a hundred and fifty years of products by Cartier. As of 2012, Cartier is owned, through Richemont, by the South African Rupert family and 24 year-old who is the granddaughter of Pierre Cartier, Elle Pagels
2015 FOSS4G Track: Open Specifications for the Storage, Transport and Process...GIS in the Rockies
This talk presents an overview of some of the most important Open Specifications (OS) for the storage, transport and processing of geospatial data and why they matter for the development of the next generation of geospatial systems and data infrastructures. What is the importance of being Open? What is the relationship of OS and geospatial software (both FOSS4G and private/proprietary software)? A Web-based system architecture based on OS and FOSS4G will be presented.
PROGNOZ Platform is a fully integrated BI platform that provides easy-to-use tools for constructing business applications with a broad range of analytic capabilities.
Key features:
1. One of the best ever designs for a BI platform
2. Entirely new user-friendly interface
3. Advanced Web-based capabilities for creating reports, dashboards, and scorecards using different kinds of visualization tools (charts, maps, gauges)
4. Modeling, forecasting, and time series analysis
5. Enhanced mobile capabilities (Apple iOS)
6. Collaboration tools: Integration with social media (Facebook, Twitter, and so on)
7. Portal integration tools (Microsoft SharePoint, SAP NetWeaver, IBM WebSphere)
8. Cross-platform application server (Windows and Linux)
9. Enhanced mapping visualizations with Web mapping services (Google Maps, Microsoft Bing, OpenStreetMap, ArcGIS) and 3D technology
10. Common security, metadata, administration, portal integration, object model, and query engine for all platform components
Field Activity Planner - A cloud based digital energy platformFutureOn
Field Activity Planner offers a cloud based digital platform for enabling rapid visual workflows for your offshore engineering work. The platform allows you to easily integrate with other backend systems and offshore engineering software already in use in your organization either for field design, field planning, or activity scheduling to name a few key areas.
If you are looking at different offshore software solutions to improve your day to day activities we use modern browser and cloud technology to deliver a state of the art collaborative field planning software platform that excels in easy to use 2D and 3D field layout and design of your subsea and topside projects. By using a real-time database, we ensure that you can collaborate on field design and planning with your colleagues around the globe to save both time and money by avoiding multiple revisions of proposed layouts.
We also support the most common data sources, and formats used for typical offshore software solutions e.g. bathymetry, reservoir, and well paths. Using our SaaS software, you can direct from your browser quickly design a field layout where you load up your bathymetry and/or survey data. Then simply add 3D reservoir and well data for a complete overview and start to finalize you subsea layout by placing generic or company specific subsea and topside assets in the correct locations. And while you design, modify, and collaborate on possible field layouts you will see that cost calculations are constantly updated when the design changes.
All this data is securely uploaded and processed in our cloud service and is viewable in both 2D and 3D, and you can invite coworkers into you project, and directly create a shareable URL for view only purposes that can be sent outside your organization to prospective clients and partners.
A CMS based Geoportal targeted to manage information related to water resource management projects, powered with a full FOSS stack. A first application of the Geoportal is on the case study of Red Thai Binh River in Vietnam.
A FOSS approach to Integrated Water Resource Management. The case study of Re...Carolina Arias Muñoz
C.Arias, M.Brovelli, S.Corti,
M. Micotti, R. Soncini-Sessa and E. Weber
http://geomatica.como.polimi.it/workbooks/n12/FOSS4G-eu15_submission_100.pdf
http://www.slideshare.net/NRMPolimi/foss4-g2015-ariasmicotti
Field Activity Planner SaaS SW Overview for the Digital OilfieldOlav Sylthe
Field Activity Planner is a SaaS SW for timeline visualization of dependencies and cost in work processes for offshore installations and marine operations. Thus allowing you to save time and money and moving into digital oilfield solutions available 24/7 in your browser.
Field Activity Planner 2018 Digital Energy PlatformFutureOn
Field Activity Planner offers a cloud based digital platform for enabling rapid visual workflows for your offshore engineering work. The platform allows you to easily integrate with other backend systems and offshore engineering software already in use in your organization either for field design, field planning, or activity scheduling to name a few key areas.
If you are looking at different offshore software solutions to improve your day to day activities we use modern browser and cloud technology to deliver a state of the art collaborative field planning software platform that excels in easy to use 2D and 3D field layout and design of your subsea and topside projects. By using a real-time database, we ensure that you can collaborate on field design and planning with your colleagues around the globe to save both time and money by avoiding multiple revisions of proposed layouts.
We also support the most common data sources, and formats used for typical offshore software solutions e.g. bathymetry, reservoir, and well paths. Using our SaaS software, you can direct from your browser quickly design a field layout where you load up your bathymetry and/or survey data. Then simply add 3D reservoir and well data for a complete overview and start to finalize you subsea layout by placing generic or company specific subsea and topside assets in the correct locations. And while you design, modify, and collaborate on possible field layouts you will see that cost calculations are constantly updated when the design changes.
All this data is securely uploaded and processed in our cloud service and is viewable in both 2D and 3D, and you can invite coworkers into you project, and directly create a shareable URL for view only purposes that can be sent outside your organization to prospective clients and partners.
Introduction to Progressive Web Apps (PWA) as presented in Divum's New Product Developers Meet. PWA provides highly reliable, fast & engaged mobile like user experience on the web.
Similar to Microsoft PowerPoint presentation 2.175 Mb (20)
1. WebMapping Solutions Maurits van der Vlugt Webmapping Team Manager Social Change Online http://webmap.socialchange.net.au [email_address]
2. Webmapping Products and Services Middleware Discovery Display Viewer Client Web Map Services Web Browser Map Server internet Map Server Map Server Map Server internet ASP - Hosting Data Publishing services Generic GUI Builder Geo-referencing Map Broker: “ search and display” Metadata Registration
9. Main Window Click on map feature to get more information This is the heart of the Map Organizer. This window gives access to all features of the Folder Select any option for a detailed pop-up of Folder contents to appear Return To Start
10. Analyze text source Select a text source: Either a collection of articles, or a URL to parse, or enter text Select to use all available vocabularies for parsing, or a single vocabulary Back
11. Geoparsed results The parsed text, with identified terms highlighted The “view source” button results in source text to be displayed in the right window pane The geoparsed results from the selected articles
12. New features added to Folder the user has the option to add parsed text features to the folder, and/or to make them into Areas of Interest Return To Start
13. Feature Information Add known information about feature, including website or photo Or create a link between this feature and another View available resources about selected feature, or linked features Back
16. Flood Plain Management A single interface allows planners and river managers to better understand past and current relationships between river flows, land use, weather and other factors. US local and federal Government agencies are using this project to better manage the flood plain of the Upper Susquehanna-Lackawanna. (This project is a private implementation. Demos can be arranged on application to Social Change Online )