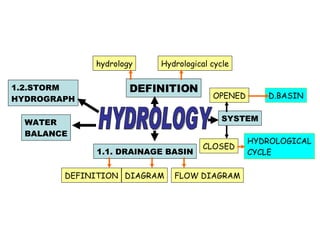
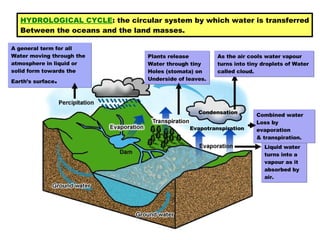
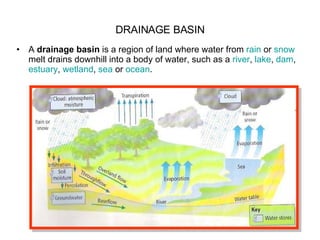
HYDROLOGY (L6) By Cg. Dk. Malia Pg. Hj. Damit. Geography Department
HYDROLOGY DEFINITION hydrology Hydrological cycle SYSTEM OPENED CLOSED D.BASIN HYDROLOGICAL CYCLE 1.1. DRAINAGE BASIN DEFINITION DIAGRAM FLOW DIAGRAM WATER  BALANCE 1.2.STORM  HYDROGRAPH
Evapotranspiration Condensation Liquid water turns into a vapour as it absorbed by air. Plants release Water through tiny  Holes (stomata) on  Underside of leaves. Combined water Loss by evaporation  & transpiration. A general term for all  Water moving through the atmosphere in liquid or solid form towards the Earth’s surface . HYDROLOGICAL CYCLE : the circular system by which water is transferred Between the oceans and the land masses.   As the air cools water vapour  turns into tiny droplets of Water  called cloud.
DRAINAGE BASIN A  drainage basin  is a region of land where water from  rain  or  snow  melt drains downhill into a body of water, such as a  river ,  lake ,  dam ,  estuary ,  wetland ,  sea  or  ocean .
Interception   : first raindrops of a rainfall event will fall on  vegetation.  Infiltration   : Water that reaches ground surface will soak into  soil. Overland flow   : water moving over the ground. Throughfall   : water that drip down leaf to leaf.  Percolation   : Some water sinks deep into the earth (percolates)  through openings in the soil.  Stemflow   : water that flow down tree thrunks or plant stems. Groundwater   : water transfer through permeable rocks from  the soil above. Baseflow   : water flows from groundwater stores to the stream Throughflow    : water moving through the soil. Surface run-off   :  water that flows over the land surface. TERMS
FLOW DIAGRAM THROUGH A DRAINAGE BASIN TRANSPIRATION INTERCEPTION SURFACE  STORAGE SOIL WATER STORAGE EVAPORATION GROUNDWATER STORAGE CHANNEL  STORAGE RIVER  RUNOFF VEGETATION STORAGE PERCIPITATION inputs storage outputs stemflow infiltration percolation baseflow throughflow Surface flow Channel flow
Interpreting a storm Hydrograph
Storm Hydrograph River discharge : amount of water originated as  precipitation which reaches the channel by surface  run-off, throughflow and baseflow. Hydrograph:  showing the discharge of a river at a  given point over a short period of time. Storm hydrograph : shows discharge of a river response to an individual rainfall event.
Storm Hydrograph. Approach segment:  discharge of a river before the storm (antecendent  flow rate), when storm begins river response is negligible some rain not  fall directly into channel, most fall elsewhere & take time to reach  channel. Rising limb : initial surface run-off occur, and throughflow reach river  rapid increase in discharge occur.  (the steeper the rising limb, faster response to rainfall i.e. water reach  the channel more quickly) Peak discharge (peak flow) occur when river reaches highest level.
Lag time:  the period between maximum precipitation & peak discharge. (river with shorter lag time had higher peak discharge more prone to  flooding)  Falling limb/recessing limb : segment of the graph where discharge is  decreasing and river level start to fall. (less steep than rising limb  because throughflow is being released slowly into channel) Storm flow : is the discharge, both surface and subsurface flow  attributed to a single storm. Baseflow : very slow respond to a storm, continually releasing ground  water, maintain river flow during periods of low precipitation. Bankfull discharge  occurs when the river’s water level reaches the top  of its channel; any increase in discharge will result in flooding of land.
PERMEABLE ROCK: Porous: e.g. sandstones & chalk (more pores able to fill up and store water) Pervious: carboniferous limestone (water flow along bedding planes & joints) although rocks impermeable. (both type of rock allow much infiltration thus little surface run off, low  surface streams) IMPERMEABLE ROCK: Granite do not allow water to infiltrate thus produce more surface  Streams. FACTORS INFLUENCING STORM HYDROGRAPH: (1) ROCK TYPES:
FACTORS INFLUENCING STORM HYDROGRAPH: (2) BASIN CHARACTERISTICS :  Basin shape : Elongated basin: less dramatic graph. (longer lag time & low peak flow) Circular basin: more dramatic graph. (shorter lag time & high peak flow) Water takes longer to reach the trunk  stream in a large, round basin than  in does in a small, narrow one.
FACTORS INFLUENCING STORM HYDROGRAPH: ( 2) BASIN CHARACTERISTICS:  Drainage density: (no of streams) Basin with high drainage density: more dramatic graph. (impermeable rocks and clay) –shorter lag time and higher peak) Basin with low drainage density: less dramatic graph. (permeable rocks and sand)-longer lag time and low peak flow. Areas of permeable rocks and soil allow  more infiltration and so less surface run off.
FACTORS INFLUENCING STORM HYDROGRAPH: ( 2) BASIN CHARACTERISTICS:  Relief: (a) Steeper long profile: more dramatic graph. (water reach river more quickly) (b) Gentle long profile: less dramatic graph. Where gradients are steep, water runs off faster,  reaches the river more quickly and causes a steep rising limb. Prolonged heavy rain causes more overland flow than light drizzly rain.
(3) PRECIPITATION: Prolonged rainfall: flooding most frequently occurs, ground saturated and overland flow occurs. Intense rainfall: high surface runoff producing rapid rise in river levels ( flash floods occur) (4) TEMPERATURE : Extreme temperature (very cold in winter & hot and dry in summer) increase surface run-off. Less surface run off if high rate of evaporation. (5) VEGETATION: Tropical rainforest intercepts 80 % rainfall, arable intercepts only 10%. Plant roots (trees) reduce throughflow by taking up water from soil. FACTORS INFLUENCING STORM HYDROGRAPH:
STORM HYDROGRAPH OF 2 RIVERS. GRASSLAND VS FORESTED. Grassland area: more dramatic (shorter lag time & high peak flow)-rapid run off. Forested area: less dramatic (longer lag time & low peak flow)-less rapid run off more rainfall intercept. vegetation intercepts precipitation and allows  evaporation to take place directly into the  atmosphere so reducing the amount of water  available for overland flow.
STORM HYDROGRAPH OF 2 RIVERS . URBANISATION: Increase flood risk, water can’t infiltrate through concrete &  tarmac & concrete, gutter /drains carry water more  quickly to nearest stream. (more run-off) (to solve problems-small streams either canalised or culverted)
WATER BALANCE. Water balance  shows the relationship between inputs and outputs of a drainage basin.  Precipitation = Q (run-off/discharge) + E (evaporation) +/- changes in  storage. Importance: A water balance can be used to help manage water supply and predict  where there may be water shortages. It is also used in  irrigation , flood  control and pollution control.  The water balance can be illustrated using a  water balance graph  which plots levels of precipitation  and  evapotranspiration  often on a monthly scale.
Water balance graph A: Soil moisture recharge B: Soil moisture utilisation C: Water surplus D: Water deficit
WATER BALANCE VARY OVER TIME SEASONAL NATURE PRECIPITATION 2.  SEASONAL REQUIREMENTS OF PLANTS, ANIMALS AND MAN (UPTAKE & ABSTRACTION WHICH CAN AFFECT STORES. (E.G. IRRIGATION, DAM, WELL ETC)

Presentation Hydrology

  • 1.
    HYDROLOGY (L6) ByCg. Dk. Malia Pg. Hj. Damit. Geography Department
  • 2.
    HYDROLOGY DEFINITION hydrologyHydrological cycle SYSTEM OPENED CLOSED D.BASIN HYDROLOGICAL CYCLE 1.1. DRAINAGE BASIN DEFINITION DIAGRAM FLOW DIAGRAM WATER BALANCE 1.2.STORM HYDROGRAPH
  • 3.
    Evapotranspiration Condensation Liquidwater turns into a vapour as it absorbed by air. Plants release Water through tiny Holes (stomata) on Underside of leaves. Combined water Loss by evaporation & transpiration. A general term for all Water moving through the atmosphere in liquid or solid form towards the Earth’s surface . HYDROLOGICAL CYCLE : the circular system by which water is transferred Between the oceans and the land masses. As the air cools water vapour turns into tiny droplets of Water called cloud.
  • 4.
    DRAINAGE BASIN A drainage basin is a region of land where water from rain or snow melt drains downhill into a body of water, such as a river , lake , dam , estuary , wetland , sea or ocean .
  • 5.
    Interception : first raindrops of a rainfall event will fall on vegetation. Infiltration : Water that reaches ground surface will soak into soil. Overland flow : water moving over the ground. Throughfall : water that drip down leaf to leaf. Percolation : Some water sinks deep into the earth (percolates) through openings in the soil. Stemflow : water that flow down tree thrunks or plant stems. Groundwater : water transfer through permeable rocks from the soil above. Baseflow : water flows from groundwater stores to the stream Throughflow : water moving through the soil. Surface run-off : water that flows over the land surface. TERMS
  • 6.
    FLOW DIAGRAM THROUGHA DRAINAGE BASIN TRANSPIRATION INTERCEPTION SURFACE STORAGE SOIL WATER STORAGE EVAPORATION GROUNDWATER STORAGE CHANNEL STORAGE RIVER RUNOFF VEGETATION STORAGE PERCIPITATION inputs storage outputs stemflow infiltration percolation baseflow throughflow Surface flow Channel flow
  • 7.
  • 8.
    Storm Hydrograph Riverdischarge : amount of water originated as precipitation which reaches the channel by surface run-off, throughflow and baseflow. Hydrograph: showing the discharge of a river at a given point over a short period of time. Storm hydrograph : shows discharge of a river response to an individual rainfall event.
  • 9.
    Storm Hydrograph. Approachsegment: discharge of a river before the storm (antecendent flow rate), when storm begins river response is negligible some rain not fall directly into channel, most fall elsewhere & take time to reach channel. Rising limb : initial surface run-off occur, and throughflow reach river rapid increase in discharge occur. (the steeper the rising limb, faster response to rainfall i.e. water reach the channel more quickly) Peak discharge (peak flow) occur when river reaches highest level.
  • 10.
    Lag time: the period between maximum precipitation & peak discharge. (river with shorter lag time had higher peak discharge more prone to flooding) Falling limb/recessing limb : segment of the graph where discharge is decreasing and river level start to fall. (less steep than rising limb because throughflow is being released slowly into channel) Storm flow : is the discharge, both surface and subsurface flow attributed to a single storm. Baseflow : very slow respond to a storm, continually releasing ground water, maintain river flow during periods of low precipitation. Bankfull discharge occurs when the river’s water level reaches the top of its channel; any increase in discharge will result in flooding of land.
  • 11.
    PERMEABLE ROCK: Porous:e.g. sandstones & chalk (more pores able to fill up and store water) Pervious: carboniferous limestone (water flow along bedding planes & joints) although rocks impermeable. (both type of rock allow much infiltration thus little surface run off, low surface streams) IMPERMEABLE ROCK: Granite do not allow water to infiltrate thus produce more surface Streams. FACTORS INFLUENCING STORM HYDROGRAPH: (1) ROCK TYPES:
  • 12.
    FACTORS INFLUENCING STORMHYDROGRAPH: (2) BASIN CHARACTERISTICS : Basin shape : Elongated basin: less dramatic graph. (longer lag time & low peak flow) Circular basin: more dramatic graph. (shorter lag time & high peak flow) Water takes longer to reach the trunk stream in a large, round basin than in does in a small, narrow one.
  • 13.
    FACTORS INFLUENCING STORMHYDROGRAPH: ( 2) BASIN CHARACTERISTICS: Drainage density: (no of streams) Basin with high drainage density: more dramatic graph. (impermeable rocks and clay) –shorter lag time and higher peak) Basin with low drainage density: less dramatic graph. (permeable rocks and sand)-longer lag time and low peak flow. Areas of permeable rocks and soil allow more infiltration and so less surface run off.
  • 14.
    FACTORS INFLUENCING STORMHYDROGRAPH: ( 2) BASIN CHARACTERISTICS: Relief: (a) Steeper long profile: more dramatic graph. (water reach river more quickly) (b) Gentle long profile: less dramatic graph. Where gradients are steep, water runs off faster, reaches the river more quickly and causes a steep rising limb. Prolonged heavy rain causes more overland flow than light drizzly rain.
  • 15.
    (3) PRECIPITATION: Prolongedrainfall: flooding most frequently occurs, ground saturated and overland flow occurs. Intense rainfall: high surface runoff producing rapid rise in river levels ( flash floods occur) (4) TEMPERATURE : Extreme temperature (very cold in winter & hot and dry in summer) increase surface run-off. Less surface run off if high rate of evaporation. (5) VEGETATION: Tropical rainforest intercepts 80 % rainfall, arable intercepts only 10%. Plant roots (trees) reduce throughflow by taking up water from soil. FACTORS INFLUENCING STORM HYDROGRAPH:
  • 16.
    STORM HYDROGRAPH OF2 RIVERS. GRASSLAND VS FORESTED. Grassland area: more dramatic (shorter lag time & high peak flow)-rapid run off. Forested area: less dramatic (longer lag time & low peak flow)-less rapid run off more rainfall intercept. vegetation intercepts precipitation and allows evaporation to take place directly into the atmosphere so reducing the amount of water available for overland flow.
  • 17.
    STORM HYDROGRAPH OF2 RIVERS . URBANISATION: Increase flood risk, water can’t infiltrate through concrete & tarmac & concrete, gutter /drains carry water more quickly to nearest stream. (more run-off) (to solve problems-small streams either canalised or culverted)
  • 18.
    WATER BALANCE. Waterbalance shows the relationship between inputs and outputs of a drainage basin. Precipitation = Q (run-off/discharge) + E (evaporation) +/- changes in storage. Importance: A water balance can be used to help manage water supply and predict where there may be water shortages. It is also used in irrigation , flood control and pollution control. The water balance can be illustrated using a water balance graph which plots levels of precipitation and evapotranspiration often on a monthly scale.
  • 19.
    Water balance graphA: Soil moisture recharge B: Soil moisture utilisation C: Water surplus D: Water deficit
  • 20.
    WATER BALANCE VARYOVER TIME SEASONAL NATURE PRECIPITATION 2. SEASONAL REQUIREMENTS OF PLANTS, ANIMALS AND MAN (UPTAKE & ABSTRACTION WHICH CAN AFFECT STORES. (E.G. IRRIGATION, DAM, WELL ETC)