Downloaded 4,722 times
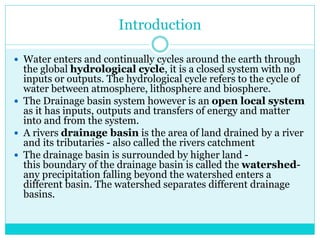
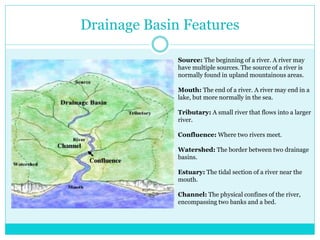

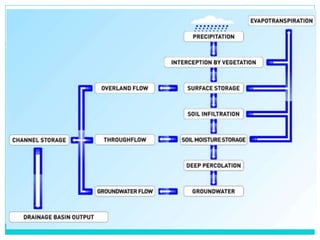


The document provides an overview of hydrology and fluvial geomorphology, emphasizing the hydrological cycle and the drainage basin system, which involves processes such as precipitation, evaporation, and river discharge. It details the characteristics of rivers from their source to mouth, discussing the erosion, transportation, and deposition that shape river channels and valleys. The document also explains factors affecting river discharge and hydrographs, including human impact and geological features.


