Downloaded 440 times


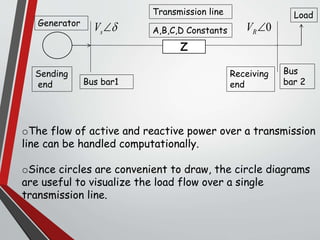
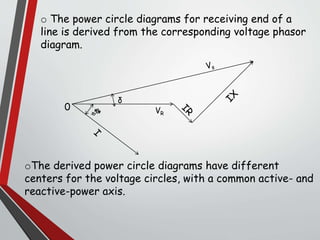
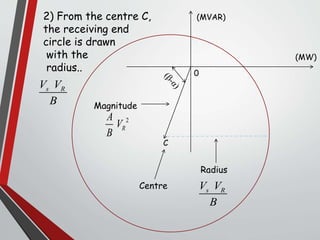
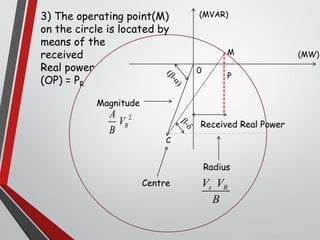
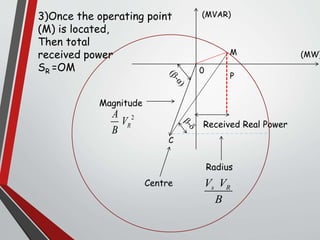


This document describes receiving end circle diagrams used to visualize load flow over a transmission line. It provides the following key points: 1) Receiving end circle diagrams are derived from voltage phasor diagrams and have different centers for the voltage circles, with a common active and reactive power axis. 2) They can be used to understand how an inductive or capacitive load will affect the reactive power supplied by the source. 3) The center of the receiving end circle is located based on the receiving end voltage magnitude and angle. The radius depends on the sending and receiving end voltage magnitudes. 4) The receiving end circle allows determining the total power received based on the operating point located from the known real power received