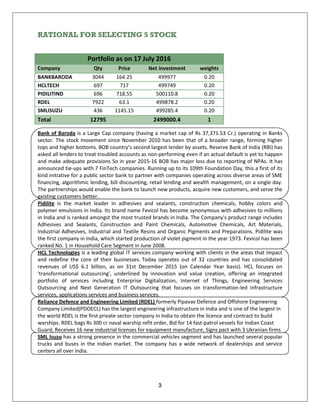
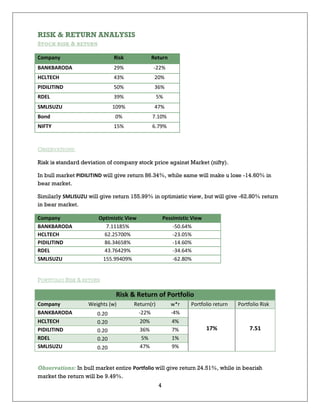
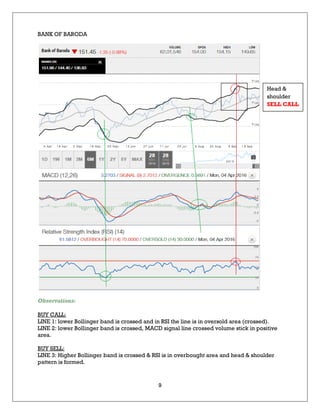
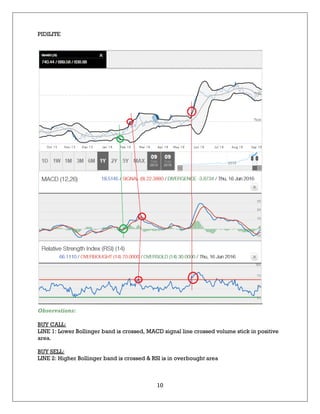
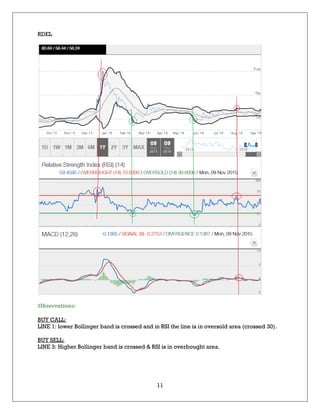
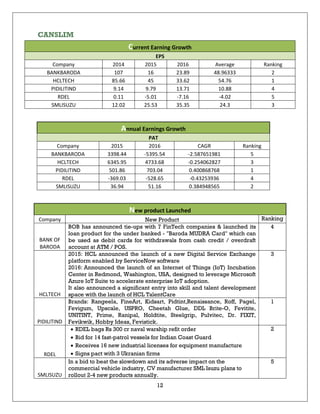
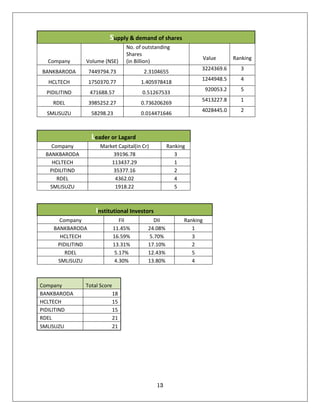
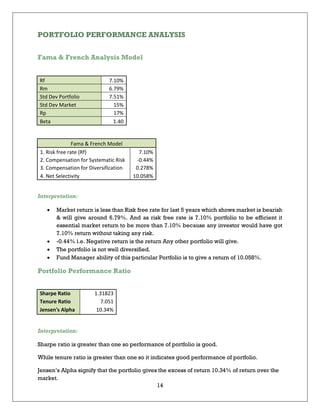
NAME:Varsha Chauhan
ROLL NO: 49
Security Analysis & portfolio
Management
2
Table of Contents
RATIONAL FOR SELECTING 5 STOCK................................................................................... 3
RISK & RETURN ANALYSIS..................................................................................................... 4
CML & SML ANALYSIS........................................................................................................... 5
CAPM ANALYSIS................................................................................................................... 6
TECHNICAL ANALYSIS ......................................................................................................... 7
CANSLIM ............................................................................................................................ 12
PORTFOLIO PERFORMANCE ANALYSIS.............................................................................. 14
Fama & French Analysis Model........................................................................................ 14
Portfolio Performance Ratio ............................................................................................. 14
3
RATIONAL FOR SELECTING 5 STOCK
Portfolio as on 17 July 2016
Company Qty Price Net investment weights
BANKBARODA 3044 164.25 499977 0.20
HCLTECH 697 717 499749 0.20
PIDILITIND 696 718.55 500110.8 0.20
RDEL 7922 63.1 499878.2 0.20
SMLISUZU 436 1145.15 499285.4 0.20
Total 12795 2499000.4 1
Bank of Baroda is a Large Cap company (having a market cap of Rs 37,371.53 Cr.) operating in Banks
sector. The stock movement since November 2010 has been that of a broader range, forming higher
tops and higher bottoms. BOB country’s second largest lender by assets. Reserve Bank of India (RBI) has
asked all lenders to treat troubled accounts as non-performing even if an actual default is yet to happen
and make adequate provisions So in year 2015-16 BOB has major loss due to reporting of NPAs. It has
announced tie-ups with 7 FinTech companies. Running up to its 109th Foundation Day, this a first of its
kind initiative for a public sector bank to partner with companies operating across diverse areas of SME
financing, algorithmic lending, bill discounting, retail lending and wealth management, on a single day.
The partnerships would enable the bank to launch new products, acquire new customers, and serve the
existing customers better.
Pidilite is the market leader in adhesives and sealants, construction chemicals, hobby colors and
polymer emulsions in India. Its brand name Fevicol has become synonymous with adhesives to millions
in India and is ranked amongst the most trusted brands in India. The Company's product range includes
Adhesives and Sealants, Construction and Paint Chemicals, Automotive Chemicals, Art Materials,
Industrial Adhesives, Industrial and Textile Resins and Organic Pigments and Preparations. Pidilite was
the first company in India, which started production of violet pigment in the year 1973. Fevicol has been
ranked No. 1 in Household Care Segment in June 2008.
HCL Technologies is a leading global IT services company working with clients in the areas that impact
and redefine the core of their businesses. Today operates out of 32 countries and has consolidated
revenues of US$ 6.1 billion, as on 31st December 2015 (on Calendar Year basis). HCL focuses on
'transformational outsourcing', underlined by innovation and value creation, offering an integrated
portfolio of services including Enterprise Digitalization, Internet of Things, Engineering Services
Outsourcing and Next Generation IT Outsourcing that focuses on transformation-led infrastructure
services, applications services and business services.
Reliance Defence and Engineering Limited (RDEL) formerly Pipavav Defence and Offshore Engineering
Company Limited(PDOECL) has the largest engineering infrastructure in India and is one of the largest in
the world RDEL is the first private sector company in India to obtain the licence and contract to build
warships. RDEL bags Rs 300 cr naval warship refit order, Bid for 14 fast-patrol vessels for Indian Coast
Guard, Receives 16 new industrial licenses for equipment manufacture, Signs pact with 3 Ukranian firms
SML Isuzu has a strong presence in the commercial vehicles segment and has launched several popular
trucks and buses in the Indian market. The company has a wide network of dealerships and service
centers all over India.
4
RISK & RETURN ANALYSIS
STOCK RISK & RETURN
Company Risk Return
BANKBARODA 29% -22%
HCLTECH 43% 20%
PIDILITIND 50% 36%
RDEL 39% 5%
SMLISUZU 109% 47%
Bond 0% 7.10%
NIFTY 15% 6.79%
OBSERVATIONS:
Risk is standard deviation of company stock price against Market (nifty).
In bull market PIDILITIND will give return 86.34%, while same will make u lose -14.60% in
bear market.
Similarly SMLISUZU will give return 155.99% in optimistic view, but will give -62.80% return
in bear market.
Company Optimistic View Pessimistic View
BANKBARODA 7.11185% -50.64%
HCLTECH 62.25700% -23.05%
PIDILITIND 86.34658% -14.60%
RDEL 43.76429% -34.64%
SMLISUZU 155.99409% -62.80%
PORTFOLIO RISK & RETURN
Risk & Return of Portfolio
Company Weights (w) Return(r) w*r Portfolio return Portfolio Risk
BANKBARODA 0.20 -22% -4%
17% 7.51
HCLTECH 0.20 20% 4%
PIDILITIND 0.20 36% 7%
RDEL 0.20 5% 1%
SMLISUZU 0.20 47% 9%
Observations: In bull market entire Portfolio will give return 24.51%, while in bearish
market the return will be 9.49%.
5
CML & SML ANALYSIS
Interpretation:
Market return is lower than Risk free rate over last 6 Years.
Stocks with high return & high Risk: Pidilite, SML isuzu, HCL technologies.
Stocks with high risk & Low Return: Reliance Defence and Engineering Ltd.
Bank of Baroda is very risky stock as it gives negative return over Last 6 years. Profits can be
made by holding it for short term.
Underpriced:
Pidilite,
SML Isuzu,
HCL
Technology.
BANKBARODA,
29%, -22%
HCLTECH, 43%,
20%
PIDILITIND, 50%,
36%
RDEL, 39%, 5%
SMLISUZU, 109%,
47%
NIIFTY, 15%,
6.79%
Rf, 0%, 7.103%
-30.00%
-25.00%
-20.00%
-15.00%
-10.00%
-5.00%
0.00%
5.00%
10.00%
15.00%
20.00%
25.00%
30.00%
35.00%
40.00%
45.00%
50.00%
55.00%
0% 20% 40% 60% 80% 100% 120%
Return
Risk
Capital Market Line
Q2: High risk,
high return
Q3: High risk,
Low return
Q4:
Low
risk,
Low
return
Rf, 0%, 7.10%
BANK OF
BARODA, -1.04,
-22%
HCL TECH,
0.28, 20%
PIDILITIND,
1.85, 36%
RDEL, 0.60, 5%
SML ISUZU,
6.72, 43%
NIFTY, 1.00,
6.79%
-30%
-25%
-20%
-15%
-10%
-5%
0%
5%
10%
15%
20%
25%
30%
35%
40%
45%
50%
55%
-1.50-1.00-0.50 0.00 0.50 1.00 1.50 2.00 2.50 3.00 3.50 4.00 4.50 5.00 5.50 6.00
RETURN
BETA
SECURITY MARKET LINE
Overprice
d
Underpriced
Overpriced:
RDEL
Bank of
baroda.
Technology.
Interpretation:
6
CAPM ANALYSIS
Company Weights Expected
Return
Beta Respective
Expected Return
Respective Beta
BANKBARODA 0.20 -22% -1.04 -4.35% -0.21
HCLTECH 0.20 20% 0.28 3.92% 0.06
PIDILITIND 0.20 36% 1.85 7.18% 0.37
RDEL 0.20 5% 0.60 0.91% 0.12
SMLISUZU 0.20 47% 5.33 9.31% 1.07
16.97% 1.40
Rf 7.10%
Beta 1.40
Rm 6.79%
Required Return 6.66%
Expected Return 16.97%
Alpha 10.30%
ALPHA:
Alpha is Excess of return over market as it takes in account the difference between Expected portfolio
return & required Portfolio Return.
Conclusion: Portfolio is advisable as it has positive alpha (i.e. Alpha = 10.30%) i.e. the 10.30% is excess
return over market.
7
TECHNICAL ANALYSIS
GREEN LINE: BUY CALL RED LINE: SELL CALL
SML ISUZU
DESCRIPTION:
Observations:
BUY CALL:
LINE 1: lower Bollinger band is crossed & RSI is in oversold area(crossed 30).(Jan16-feb16)
BUY SELL:
LINE 2: Higher Bollinger band is crossed & RSI is in overbought area.(May 16)
LINE 3: Higher Bollinger band is crossed & RSI is in overbought area.(July 16-Aug 16)
Head &
shoulder
SELL CALL
Double
Bottom
BUY CALL
8
HCL TECHNOLOGIES
Observations:
BUY CALL:
LINE 1: lower Bollinger band is crossed & MACD signal line crossed volume stick in positive
area.
LINE 2: lower Bollinger band is crossed, MACD signal line crossed volume stick in positive
area and in RSI the line is in oversold area (crossed 30).
BUY SELL:
LINE 3: Higher Bollinger band is crossed & RSI is in overbought area.
Reverse
Head &
Shoulder
BUY
CALL
9
BANK OF BARODA
Observations:
BUY CALL:
LINE 1: lower Bollinger band is crossed and in RSI the line is in oversold area (crossed).
LINE 2: lower Bollinger band is crossed, MACD signal line crossed volume stick in positive
area.
BUY SELL:
LINE 3: Higher Bollinger band is crossed & RSI is in overbought area and head & shoulder
pattern is formed.
Head &
shoulder
SELL CALL
10
PIDILITE
Observations:
BUY CALL:
LINE 1: Lower Bollinger band is crossed, MACD signal line crossed volume stick in positive
area.
BUY SELL:
LINE 2: Higher Bollinger band is crossed & RSI is in overbought area
11
RDEL
Observations:
BUY CALL:
LINE 1: lower Bollinger band is crossed and in RSI the line is in oversold area (crossed 30).
BUY SELL:
LINE 3: Higher Bollinger band is crossed & RSI is in overbought area.
12
CANSLIM
Current Earning Growth
EPS
Company 2014 2015 2016 Average Ranking
BANKBARODA 107 16 23.89 48.96333 2
HCLTECH 85.66 45 33.62 54.76 1
PIDILITIND 9.14 9.79 13.71 10.88 4
RDEL 0.11 -5.01 -7.16 -4.02 5
SMLISUZU 12.02 25.53 35.35 24.3 3
Annual Earnings Growth
PAT
Company 2015 2016 CAGR Ranking
BANKBARODA 3398.44 -5395.54 -2.587651981 5
HCLTECH 6345.95 4733.68 -0.254062827 3
PIDILITIND 501.86 703.04 0.400868768 1
RDEL -369.03 -528.65 -0.43253936 4
SMLISUZU 36.94 51.16 0.384948565 2
New product Launched
Company New Product Ranking
BANK OF
BARODA
BOB has announced tie-ups with 7 FinTech companies & launched its
loan product for the under banked - "Baroda MUDRA Card" which can
be used as debit cards for withdrawals from cash credit / overdraft
account at ATM / POS.
4
HCLTECH
2015: HCL announced the launch of a new Digital Service Exchange
platform enabled by ServiceNow software
2016: Announced the launch of an Internet of Things (IoT) Incubation
Center in Redmond, Washington, USA, designed to leverage Microsoft
Azure IoT Suite to accelerate enterprise IoT adoption.
It also announced a significant entry into skill and talent development
space with the launch of HCL TalentCare
3
PIDILITIND
Brands: Rangeela, FineArt, Kidsart, Pidtint,Renaissance, Roff, Pagel,
Fevigum, Upscale, USPRO, Cheetah Glue, DDL Brite-O, Fevitite,
UNITINT, Prime, Ranipal, Holdtite, Steelgrip, Pulvitec, Dr. FIXIT,
Fevikwik, Hobby Ideas, Fevistick.
1
RDEL
 RDEL bags Rs 300 cr naval warship refit order
 Bid for 14 fast-patrol vessels for Indian Coast Guard
 Receives 16 new industrial licenses for equipment manufacture
 Signs pact with 3 Ukranian firms
2
SMLISUZU
In a bid to beat the slowdown and its adverse impact on the
commercial vehicle industry, CV manufacturer SML Isuzu plans to
rollout 2-4 new products annually.
5
13
Supply & demand of shares
Company Volume (NSE)
No. of outstanding
Shares
(in Billion)
Value Ranking
BANKBARODA 7449794.73 2.3104655
3224369.6 3
HCLTECH 1750370.77 1.405978418
1244948.5 4
PIDILITIND 471688.57 0.51267533
920053.2 5
RDEL 3985252.27 0.736206269
5413227.8 1
SMLISUZU 58298.23 0.014471646
4028445.0 2
Leader or Lagard
Company Market Capital(in Cr) Ranking
BANKBARODA 39196.78 3
HCLTECH 113437.29 1
PIDILITIND 35377.16 2
RDEL 4362.02 4
SMLISUZU 1918.22 5
Institutional Investors
Company FII DII Ranking
BANKBARODA 11.45% 24.08% 1
HCLTECH 16.59% 5.70% 3
PIDILITIND 13.31% 17.10% 2
RDEL 5.17% 12.43% 5
SMLISUZU 4.30% 13.80% 4
Company Total Score
BANKBARODA 18
HCLTECH 15
PIDILITIND 15
RDEL 21
SMLISUZU 21
14
PORTFOLIO PERFORMANCE ANALYSIS
Fama & French Analysis Model
Rf 7.10%
Rm 6.79%
Std Dev Portfolio 7.51%
Std Dev Market 15%
Rp 17%
Beta 1.40
Fama & French Model
1. Risk free rate (Rf) 7.10%
2. Compensation for Systematic Risk -0.44%
3. Compensation for Diversification 0.278%
4. Net Selectivity 10.058%
Interpretation:
 Market return is less than Risk free rate for last 5 years which shows market is bearish
& will give around 6.79%. And as risk free rate is 7.10% portfolio to be efficient it
essential market return to be more than 7.10% because any investor would have got
7.10% return without taking any risk.
 -0.44% i.e. Negative return is the return Any other portfolio will give.
 The portfolio is not well diversified.
 Fund Manager ability of this particular Portfolio is to give a return of 10.058%.
Portfolio Performance Ratio
Sharpe Ratio 1.31823
Tenure Ratio 7.051
Jensen's Alpha 10.34%
Interpretation:
Sharpe ratio is greater than one so performance of portfolio is good.
While tenure ratio is greater than one so it indicates good performance of portfolio.
Jensen’s Alpha signify that the portfolio gives the excess of return 10.34% of return over the
market.

Security Analysis & portfolio Management

  • 1.
    NAME:Varsha Chauhan ROLL NO:49 Security Analysis & portfolio Management
  • 2.
    2 Table of Contents RATIONALFOR SELECTING 5 STOCK................................................................................... 3 RISK & RETURN ANALYSIS..................................................................................................... 4 CML & SML ANALYSIS........................................................................................................... 5 CAPM ANALYSIS................................................................................................................... 6 TECHNICAL ANALYSIS ......................................................................................................... 7 CANSLIM ............................................................................................................................ 12 PORTFOLIO PERFORMANCE ANALYSIS.............................................................................. 14 Fama & French Analysis Model........................................................................................ 14 Portfolio Performance Ratio ............................................................................................. 14
  • 3.
    3 RATIONAL FOR SELECTING5 STOCK Portfolio as on 17 July 2016 Company Qty Price Net investment weights BANKBARODA 3044 164.25 499977 0.20 HCLTECH 697 717 499749 0.20 PIDILITIND 696 718.55 500110.8 0.20 RDEL 7922 63.1 499878.2 0.20 SMLISUZU 436 1145.15 499285.4 0.20 Total 12795 2499000.4 1 Bank of Baroda is a Large Cap company (having a market cap of Rs 37,371.53 Cr.) operating in Banks sector. The stock movement since November 2010 has been that of a broader range, forming higher tops and higher bottoms. BOB country’s second largest lender by assets. Reserve Bank of India (RBI) has asked all lenders to treat troubled accounts as non-performing even if an actual default is yet to happen and make adequate provisions So in year 2015-16 BOB has major loss due to reporting of NPAs. It has announced tie-ups with 7 FinTech companies. Running up to its 109th Foundation Day, this a first of its kind initiative for a public sector bank to partner with companies operating across diverse areas of SME financing, algorithmic lending, bill discounting, retail lending and wealth management, on a single day. The partnerships would enable the bank to launch new products, acquire new customers, and serve the existing customers better. Pidilite is the market leader in adhesives and sealants, construction chemicals, hobby colors and polymer emulsions in India. Its brand name Fevicol has become synonymous with adhesives to millions in India and is ranked amongst the most trusted brands in India. The Company's product range includes Adhesives and Sealants, Construction and Paint Chemicals, Automotive Chemicals, Art Materials, Industrial Adhesives, Industrial and Textile Resins and Organic Pigments and Preparations. Pidilite was the first company in India, which started production of violet pigment in the year 1973. Fevicol has been ranked No. 1 in Household Care Segment in June 2008. HCL Technologies is a leading global IT services company working with clients in the areas that impact and redefine the core of their businesses. Today operates out of 32 countries and has consolidated revenues of US$ 6.1 billion, as on 31st December 2015 (on Calendar Year basis). HCL focuses on 'transformational outsourcing', underlined by innovation and value creation, offering an integrated portfolio of services including Enterprise Digitalization, Internet of Things, Engineering Services Outsourcing and Next Generation IT Outsourcing that focuses on transformation-led infrastructure services, applications services and business services. Reliance Defence and Engineering Limited (RDEL) formerly Pipavav Defence and Offshore Engineering Company Limited(PDOECL) has the largest engineering infrastructure in India and is one of the largest in the world RDEL is the first private sector company in India to obtain the licence and contract to build warships. RDEL bags Rs 300 cr naval warship refit order, Bid for 14 fast-patrol vessels for Indian Coast Guard, Receives 16 new industrial licenses for equipment manufacture, Signs pact with 3 Ukranian firms SML Isuzu has a strong presence in the commercial vehicles segment and has launched several popular trucks and buses in the Indian market. The company has a wide network of dealerships and service centers all over India.
  • 4.
    4 RISK & RETURNANALYSIS STOCK RISK & RETURN Company Risk Return BANKBARODA 29% -22% HCLTECH 43% 20% PIDILITIND 50% 36% RDEL 39% 5% SMLISUZU 109% 47% Bond 0% 7.10% NIFTY 15% 6.79% OBSERVATIONS: Risk is standard deviation of company stock price against Market (nifty). In bull market PIDILITIND will give return 86.34%, while same will make u lose -14.60% in bear market. Similarly SMLISUZU will give return 155.99% in optimistic view, but will give -62.80% return in bear market. Company Optimistic View Pessimistic View BANKBARODA 7.11185% -50.64% HCLTECH 62.25700% -23.05% PIDILITIND 86.34658% -14.60% RDEL 43.76429% -34.64% SMLISUZU 155.99409% -62.80% PORTFOLIO RISK & RETURN Risk & Return of Portfolio Company Weights (w) Return(r) w*r Portfolio return Portfolio Risk BANKBARODA 0.20 -22% -4% 17% 7.51 HCLTECH 0.20 20% 4% PIDILITIND 0.20 36% 7% RDEL 0.20 5% 1% SMLISUZU 0.20 47% 9% Observations: In bull market entire Portfolio will give return 24.51%, while in bearish market the return will be 9.49%.
  • 5.
    5 CML & SMLANALYSIS Interpretation: Market return is lower than Risk free rate over last 6 Years. Stocks with high return & high Risk: Pidilite, SML isuzu, HCL technologies. Stocks with high risk & Low Return: Reliance Defence and Engineering Ltd. Bank of Baroda is very risky stock as it gives negative return over Last 6 years. Profits can be made by holding it for short term. Underpriced: Pidilite, SML Isuzu, HCL Technology. BANKBARODA, 29%, -22% HCLTECH, 43%, 20% PIDILITIND, 50%, 36% RDEL, 39%, 5% SMLISUZU, 109%, 47% NIIFTY, 15%, 6.79% Rf, 0%, 7.103% -30.00% -25.00% -20.00% -15.00% -10.00% -5.00% 0.00% 5.00% 10.00% 15.00% 20.00% 25.00% 30.00% 35.00% 40.00% 45.00% 50.00% 55.00% 0% 20% 40% 60% 80% 100% 120% Return Risk Capital Market Line Q2: High risk, high return Q3: High risk, Low return Q4: Low risk, Low return Rf, 0%, 7.10% BANK OF BARODA, -1.04, -22% HCL TECH, 0.28, 20% PIDILITIND, 1.85, 36% RDEL, 0.60, 5% SML ISUZU, 6.72, 43% NIFTY, 1.00, 6.79% -30% -25% -20% -15% -10% -5% 0% 5% 10% 15% 20% 25% 30% 35% 40% 45% 50% 55% -1.50-1.00-0.50 0.00 0.50 1.00 1.50 2.00 2.50 3.00 3.50 4.00 4.50 5.00 5.50 6.00 RETURN BETA SECURITY MARKET LINE Overprice d Underpriced Overpriced: RDEL Bank of baroda. Technology. Interpretation:
  • 6.
    6 CAPM ANALYSIS Company WeightsExpected Return Beta Respective Expected Return Respective Beta BANKBARODA 0.20 -22% -1.04 -4.35% -0.21 HCLTECH 0.20 20% 0.28 3.92% 0.06 PIDILITIND 0.20 36% 1.85 7.18% 0.37 RDEL 0.20 5% 0.60 0.91% 0.12 SMLISUZU 0.20 47% 5.33 9.31% 1.07 16.97% 1.40 Rf 7.10% Beta 1.40 Rm 6.79% Required Return 6.66% Expected Return 16.97% Alpha 10.30% ALPHA: Alpha is Excess of return over market as it takes in account the difference between Expected portfolio return & required Portfolio Return. Conclusion: Portfolio is advisable as it has positive alpha (i.e. Alpha = 10.30%) i.e. the 10.30% is excess return over market.
  • 7.
    7 TECHNICAL ANALYSIS GREEN LINE:BUY CALL RED LINE: SELL CALL SML ISUZU DESCRIPTION: Observations: BUY CALL: LINE 1: lower Bollinger band is crossed & RSI is in oversold area(crossed 30).(Jan16-feb16) BUY SELL: LINE 2: Higher Bollinger band is crossed & RSI is in overbought area.(May 16) LINE 3: Higher Bollinger band is crossed & RSI is in overbought area.(July 16-Aug 16) Head & shoulder SELL CALL Double Bottom BUY CALL
  • 8.
    8 HCL TECHNOLOGIES Observations: BUY CALL: LINE1: lower Bollinger band is crossed & MACD signal line crossed volume stick in positive area. LINE 2: lower Bollinger band is crossed, MACD signal line crossed volume stick in positive area and in RSI the line is in oversold area (crossed 30). BUY SELL: LINE 3: Higher Bollinger band is crossed & RSI is in overbought area. Reverse Head & Shoulder BUY CALL
  • 9.
    9 BANK OF BARODA Observations: BUYCALL: LINE 1: lower Bollinger band is crossed and in RSI the line is in oversold area (crossed). LINE 2: lower Bollinger band is crossed, MACD signal line crossed volume stick in positive area. BUY SELL: LINE 3: Higher Bollinger band is crossed & RSI is in overbought area and head & shoulder pattern is formed. Head & shoulder SELL CALL
  • 10.
    10 PIDILITE Observations: BUY CALL: LINE 1:Lower Bollinger band is crossed, MACD signal line crossed volume stick in positive area. BUY SELL: LINE 2: Higher Bollinger band is crossed & RSI is in overbought area
  • 11.
    11 RDEL Observations: BUY CALL: LINE 1:lower Bollinger band is crossed and in RSI the line is in oversold area (crossed 30). BUY SELL: LINE 3: Higher Bollinger band is crossed & RSI is in overbought area.
  • 12.
    12 CANSLIM Current Earning Growth EPS Company2014 2015 2016 Average Ranking BANKBARODA 107 16 23.89 48.96333 2 HCLTECH 85.66 45 33.62 54.76 1 PIDILITIND 9.14 9.79 13.71 10.88 4 RDEL 0.11 -5.01 -7.16 -4.02 5 SMLISUZU 12.02 25.53 35.35 24.3 3 Annual Earnings Growth PAT Company 2015 2016 CAGR Ranking BANKBARODA 3398.44 -5395.54 -2.587651981 5 HCLTECH 6345.95 4733.68 -0.254062827 3 PIDILITIND 501.86 703.04 0.400868768 1 RDEL -369.03 -528.65 -0.43253936 4 SMLISUZU 36.94 51.16 0.384948565 2 New product Launched Company New Product Ranking BANK OF BARODA BOB has announced tie-ups with 7 FinTech companies & launched its loan product for the under banked - "Baroda MUDRA Card" which can be used as debit cards for withdrawals from cash credit / overdraft account at ATM / POS. 4 HCLTECH 2015: HCL announced the launch of a new Digital Service Exchange platform enabled by ServiceNow software 2016: Announced the launch of an Internet of Things (IoT) Incubation Center in Redmond, Washington, USA, designed to leverage Microsoft Azure IoT Suite to accelerate enterprise IoT adoption. It also announced a significant entry into skill and talent development space with the launch of HCL TalentCare 3 PIDILITIND Brands: Rangeela, FineArt, Kidsart, Pidtint,Renaissance, Roff, Pagel, Fevigum, Upscale, USPRO, Cheetah Glue, DDL Brite-O, Fevitite, UNITINT, Prime, Ranipal, Holdtite, Steelgrip, Pulvitec, Dr. FIXIT, Fevikwik, Hobby Ideas, Fevistick. 1 RDEL  RDEL bags Rs 300 cr naval warship refit order  Bid for 14 fast-patrol vessels for Indian Coast Guard  Receives 16 new industrial licenses for equipment manufacture  Signs pact with 3 Ukranian firms 2 SMLISUZU In a bid to beat the slowdown and its adverse impact on the commercial vehicle industry, CV manufacturer SML Isuzu plans to rollout 2-4 new products annually. 5
  • 13.
    13 Supply & demandof shares Company Volume (NSE) No. of outstanding Shares (in Billion) Value Ranking BANKBARODA 7449794.73 2.3104655 3224369.6 3 HCLTECH 1750370.77 1.405978418 1244948.5 4 PIDILITIND 471688.57 0.51267533 920053.2 5 RDEL 3985252.27 0.736206269 5413227.8 1 SMLISUZU 58298.23 0.014471646 4028445.0 2 Leader or Lagard Company Market Capital(in Cr) Ranking BANKBARODA 39196.78 3 HCLTECH 113437.29 1 PIDILITIND 35377.16 2 RDEL 4362.02 4 SMLISUZU 1918.22 5 Institutional Investors Company FII DII Ranking BANKBARODA 11.45% 24.08% 1 HCLTECH 16.59% 5.70% 3 PIDILITIND 13.31% 17.10% 2 RDEL 5.17% 12.43% 5 SMLISUZU 4.30% 13.80% 4 Company Total Score BANKBARODA 18 HCLTECH 15 PIDILITIND 15 RDEL 21 SMLISUZU 21
  • 14.
    14 PORTFOLIO PERFORMANCE ANALYSIS Fama& French Analysis Model Rf 7.10% Rm 6.79% Std Dev Portfolio 7.51% Std Dev Market 15% Rp 17% Beta 1.40 Fama & French Model 1. Risk free rate (Rf) 7.10% 2. Compensation for Systematic Risk -0.44% 3. Compensation for Diversification 0.278% 4. Net Selectivity 10.058% Interpretation:  Market return is less than Risk free rate for last 5 years which shows market is bearish & will give around 6.79%. And as risk free rate is 7.10% portfolio to be efficient it essential market return to be more than 7.10% because any investor would have got 7.10% return without taking any risk.  -0.44% i.e. Negative return is the return Any other portfolio will give.  The portfolio is not well diversified.  Fund Manager ability of this particular Portfolio is to give a return of 10.058%. Portfolio Performance Ratio Sharpe Ratio 1.31823 Tenure Ratio 7.051 Jensen's Alpha 10.34% Interpretation: Sharpe ratio is greater than one so performance of portfolio is good. While tenure ratio is greater than one so it indicates good performance of portfolio. Jensen’s Alpha signify that the portfolio gives the excess of return 10.34% of return over the market.