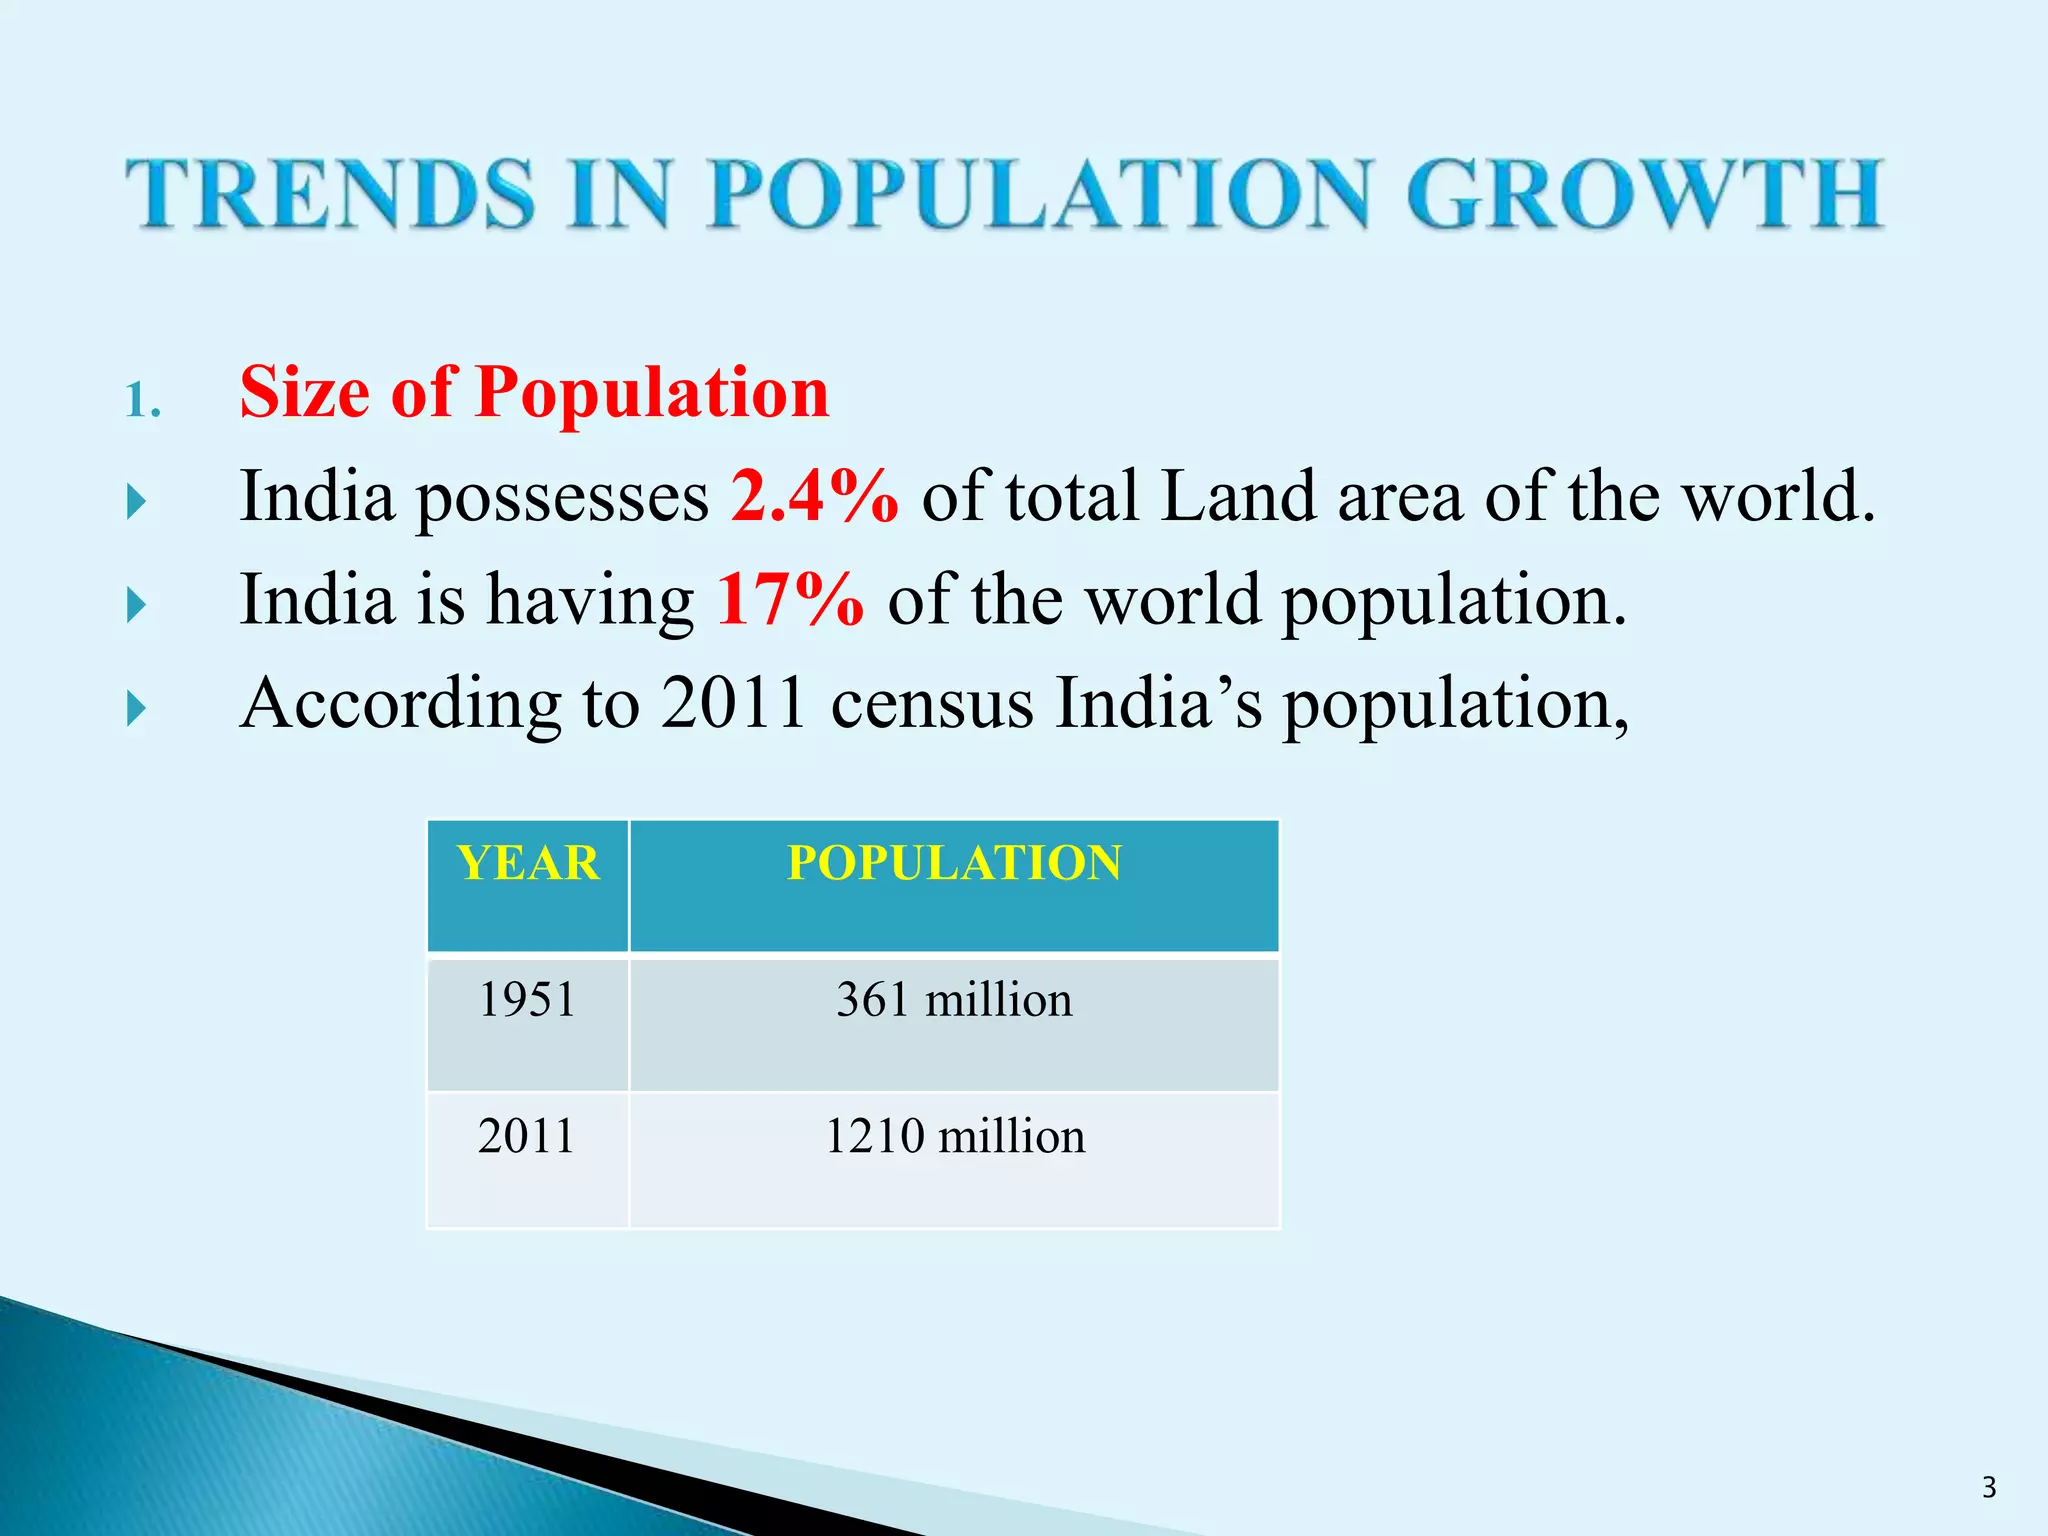
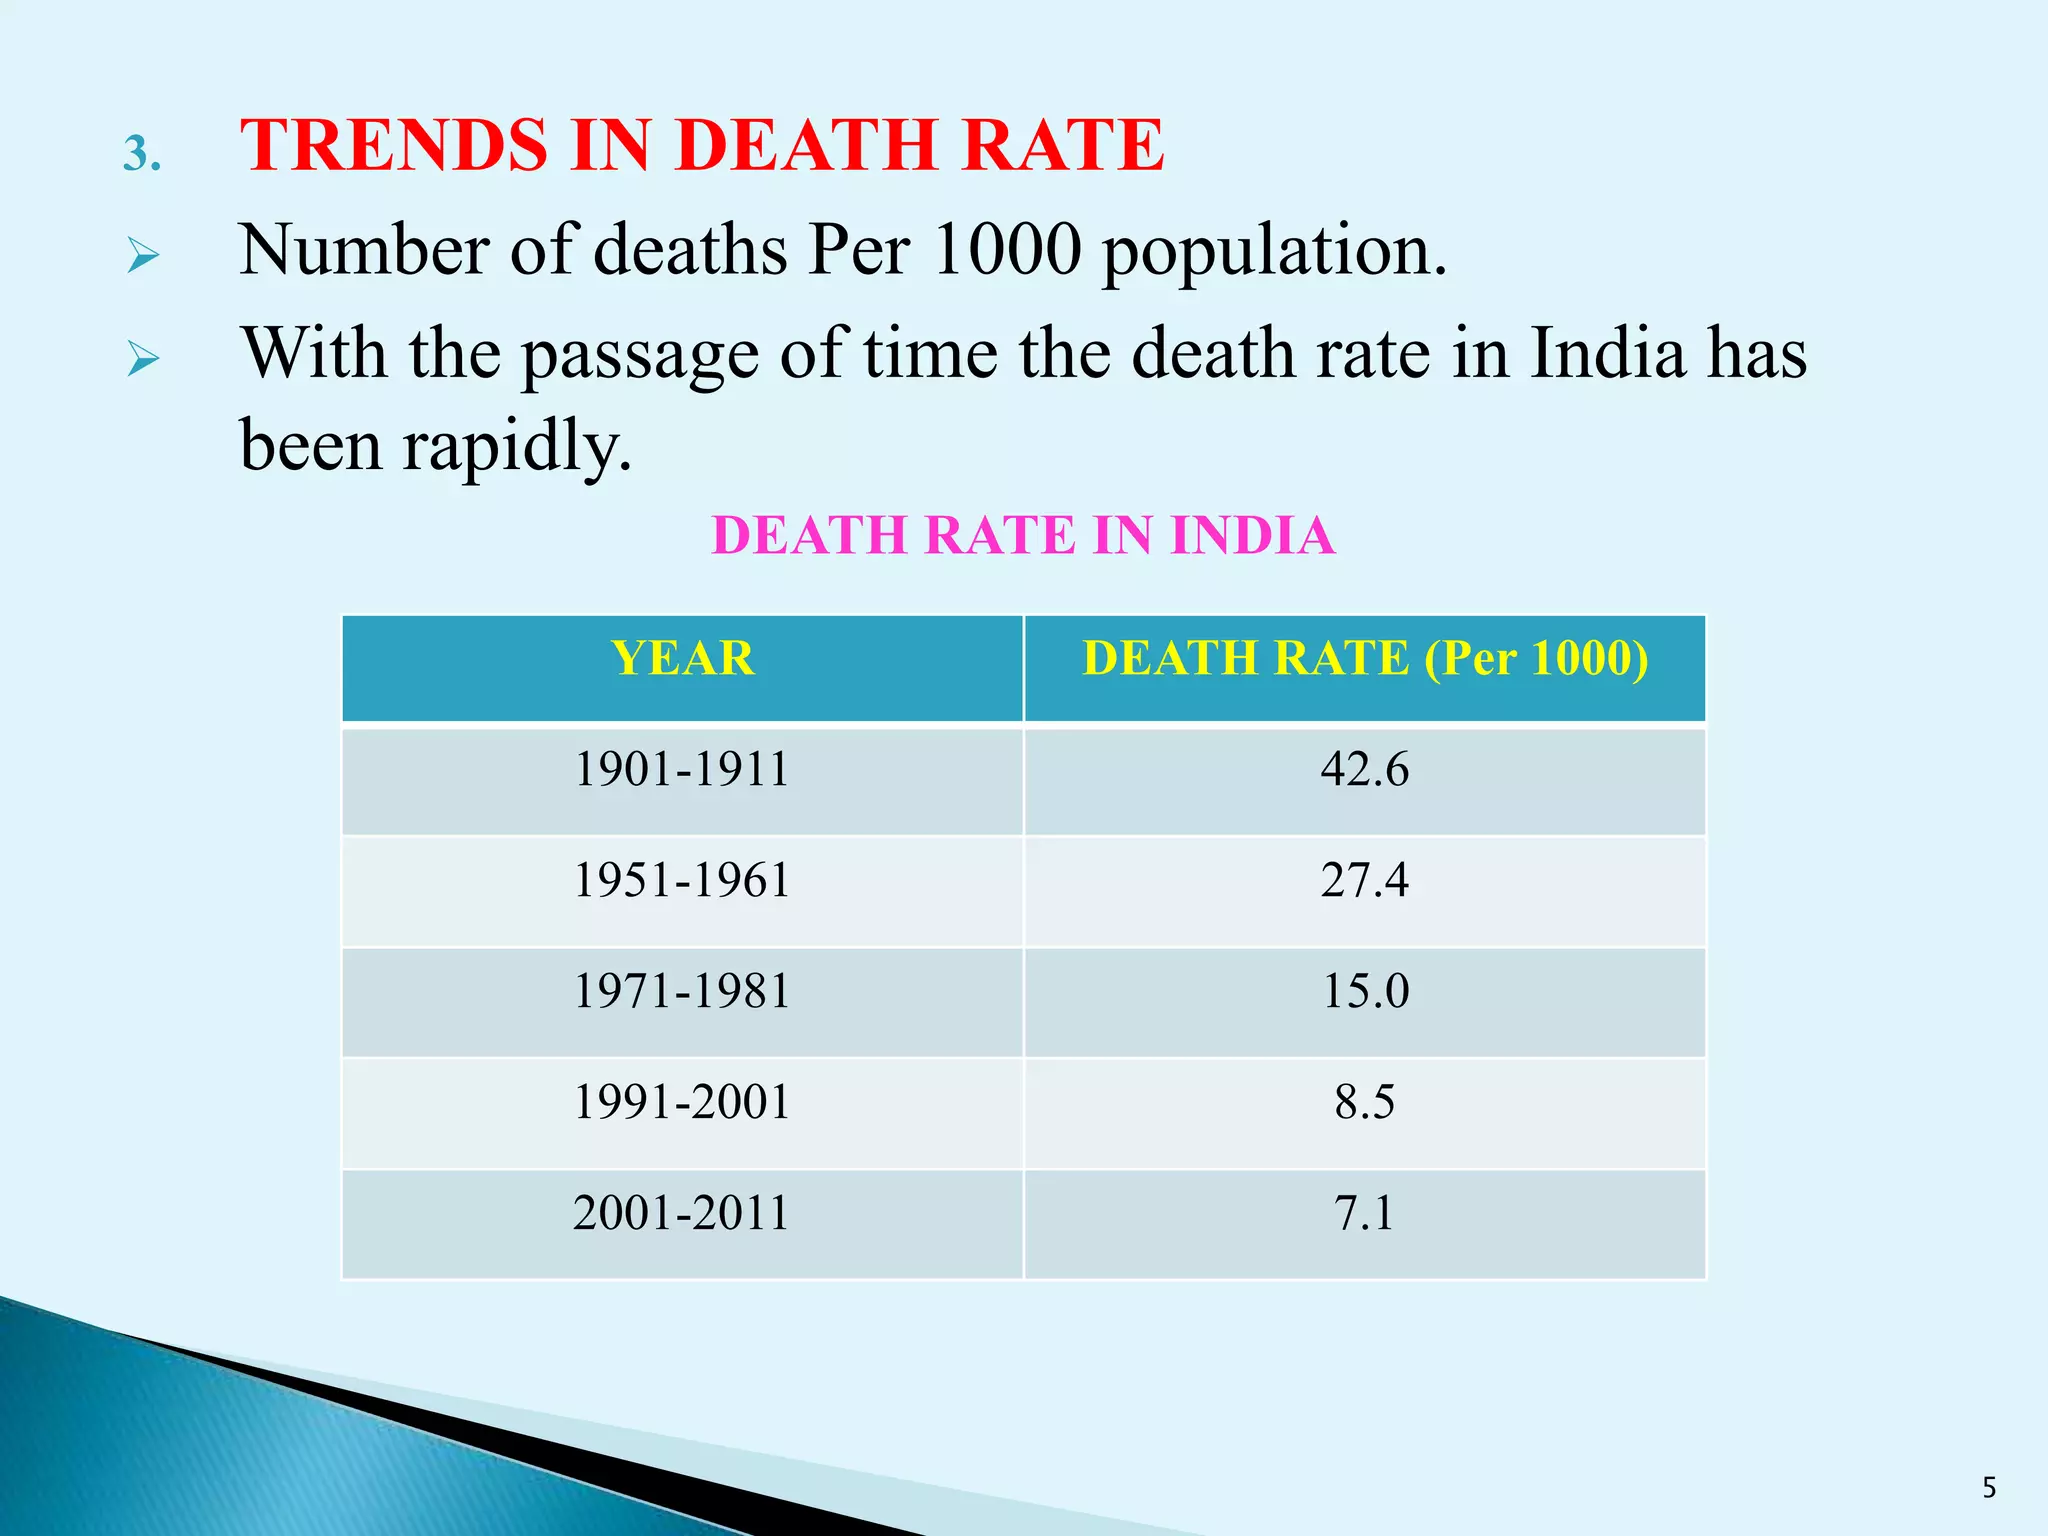
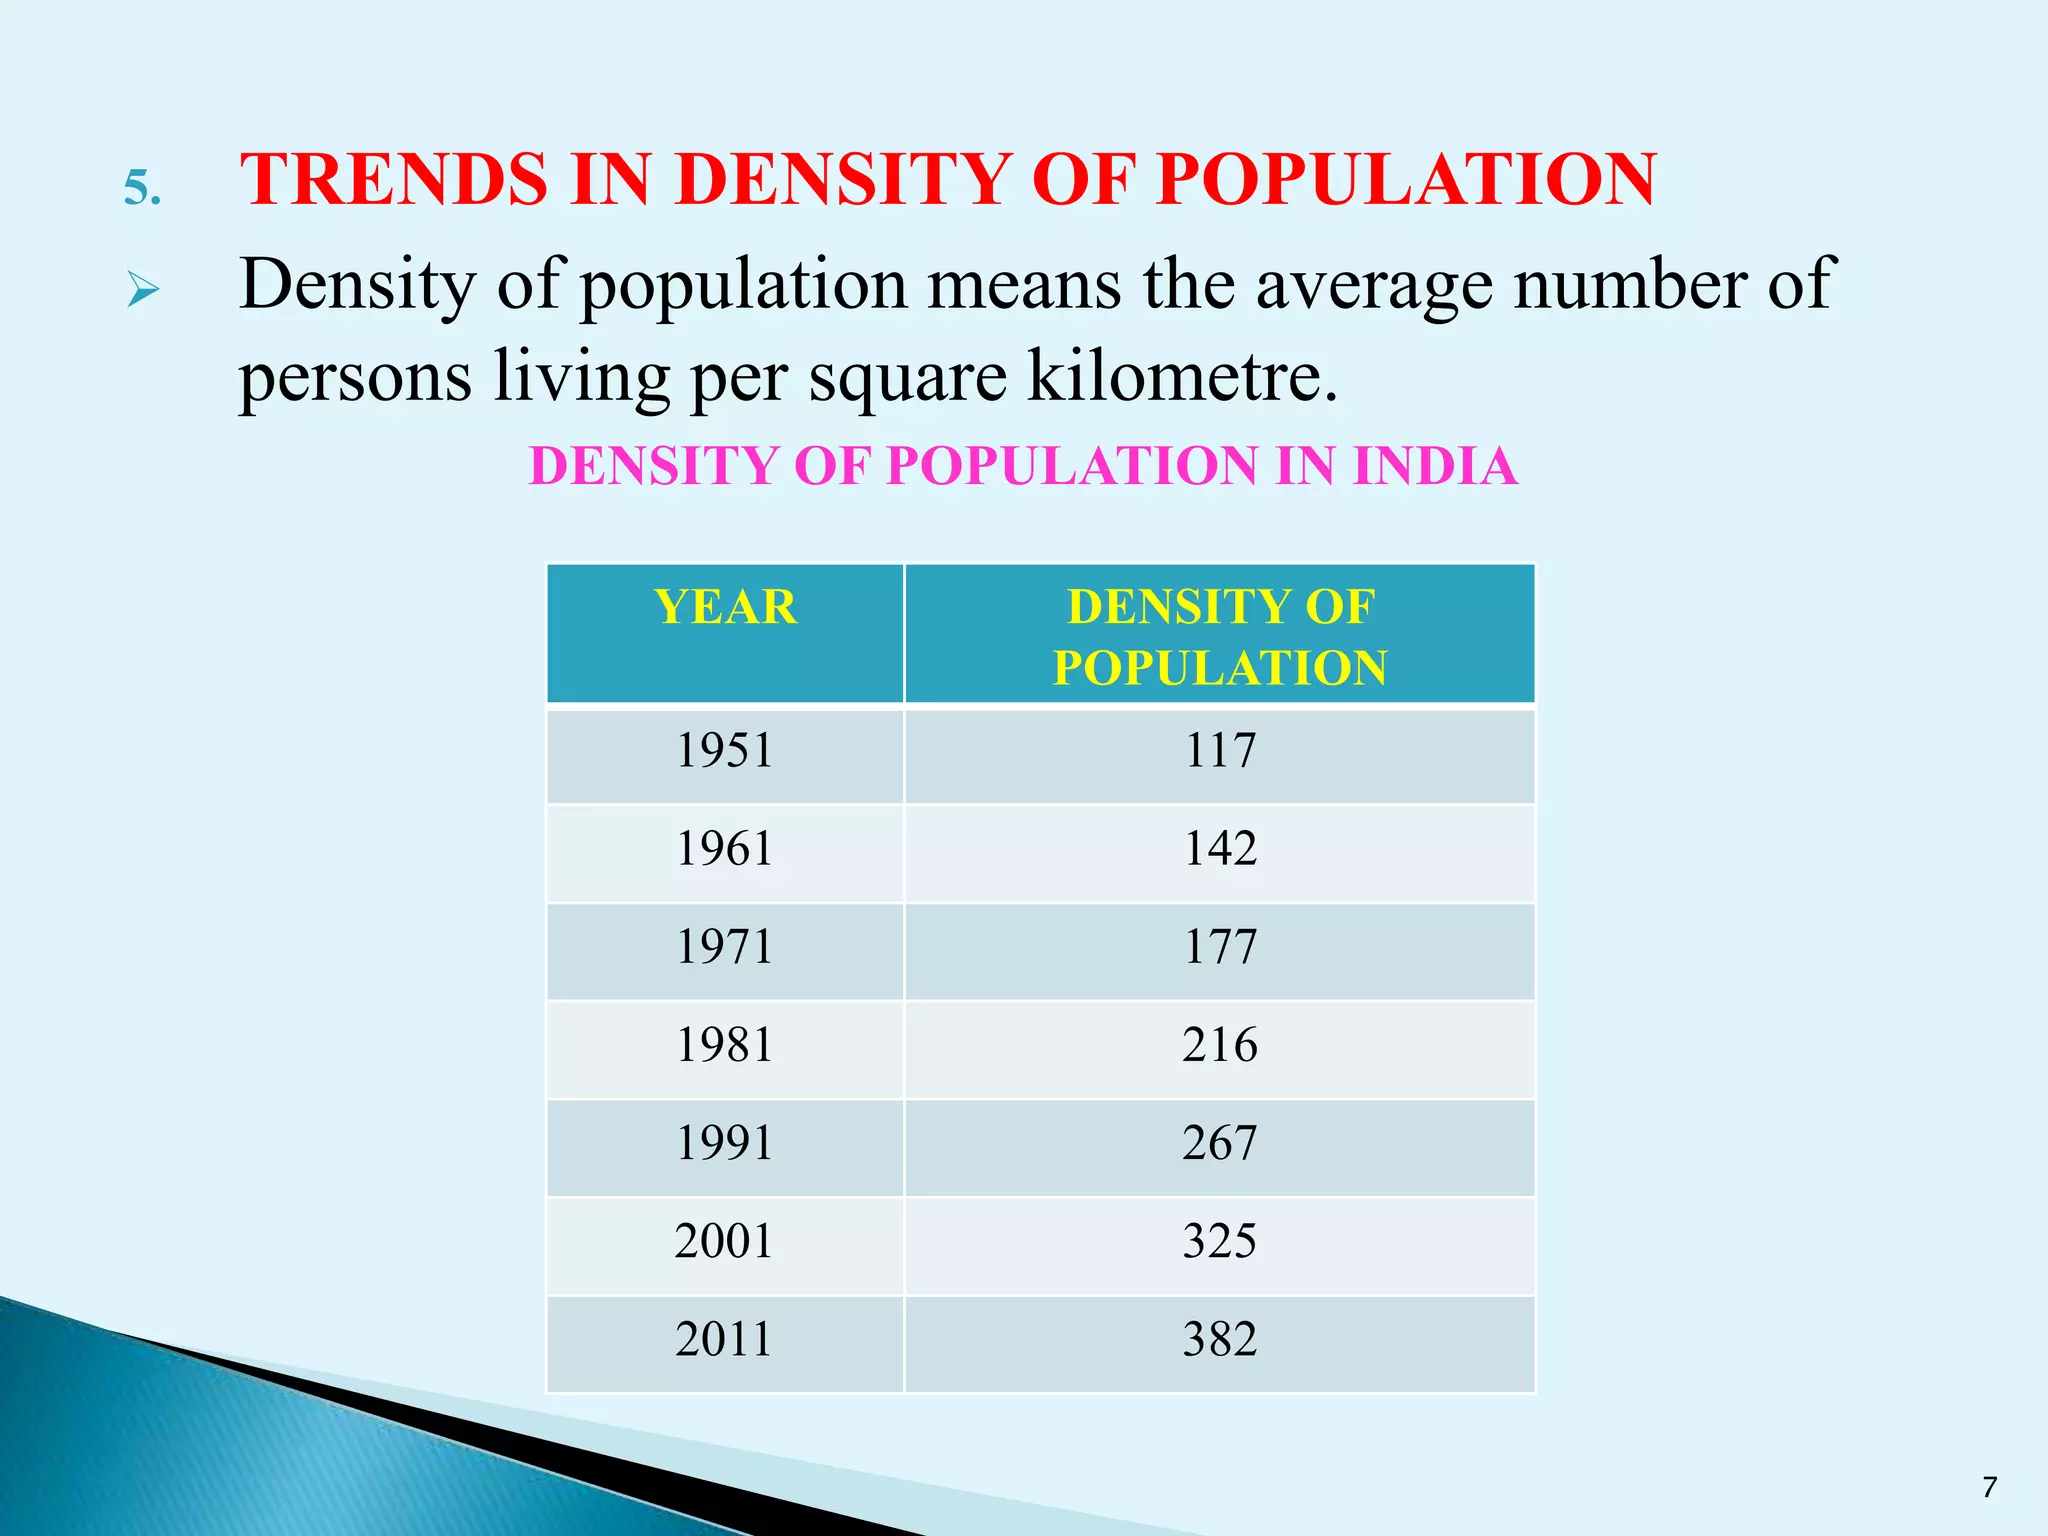
Mr. NithinKumar S
Assistant Professor
Department of Economics
St. Aloysius College (Autonomous)
Mangaluru - 575003
1
 Population of an economy is a significant determinant
of Economic Development.
 Population is the source of HUMAN CAPITAL which
is required for the economic development.
 Population also plays an important role as the
CONSUMERS in the market. They provide market
for goods and services which are produced in the
economy.
2
1. Size of Population
 India possesses 2.4% of total Land area of the world.
 India is having 17% of the world population.
 According to 2011 census India’s population,
3
YEAR POPULATION
1951 361 million
2011 1210 million
2. HIGH BIRTH RATE
 Growth of population in a country depends on the
excess of birth over death.
 Birth rate means the number of children born per 1000
of living population.
BIRTH RATE IN INDIA
4
YEAR BIRTH RATE (Per 1000)
1961-1970 41.2
1981-1991 29.9
1991-2001 25.8
2001 21.8
3. TRENDS IN DEATH RATE
 Number of deaths Per 1000 population.
 With the passage of time the death rate in India has
been rapidly.
DEATH RATE IN INDIA
5
YEAR DEATH RATE (Per 1000)
1901-1911 42.6
1951-1961 27.4
1971-1981 15.0
1991-2001 8.5
2001-2011 7.1
4. GROWTH RATE OF POPULATION
 Population in India is growing at a very high rate.
GROWTH RATE OF POPULATION IN INDIA
6
YEAR
GROWTH RATE OF
POPULATION (%)
1951-1961 1.89
1971-1981 2.22
1981-1991 2.11
1991-2001 1.93
2001-2011 1.67
5. TRENDS IN DENSITY OF POPULATION
 Density of population means the average number of
persons living per square kilometre.
DENSITY OF POPULATION IN INDIA
7
YEAR DENSITY OF
POPULATION
1951 117
1961 142
1971 177
1981 216
1991 267
2001 325
2011 382
6. AGE COMPOSITION
 Study of Age Composition helpful in determining the
labour force in the Indian Economy.
PERCENTAGE OF DISTRIBUTION OF INDIA’S POPULATION
8
YEAR AGE GROUP
0-14 15-60 60+
1951 37.4 57.1 5.5
1961 41.0 53.3 5.7
1971 41.4 53.4 5.2
1981 39.7 54.1 6.2
1991 36.5 57.1 6.5
2001 35.6 58.2 6.3
2011 29.1 65.4 8.3
7. INFANT MORTALITY RATE
 Infant mortality rate is calculated as a ratio of the
number of deaths among the 1000 born children
before they reach their first birthday.
INFANT MORTALITY RATE IN INDIA
9
YEAR INFANT
MORTALITY
RATE
1921 218
1971 129
1981 110
2001 68
2011 44
8. SEX COMPOSITION
 This shows male female ratio.
SEX RATIO IN INDIA
10
YEAR FEMALE PER
1000 MALE
1901 972
1941 945
1951 946
1971 930
1981 934
1991 927
2001 933
2011 940
9. CHILD SEX RATIO
 It refers to the number of female children per 1000
male children in the Age Group of 0-6 years.
CHILD SEX RATIO
11
YEAR CHILD SEX RATIO
1951 983
1961 976
1971 964
1981 962
1991 945
2OO1 927
2011 914
10. RURAL – URBAN DISTRIBUTION
PERCENTAGE DISTRIBUTION OF INDIA’S POPULATION BETWEEN
URBAN AND RURALAREAS
12
YEAR RURAL POPULATION (%)
URBAN POPULATION
(%)
1951 82.6 10.8
1961 81.7 18.3
1971 79.8 20.3
1981 76.3 23.7
1991 74.3 25.7
2001 72.2 27.8
2011 68.8 31.2
11. LIFE EXPECTANCY
 It refers to the average number of years the people of a
country expect to live at the time of birth.
 It depends mainly on the death rate and the age at the
time of death.
LIFE EXPECTANCY IN INDIA
13
YEAR LIFE EXPECTANCY MALE FEMALE
1951-1961 41.2 41.9 40.6
1971-1981 54 54.1 54.7
2011 65.5 63.9 66.9
12. LITERACY RATE IN INDIA
LITERACY RATE IN INDIA
14
YEAR LITERATE
PERSONS (%)
MALE (%) FEMALE (%)
1951 16.7 25.0 7.9
1971 29.5 39.4 18.7
1981 36.1 46.6 24.8
1991 52.21 64.1 39.3
2001 65.38 75.85 54.16
2011 74.04 82.14 65.5

Population and Economic Development

  • 1.
    Mr. NithinKumar S AssistantProfessor Department of Economics St. Aloysius College (Autonomous) Mangaluru - 575003 1
  • 2.
     Population ofan economy is a significant determinant of Economic Development.  Population is the source of HUMAN CAPITAL which is required for the economic development.  Population also plays an important role as the CONSUMERS in the market. They provide market for goods and services which are produced in the economy. 2
  • 3.
    1. Size ofPopulation  India possesses 2.4% of total Land area of the world.  India is having 17% of the world population.  According to 2011 census India’s population, 3 YEAR POPULATION 1951 361 million 2011 1210 million
  • 4.
    2. HIGH BIRTHRATE  Growth of population in a country depends on the excess of birth over death.  Birth rate means the number of children born per 1000 of living population. BIRTH RATE IN INDIA 4 YEAR BIRTH RATE (Per 1000) 1961-1970 41.2 1981-1991 29.9 1991-2001 25.8 2001 21.8
  • 5.
    3. TRENDS INDEATH RATE  Number of deaths Per 1000 population.  With the passage of time the death rate in India has been rapidly. DEATH RATE IN INDIA 5 YEAR DEATH RATE (Per 1000) 1901-1911 42.6 1951-1961 27.4 1971-1981 15.0 1991-2001 8.5 2001-2011 7.1
  • 6.
    4. GROWTH RATEOF POPULATION  Population in India is growing at a very high rate. GROWTH RATE OF POPULATION IN INDIA 6 YEAR GROWTH RATE OF POPULATION (%) 1951-1961 1.89 1971-1981 2.22 1981-1991 2.11 1991-2001 1.93 2001-2011 1.67
  • 7.
    5. TRENDS INDENSITY OF POPULATION  Density of population means the average number of persons living per square kilometre. DENSITY OF POPULATION IN INDIA 7 YEAR DENSITY OF POPULATION 1951 117 1961 142 1971 177 1981 216 1991 267 2001 325 2011 382
  • 8.
    6. AGE COMPOSITION Study of Age Composition helpful in determining the labour force in the Indian Economy. PERCENTAGE OF DISTRIBUTION OF INDIA’S POPULATION 8 YEAR AGE GROUP 0-14 15-60 60+ 1951 37.4 57.1 5.5 1961 41.0 53.3 5.7 1971 41.4 53.4 5.2 1981 39.7 54.1 6.2 1991 36.5 57.1 6.5 2001 35.6 58.2 6.3 2011 29.1 65.4 8.3
  • 9.
    7. INFANT MORTALITYRATE  Infant mortality rate is calculated as a ratio of the number of deaths among the 1000 born children before they reach their first birthday. INFANT MORTALITY RATE IN INDIA 9 YEAR INFANT MORTALITY RATE 1921 218 1971 129 1981 110 2001 68 2011 44
  • 10.
    8. SEX COMPOSITION This shows male female ratio. SEX RATIO IN INDIA 10 YEAR FEMALE PER 1000 MALE 1901 972 1941 945 1951 946 1971 930 1981 934 1991 927 2001 933 2011 940
  • 11.
    9. CHILD SEXRATIO  It refers to the number of female children per 1000 male children in the Age Group of 0-6 years. CHILD SEX RATIO 11 YEAR CHILD SEX RATIO 1951 983 1961 976 1971 964 1981 962 1991 945 2OO1 927 2011 914
  • 12.
    10. RURAL –URBAN DISTRIBUTION PERCENTAGE DISTRIBUTION OF INDIA’S POPULATION BETWEEN URBAN AND RURALAREAS 12 YEAR RURAL POPULATION (%) URBAN POPULATION (%) 1951 82.6 10.8 1961 81.7 18.3 1971 79.8 20.3 1981 76.3 23.7 1991 74.3 25.7 2001 72.2 27.8 2011 68.8 31.2
  • 13.
    11. LIFE EXPECTANCY It refers to the average number of years the people of a country expect to live at the time of birth.  It depends mainly on the death rate and the age at the time of death. LIFE EXPECTANCY IN INDIA 13 YEAR LIFE EXPECTANCY MALE FEMALE 1951-1961 41.2 41.9 40.6 1971-1981 54 54.1 54.7 2011 65.5 63.9 66.9
  • 14.
    12. LITERACY RATEIN INDIA LITERACY RATE IN INDIA 14 YEAR LITERATE PERSONS (%) MALE (%) FEMALE (%) 1951 16.7 25.0 7.9 1971 29.5 39.4 18.7 1981 36.1 46.6 24.8 1991 52.21 64.1 39.3 2001 65.38 75.85 54.16 2011 74.04 82.14 65.5